Insurance Department Recovers $6 Million for Policyholders, Taxpayers in 2015; Recoveries, Fines Both At 4-Year Low
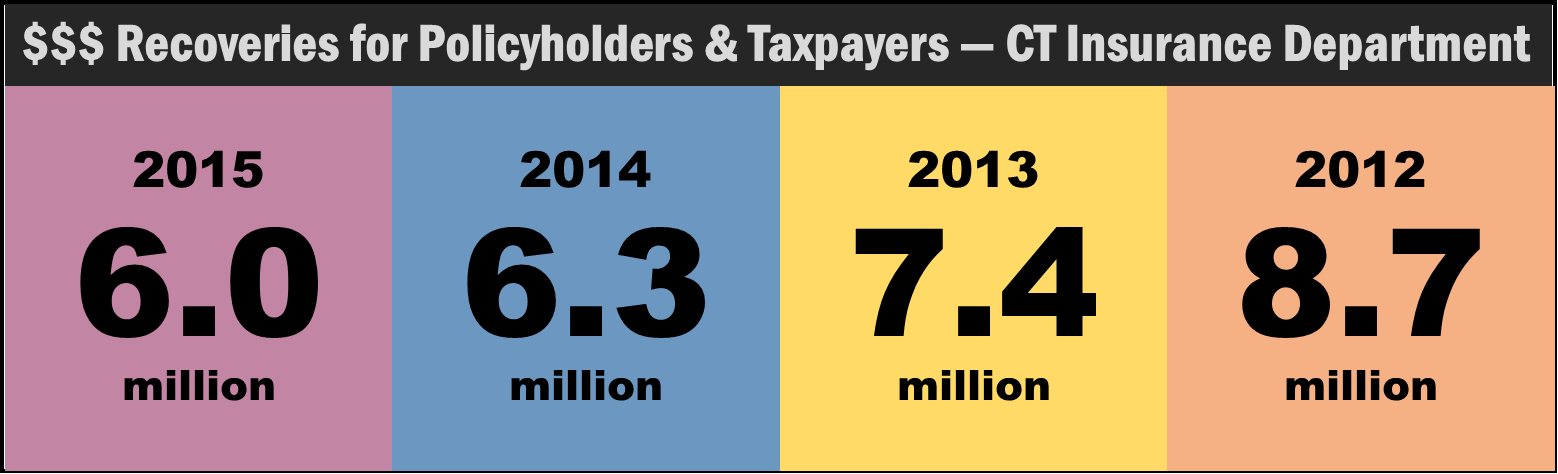
The Connecticut Insurance Department recovered approximately $6 million for policyholders and taxpayers in 2015, helping individuals and families with their claims and complaints.  The total dollar amount of the recoveries declined for the third consecutive year, down from a high of $8.7 million in 2012, $7.4 million in 2013 and $6.3 million in 2014. Officials indicated that the Department’s Consumer Affairs Unit (CAU) fielded more than 6,100 complaints and inquiries and helped policyholders recoup more than $4 million from January 1 to December 31, 2015.  The number of complaints and inquiries dropped slightly from the previous year, when 6,500 were handled, recouping $4.3 million for policy owners.  In 2013, policyholders saw $4.7 million returned.  In 2012, the numbers were virtually identical to 2015.ctInsuranceDept

“Behind these statistics are the individuals and families the Department was able to help through our intervention,” Commissioner Katharine L. Wade said. “In many cases we were able to make a real difference in their lives and I encourage anyone with questions or concerns about their insurance to contact the Department. We are here to help consumers.”

The department, in announcing the annual totals for 2015, also highlighted some individual recoveries, including:

  • $27,000 for home health care services for a senior citizen under her long-term care policy
  • $13,000 to pay for speech therapy for an autistic child
  • $16,000 paid to a policyholder for an inpatient stay at a skilled nursing facilityrecoveries
  • $37,000 in an additional payment to a homeowner to settle a claim

“Our staff makes certain that companies and agents comply with all state insurance laws and regulation and have extensive knowledge to answer a wide range of insurance questions,” the Commissioner said.

In addition to recoveries for policyholders, the Department’s Market Conduct division levied approximately $1.7 million in fines against carriers and returned that money to the state General Fund in 2015. The fines resulted from a variety of violations and settlements ranging from untimely claim payments to improper licensing. That was the lowest total for fines in recent years, perhaps signifying greater compliance.  In 2014, fines totaled $2.03 million, in 2013 the total was $2.7 million and in 2012 fines levied totaled $4.6 million.

The majority of the funds recovered for policyholders stemmed from complaints over health, accident, homeowners and life and annuities policies.

The following is the breakdown of funds recovered in 2015:

  • Accident, Health - $2.7 million, compared with $2.5 million in 2014
  • Auto - $430,000, compared with $381,000 in 2014
  • General Liability - $17,200, compared with $65,000 in 2014
  • Homeowners - $530,000, compared with $65,000 in 2014
  • Life, Annuities - $294,000, compared with $330,000 in 2014

Recoveries in 2013 were largely focused on homeowners, as a result of Superstorm Sandy-related claims. Department recoveries in 2012 reflect the impact of claims from 2011 Storm Irene and the late October snow-filled Nor’easter that landed in Connecticut.

The Department calculates its consumer recoveries based on what the policyholder received as a result of the Department’s intervention. The inquiries and complaints also help the Department identify industry trends that may adversely affect consumers and trigger investigation by the Market Conduct division, officials said.

In addition, complaint data also help determine topics for consumer education and serve as tools to help the Department monitor the industry.  The Market Conduct enforcement actions are posted on the Department’s web site at www.ct.gov/cid

Yelp Means Help for Three Hartford-Area Nonprofits

Three Hartford area nonprofit organizations have received a financial boost from the charitable foundation of Yelp, the website of business recommendations. This past fall, Yelp nominated three non-profit organizations in 75 cities around the country that support the Yelp Foundation’s mission of addressing the needs of local communities, including access to information, education, local economic development, and freedom of expression. In Hartford, those organizations were The Connecticut Forum, Literacy Volunteers of Greater Hartford and reSET Social Enterprise Trust. yelp

The Yelp Foundation announced it would grant $5,000 to the organization with the most votes at the end of a web-based public voting campaign. The second and third place winners would be granted $3,000 and $2,000 respectively. Individuals could vote once each day during the two-week web voting period.

The Foundation announced this week that the top-vote getter, The Connecticut Forum, will be receiving a $5,000 grant.  Literacy Volunteers of Greater Hartford will be receiving a $3,000 grant; reSET Social Enterprise Trust will receive $2,000.CT Forum

The Yelp Foundation's mission is to support charitable organizations and activities addressing the needs of local communities, including access to information, education, local economic development, and freedom of expression, and to promote a culture of philanthropy among employees of Yelp Inc. Nationwide, 225 organizations will be receiving grants totaling $750,000.

The Connecticut Forum presents live, unscripted conversations among renowned experts and celebrities, and community outreach programs including the Connecticut YOUTH Forum. The organization’s mission: “to encourage the free and active exchange of ideas in Forums that inform, challenge, entertain, inspire and build bridges among all people and organizations in our community.”

literacyLiteracy Volunteers of Greater Hartford is a private non-profit organization that has provided adult literacy services in Greater Hartford since 1972. Their “vision is to build a stronger, more resilient Greater Hartford by creating a community of fully literate adults.”  Annually, the organization now serves over 850 adults in 20 towns throughout the region.

reSET is a non-profit organization whose mission is to advance the social enterprise sector. Its strategic goals are threefold: to be the “go-to” place for impact entrepreneurs, to make Hartford the Impact City, and Connecticut the social enterprise state. reSET serves all entrepreneurs, but specializes in social enterprise ― impact drivenPicture3 business with a double and sometimes triple bottom line. In addition to providing co-working space and accelerator and mentoring programs, reSET aims to inspire innovation and community collaboration, and to support entrepreneurs in creating market-based solutions to community challenges.

reSETYelp was founded in 2004 to help people find great local businesses like dentists, hair stylists and mechanics.  Yelp had a monthly average of 89 million unique visitors who visited Yelp via their mobile device in the third quarter of 2015, according to the company, which also notes that “Yelpers” have written more than 90 million reviews since the company’s inception.

In 2011 Yelp Inc. established the Yelp Foundation with one percent of company equity to support charitable organizations and activities addressing the needs of local communities, including access to information, education, local economic development, and freedom of expression, and to promote a culture of philanthropy among employees of Yelp Inc.

The Foundation accomplishes its charitable goals by making grants to deserving nonprofits throughout the U.S. and matching donations made to charities by Yelp employees up to $1,000 per person per year, according to the Foundation website.   In 2014, the Foundation committed $1 million to charity.  To learn more about the Yelp Foundation, visit http://www.yelpfoundation.org/


Bullying Is Parents Top Concern, Depression Next

Across the country, parents with children under age 18 are most concerned about their child being bullied, with 6 in 10 expressing that concern.  The next most prevalent concern – expressed by a majority of those surveyed by the Pew Research Center – is that their child will struggle with anxiety or depression.  Fifty-four percent have that concern. Noting that comprehensive statistics on bullying are difficult to obtain, Pew referenced the 2013 Youth Risk Behavior Study (which covered only high-school students) finding that 19.6 percent had been bullied on school property in the previous 12 months, and 14.8 percent had been electronically bullied. In both cases, white teens and female teens were more likely to say they’d been bullied.FT_16.01.05_parentalConcerns

Connecticut’s statistics were higher than the national average in both categories.

In the 2012-13 school year, there were more than 1,400 incidents which an investigation was conducted and active bullying was concluded to have occurred, according to the state Department of Education.  The most recent data posted on the department’s website indicates that “21.9% of Connecticut students had been bullied on school property. Nationwide, the rate is 19.6%. In Connecticut, the prevalence of having been bullied on school property is significantly higher among females (26.1%) than among males (17.9%). The prevalence of having been bullied on school property is significantly higher in grade 11 among students in CT (22.8%) than in the US (16.8%).”

The Youth Risk Behavior Study also indicated that 17.5% of Connecticut students had been electronically bullied. Nationwide, the rate is 14.8%, according to the study report.youth risk report CT

Earlier this month, the parents of a high school freshman in Westport who died last month asked the local Superintendent of Schools to investigate reports that their son may have been the target of bullying and the nature of widespread social-media comments about his death among students.

In a letter to school officials, the parents wrote: “several current Staples High School students have reported observing bullying, humiliating or inappropriate behavior by one or more peer or peers toward others, and these students report that they do not know how to respond or intervene. They feel guilty and ashamed of their inaction and passive consent to the blatant behaviors. This is a critical area needed to stop these types of malevolent behaviors.”

Published reports indicate that police have found no evidence of bullying in the student's death.

The likelihood of their child facing anxiety and depression is also of great concern to parents, ranked second-highest in the survey.  About one-in-ten adolescents, or around 2.6 million, have experienced major depression in the past year, according to 2013 data reported by National Institute of Mental Health, the Pew report indicated; for 7.7 percent, their depression caused severe impairment.

Depression was three times as common among teen girls as teen boys (16.2% versus 5.3%). Available data suggest that a quarter of teens have experienced some sort of anxiety disorder (such as phobias, panic disorder or post-traumatic stress disorder) at some point in their lives, according to the National Institute of Mental Health.

The nationwide survey by the Pew Research Center survey also found that the nature of parental concerns varies considerably across demographic groups.  The research found, for example that:

  • low-income parents are more concerned about teen pregnancy and their kids getting in trouble with the law than are higher-income parents.
  • Black parents are more likely than white parents to worry about their children being shot, while white parents are more likely than black parents to worry tFT_15.12.21_parentalConcerns_shoothat their children will struggle with anxiety or depression.
  • Hispanic parents worry more than black or white parents in all eight areas of concern, from being bullied to having problems with drugs or alcohol

Pew Research Center points out that in 2014, the rate of firearm deaths for black youths was 4.26 per 100,000, almost three times the rate for white youths and nearly four times the rate for Hispanic youths. Hospital emergency departments, from which the Centers for Disease Control and Prevention gathers its injury data, don’t always obtain information on race and ethnicity for their patients, the report noted. But based on the 80 percent or so of nonfatal firearm injury cases involving juveniles in 2013 for which race and ethnicity data are available, the disparity among different subpopulations was stark: 1.68 per 100,000 for white youths, 5.3 per 100,000 for Hispanic youths and 24.67 per 100,000 for black youths, the Pew report indicated.

The report also indicated that every state in the nation, as well as the District of Columbia, has a lower teen birthrate than it did in the early 1990s. The birthrate for 15- to 19-year-olds (the metric tracked by federal researchers) has been dropping for decades, Pew pointed out, and hit a record low in 2014. There were just 24.2 births per 1,000 teen females that year, compared with 61.8 per 1,000 in 1991 and 41.5 as recently as 2007.


Rockies, Yard Goats Extend Relationship; Among Top 10 Farm Systems in MLB

When the Hartford Yard Goats take up residence at the new Dunkin’ Donuts Park later this spring, they will continue to be a Double-A farm team of the National League’s Colorado Rockies, which run one of major league baseball’s top 10 farm systems, according to a pre-season analysis  by the website minorleagueball.com. At the top of the rankings – the “elite” organizations – are the Chicago Cubs, Boston Red Sox, Minnesota Twins, Los Angeles Dodgers and Texas Rangers.  The next five, described as organizations that “should be considered very productive with a chance to move into the top group soon,” include the New York Mets, Pittsburgh Pirates, Toronto Blue Jays, Colorado Rockies and Houston Astros.  The New York Yankees farm system was ranked at #13. Primary_Logo_for_the_Hartford_Yard_Goats

The Hartford Yard Goats Double-A baseball club will launch its inaugural season at home in Hartford on May 31, a delayed opening due to stadium-construction delays.  The team will begin its season playing on the road in April and May.  The Yard Goats will play the Boston Red Sox affiliate Portland Seadogs in June and July of 2016, the New York Yankees affiliate Trenton Thunder in August, and the Binghamton Mets in July and August.

When they finally arrive home, it appears that the Rockies-Yard Goats relationship will not be short-lived.  This week, the Colorado Rockies announced a player-development contract extension for another two years with the Hartford Yard Goats. It will keep the two teams together through the 2018 season.  The original agreement signed in the fall of 2014 was set to expire at the conclusion of this season.

The Yard Goats recently announced the addition of a third founding sponsor.  Stamford's Frontier Communications, which has expanded its Connecticut telecom offerings through its $2 billion acquisition of AT&T landline assets last year, will pay an undisclosed sum for the right to display its signage inside and outside the $66 million stadium under construction in the Downtown North neighborhood.Colorado_Rockies_logo.svg

The company's name will also be on the Frontier Communications Stadium Club, and the deal includes provision of free Wi-Fi for fans at home games.  Frontier joins founding sponsors Travelers and The Hartford Financial Services Group. In addition, Dunkin' Donuts owns the naming rights to the stadium.

Playing lwpopast season as the New Britain Rock Cats, the team finished with a record of 69-71, a fourth place spot in the six-team Eastern League’s Eastern Division.

The Hartford Yard Goats have also announced that all 142 games (home and away) will be broadcast live on News Talk 1410AM (WPOP) and will be available for fans to listen on iHeartRadio. News Talk 1410AM will serve as the Yard Goats flagship station over the next three seasons, through 2018. Veteran broadcaster Jeff Dooley will be the "Voice of the Yard Goats" and lead play-by-play announcer for the games.

Caregiving Is Critical Issue as "Incredible Demographic Transformation" Continues, Aging Report Stresses

The United States continues to experience “incredible demographic transformation,” according to the Final Report of the White House Conference on Aging (WHCOA), a year-long, nationwide endeavor throughout 2015. In Connecticut, with the nation’s 7th oldest population, input was provided by legislative and executive branch agencies, which held hearings and offered expert testimony from organizations including AARP, the state Department on Aging, Legislative Committee on Aging and Commission on Aging. “No topic attracted more attention in the lead-up and follow-up to the 2015 WHCOA than caregiving. It echoed across all four of the conference issue areas,” the report indicated, referencing the four common themes that emerged as particularly important to older Americans: Retirement Security, Healthy Aging, Long-Term Services and Supports, and Elder Justice.cover  The final report noted the participation, at the Boston Regional Forum, of Connecticut’s Commissioner of the Department of Public Health, Jewel Mullen.

Among the findings in the report, issued by the White House, that will demand the attention of policy makers in the next decade:

  • Over 10,000 baby boomers are turning 65 every day, and the fastest growing demographic in the U.S. is women over age 85. The proportion of older adults representing racial and ethnic minorities is also increasing rapidly.
  • There is a need to break down the silos between housing, transportation, health care, and long-term services and supports in order to support healthy aging. The United States must also take advantage of an “increasing array of web-based technologies, robotics, and mobile devices” that “help older adults access the services they need, stay connected to family and friends, and remain active and independent.”
  • The majority of assistance for older Americans is generally provided at home by informal caregivers, especially family and friends, and are often the “primary lifeline, safety net, and support system for older adults.” Although rewarding, caregiving can be demanding, and “informal caregivers need to be supported and sustained with appropriate resources.”
  • With family structures changing as Americans are having fewer children and increasingly moving away from families of origin, the availability of family members to provide care is diminishing. “Direct care is a demanding profession with low wages, long hours, and limited benefits. It is critical for there to be efforts to recruit and retain a sufficient number of direct-care workers to keep pace with the growing need.”chart

The White House has held a Conference on Aging every decade, beginning in 1961, to identify and advance actions to improve the quality of life of older Americans. In 2015, the United States marked the 50th anniversaries of Medicare, Medicaid, and the Older Americans Act, as well as the 80th anniversary of Social Security. The White House Conference on Aging provided "an opportunity to recognize the importance of these key programs as well as to look ahead to the next decade."

At a public hearing in May at Connecticut's Legislative Office Building, state officials noted that Connecticut is undergoing a “permanent and historic transformation” in its demographics.  Statistics released as part of the WHCOA report echoed that observation.

65-600x249On July 13, 2015, President Obama hosted the sixth White House Conference on Aging, joining older Americans and their families, caregivers, and advocates at the White House and virtually through hundreds of watch parties across the country.

The July event built on a year-long dialogue; the White House Conference on Aging launched a website to share regular updates on its work and solicit public input; engaged with stakeholders in Washington, D.C. and listening sessions throughout the country; developed policy briefs on the emerging themes for the conference and invited public comment and input on them; and hosted regional forums with community leaders and older Americans in Tampa, Florida; Phoenix, Arizona; Seattle, Washington; Cleveland, Ohio; and Boston, Massachusetts.  Additional hearings, including those in Connecticut, were shared with conference officials.  Individuals and groups participated via live webcast in watch parties held in every State and were able to ask questions of panelists and others via Twitter and Facebook.

The Final Report, completed in late December and publicized by the White House this week, now goes to policy makers at the federal and state level to review findings and consider policy actions to respond the critical issues cited as requiring attention.

ph-whcoa-blog-collage


Average Age of Mothers Increasing in CT and Nationwide, Federal Data Reveals

First-time mothers are older than ever, new federal data has revealed.  Since 2000, the average mother’s age at the birth of her first child has increased in every state in the nation, rising 1.9 years or more in D.C., California, Oregon, and Utah, while increasing by less than a year in Connecticut, Michigan, New Hampshire, and West Virginia. Overall, the average age of mothers has increased from 2000 to 2014 for all birth orders, with age at first birth having the largest increase, up from 24.9 years old in 2000 to 26.3 years in 2014, according to newly released data compiled by the Centers for Disease Control and Prevention.  Connecticut is among a dozen states with the smallest increases in the average age of first-time mothers. graph

The federal agency points out that “a mother's age at birth, and particularly the average age when a mother has her first child, is of interest to researchers and the public. Mean age can affect the total number of births a mother has over a lifetime, which in turn impacts the composition and growth of the U.S. population. Age of mother is associated with a range of birth outcomes, such as multiple births and birth defects, the agency noted.

The largest factor in the rise a mother’s average age when her first child is born is the decline in the proportion of first births to mothers under age 20, down 42 percent from 2000 to 2014, or from approximately 1 in 4 births to 1 in 7.

Increases in the average age for all birth orders were most pronounced from 2009 to 2014, according to the data.  While the average age at the birth of a mother’s first child was fairly stable for the first half of this time period, greater increases were observed from 2009 (25.2 years) to 2014 (26.3 years).new mom

Increases from 2000 to 2014 in average age for higher birth orders were less than those for first births, rising 1.4 years for first births, 1.0 years for second births, 0.8 years for third- and fourth-order births, and 0.5 years for fifth- and higher-order births.  As a result of the different rate of increases by birth order, the gap in the average age between sequential birth orders is less than previously. For example, the difference in a mother’s average age at first birth compared with the mean age at second birth was 2.8 years in 2000 and fell to 2.4 years in 2014.

States with larger increases (1.7 years or more) in the average age at first birth tended to be in the western United States (California, Oregon, Washington, Utah, and Colorado), the data indicated. Greater increases were also seen in Illinois, Arkansas, and D.C.

map
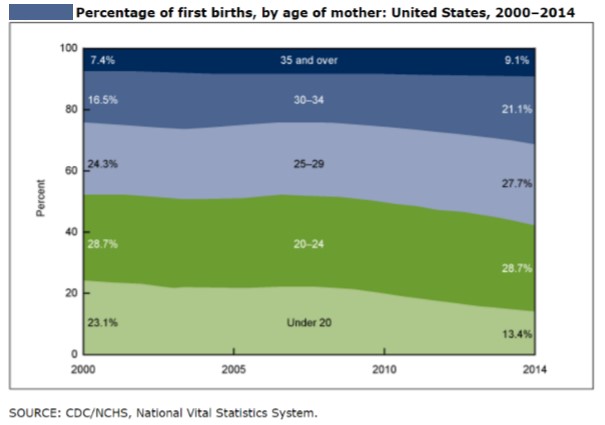
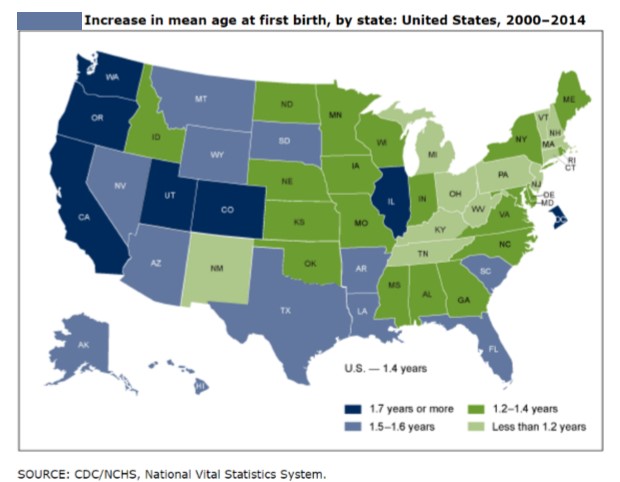
The report emphasized that over the past several decades, the United States continued to have a larger number of first births to older women along with fewer births to mothers under age 20. “This trend and the more recent uptick in delayed initial childbearing can affect the number of children a typical woman will have in her lifetime, family size, and for the overall population change in the United States,” the federal agency pointed out.

This report contains data from the birth data set, which is part of the National Vital Statistics System (NVSS). NVSS contains all live births reported in the United States. The birth data set is the primary data set for analyzing birth trends and patterns in the United States.


Background Checks Up 71 Percent in Past Five Years in CT, 12th Highest Increase in U.S.

Between 2010 and 2015, the number of background checks in Connecticut related to the purchase of firearms grew by 71.4 percent, ranking Connecticut 12th in the nation in the increase in background checks, according to data compiled by Bloomberg.  The number of background checks during the five-year period increased in every state in the nation, except Utah. In Connecticut in 2010, there were 179,595 background checks conducted as part of the process of purchasing  a firearm.  In 2015, that number had increased to 307,750 during the year, the data compiled by the National Instant Criminal Background Check System (NICS) revealed.gun stats graphic

The states with the largest increased in the number of background checks, from 2010 to 2015, were Indiana (211% increase), Delaware (162%), Alabama (139%), California (115%), District of Columbia (112.6%), Florida (105.1%), Wisconsin ((96.8%) Ohio (90.3%), Illinois (79.4%) and New Jersey (78.2%).

Overall, the largest number of background checks occurred in Kentucky, with 3.2 million.  California conducted 1.7 million, Texas 1.5 million, Illinois 1.2 million, and Wisconsin 1.1 million.

The Bloomberg news website ranked the 50 states and the District of Columbia by the percentage increase in number of NICS firearm background checks from January 1, 2010 through December 31, 2015. NICS is the National Instant Criminal Background Check System.background-check

In six jurisdictions – the states of Indiana, Delaware, California, Alabama, Florida and the District of Columbia – the number of federal firearm background checks more than doubled from 2010 to 2015.

Because of varying state laws and purchase scenarios, the statistics do not represent the number of firearms sold, the data analysis indicated.


$80,000 in Grants Boost Preservation Initiatives in 7 CT Communities

Connecticut Main Street Center (CMSC), the downtown revitalization and economic development non-profit, has selected seven organizations and municipalities to receive a share of $80,400 in 2016 Preservation of Place grants. The grants will be used to provide communities in Bridgeport, Canton, Haddam, Fairfield, New Britain, New Haven (Westville Village) and Simsbury with targeted resources to increase their capacity to plan for preservation and revitalization initiatives in their downtowns and neighborhood commercial districts. place

This year's awards are notable because two applicants, Canton and New Britain, sought the grant funds to pursue the creation of tax increment financing (TIF) districts, made possible through the passage of legislation in 2015 that was proposed by a coalition led by CMSC. TIF is a financing mechanism in which an investment in a specified area is repaid over time using the increased tax revenue generated by the investment.

"The projects funded through this year's Preservation of Place round have the potential to be transformative for these communities," said John Simone, CMSC's President & CEO.  "Canton and New Britain may very well become the models for creating successful TIF districts, while Haddam's award can help set the foundation for a unified, mixed-use commercial area that marries their historic charm with a modern, connected design. Certainly, all of the communities represented are as diverse in location as in their unique character, but each has something wonderful to offer, which will only be enhanced through the use of these grant funds."

The Preservation of Place grant program provides a source of funding for new initiatives that can be integrated into, and leverage, comprehensive Main Street preservation and revitalization programs.  The funds are meant to be flexible to meet individual community need.

The 2016 recipients of Preservation of Place grant funds are:BPT creates

  • Bridgeport Downtown Special Services District - Awarded $10,400 for Bridgeport CREATES, Phase II, to assist in the pre-development activities associated with the creation of a Maker Space/ Innovation Center.
  • Town of Canton - Awarded $10,000 for a Tax Increment Financing Master Plan for Collinsville Center & the Collins Company Complex to develop a viable TIF agreement, master plan and district to help develop the historic complex.
  • Town of Haddam - Awarded $10,000 for a Market Analysis & Village District Zoning Regulations for Tylerville in order to assess viable businesses and draft zoning regulations that will allow for and promote such businesses, as well as mixed-use development, in this historic area.
  • Town of Fairfield - Awarded $10,000 for a Signage & Wayfinding Program for Downtown & Neighboring Commercial Districts to help visitors and residents navigate their way around downtown Fairfield's many prominent cultural, tourist and academic attractions.
  • New Britain Downtown District - Awarded $10,000 to work in conjunction with the City on the Creation of a Tax Increment Financing District for transit oriented development around the CTfastrak terminus.
  • Westville Village Renaissance Alliance (New Haven) - Awarded $20,000 for the Westville Village Comprehensive Plan: The Visioning Phase, a comprehensive plan to guide a sustainable and place-based approach to long-term economic and physical development.
  • Simsbury Main Street Partnership - Awarded $10,000 for a Comprehensive Parking Study of Downtown to develop specific parking recommendations, including short- and long-term solutions.

Since 2008, the Preservation of Place grant program has leveraged over $1 million of investment in local Main Street initiatives. Connecticut Main Street Center and the Preservation of Place grant program receive support from the State Historic Preservation Office, with funds from the State of Connecticut through the Community Investment Act.

Advertisers Target Hispanic and Black Youth with Unhealthy Snack Ads, UConn Center Study Finds

The University of Connecticut’s Rudd Center for Food Policy & Obesity is calling on media companies to “set nutrition standards” for snack ads aimed at children and teens and “stop targeting advertising high-calorie, nutritionally poor foods to all young people,” but “especially advertising aimed at Black and Hispanic youth.” The recommendations come in the wake of a report that found that Black and Hispanic children “are exposed to more food advertising than white non-Hispanic children” and much of it is for unhealthy foods that have a greater likelihood of adversely impact children’s health.rudd-logo-300x77

The Rudd Center’s report, Snack Facts, found that Black children saw 64 percent more snack food ads on TV compared to white children, and Black teens viewed 103 percent more compared to white teens.  The disparity, according to the report issued last fall, had increased between 2010 and 2014, the most recent year studied.  “FACTS” is an acronym for “Food Advertising to Children and Teens Score.”

The findings also indicated that in addition to a barrage of advertising for unhealthy snacks, Black children and teens saw approximately 50 percent and 80 percent more ads for healthier fruit and yogurt brands – although the positive findings were generally outdistanced by findings of concern.  Black children also saw 99 percent more ads for savory snacks and Black teens saw 129 percent more, compared with white children and teens.spanish snak ads

From 2010 to 2014, TV ads for savory snacks (salty or spicy) viewed by black children increased 48 percent and ads viewed by black teens increased 95 percent.  “Given that youth of color suffer from higher rates of obesity and other diet-related diseases,” the Rudd Center indicated, “snack food advertising likely exacerbates health disparities affecting their communities.”

Two-thirds of 2- to 5 year-olds and more than half of youth ages 6 to 19 report having three of more snacks per day, and Americans are spending more on snacks – an increase of more than $100 million from 2012 to 2015, according to data cited in the report.

The Rudd Center report found that snack advertising on Spanish language television had changed dramatically between 2010 and 2014, and not for the better:

  • Yogurt advertising declined by 93 percent, and not one fruit brand advertised on Spanish-language TV in 2014.
  • Spending on savory snack ads (salty/spicy snacks) skyrocketed 551 percent and sweet snack ads rose 30 percent.
  • Ads for unhealthy snacks comprised 88 percent of snack food ads viewed by Hispanic children on Spanish-language TV in 2014, a dramatic jump from 39 percent in 2010.

The 102-page report reviewed the advertising practices of specific companies in the snack food industry, and highlighted changes in advertising emphasis.  It also tracked trends in advertising on social media.  The advertising analysis examined 90 brands spending more than$1 million in total advertising in 2014 from 43 different companies, according to the report. chips

The report suggested that “media companies could provide lower rates for advertising that promotes nutritious foods,” noting that aggressive marketing of unhealthy snack foods to children and teens exacerbates the crisis of poor diet and related diseases among young people.”

Snack FACTS examined the nutritional quality and advertising for 90 snack food brands offered by 43 companies that were marketed to U.S. children and teens on TV, internet, and in schools in 2014. Researchers analyzed healthier snacks, including yogurt, fruit, and nuts, as well as unhealthy snacks, including sweet and savory snacks such as cookies, chips, and fruit snacks, comparing 2010 and 2014 when possible.

The report also indicates that “companies have recognized the business opportunity in marketing healthy snacks to young people,” and urges those companies to respond in children and youth’s best interest.

The Rudd Center for Food Policy & Obesity, which affiliated with UConn a year ago after a decade at Yale University, is a non-profit research and public policy organization devoted to improving the world’s diet, preventing obesity, and reducing weight stigma. The Rudd Center is described as “a leader in building broad-based consensus to change diet and activity patterns, while holding industry and government agencies responsible for safeguarding public health.”  Research related to the report was funded by a grant from the Robert Wood Johnson Foundation.snack food

CT Ranked 14th Among Smaller States for Small Business Activity; MA Is 2nd Among Large States

Small business activity is on the rise in 49 of the 50 U.S. states, according to a new report from the Kauffman Foundation. The report provides a broad index measure of small local business activity, analyzing the states in peer groups of the 25 largest states by population and the 25 smallest states by population.  Connecticut ranked 14th among the smaller 25 states, for the second consecutive year, and was the lowest-ranked New England state.CT rank The density of established small businesses per 100,000 residents increased slightly from the previous year, from 1,147.3 to 1,167.4 in 2015.  Established small businesses are defined in the study as businesses over the age of five employing at least one, but less than fifty, employees.  The rate of small business ownership also grew slightly in Connecticut, from 6.14 percent to 6.34 percent.

Demographic trends for Connecticut noted in the report indicate an increase in native-born small business ownership, and upticks in the percentage of small businesses led by Latinos, 55 to 64 year-olds, 35-44 year-olds, high school graduates and college graduates.  More small businesses are run by men than women.

Overall, what the report describes as “Main Street entrepreneurial activity – an indicator of the number of established small businesses and the number of business owners in a location – experienced a large increase in 2015, reversing a six-year downward and stagnant trend in the U.S.”Kauffman logo

"Following a post-recession downward and stagnant trend in small business activity, we're now seeing Main Street Entrepreneurship begin to rise," said E.J. Reedy, director in Research and Policy at the Kauffman Foundation. "This obviously is good news given that these small businesses make up 63 percent of all employer firms nationally."

The Kauffman Index: Main Street Entrepreneurship State Trends report includes these findings:

Among the 25 largest states, the five states with the highest activity were Minnesota, Colorado, Massachusetts, New York and New Jersey. Among the 25 smallest states, the states with the highest activity were Vermont, Montana, North Dakota, South Dakota, Wyoming, Maine, Nebraska, New Hampshire, Rhode Island, Iowa, Oregon, Idaho, and Kansas.

Insights on business owner demographics for the 25 smallest states, including Connecticut:

  • States with the highest rates of female business owners were Vermont, Montana, Wyoming, Oregon, and South Dakota.
  • States with the highest rates of older adult business owners (ages 55-64) were South Dakota, Vermont, North Dakota, Montana and Nebraska.
  • States with the highest rates of young adult business owners (ages 20-34) were South Dakota, North Dakota, Montana, Wyoming and Vermont.

state ranksTennessee is the only state that did not show an increase in established small business activity in 2015 compared with 2014.

The new Main Street Entrepreneurship Index is an indicator of small business activity, presenting trends over the past two decades, focusing on established small businesses (firms older than five years with less than 50 employees) and trends in ownership rates. The Index measures business activity along two distinct and complementary dimensions: the rate of business owners in the economy – the percentage of adults owning a business in a given month, and established small business density – the ratio of established small employer businesses compared to population.

The Kauffman Index of Entrepreneurship is the first and largest index tracking entrepreneurship across city, state and national levels for the United States, and also presents demographic characteristics of the business owners.

In a companion study and report, focusing on the nation’s largest metropolitan areas, Small business activity is on the rise 38 of the top 40 largest metropolitan areas, the top five metropolitan areas for small business activity as measured by the Index were New York, Boston, Providence, San Francisco and Portland.  The report on metropolitan areas noted that “the one to experience the biggest increase in rankings was Providence, which moved up three spots to tie with Boston for second place in the 2015 Index.”