Diverse Hispanic Workforce More Likely to Face Challenges, Report Finds

There are about 24 million workers of Hispanic descent in the United States. While this group is frequently referred to as a single entity, the reality is that these workers come from a variety of ethnic backgrounds, each with their own challenges in the labor market. A new report from the Center for Economic and Policy Research (CEPR) provides an overview of the diverse backgrounds of the Hispanic workforce, and shows how each group experiences unique challenges in the labor market, specifically in terms of unemployment, wages, poverty, language barriers, and access to health and retirement benefits.workforce

The report, “Hispanic Workers in the United States” also shows that union representation has helped to address some of these challenges. Some highlights from the report include:

  • Workers of Mexican descent are by far the largest subgroup of the Hispanic workforce (14.9 million);
  • Women make up only 43.3 percent of the overall Hispanic workforce, but they are a majority of several subgroups, including Panamanians (58.1 percent), Bolivians (53.2 percent), and Paraguayans (51.0 percent);
  • sq-social-media-logo-gray200pxby200pxAbout two-thirds of Hispanic workers are U.S. citizens – Puerto Ricans (98.7 percent) and Spaniards (90.9 percent) are the groups most likely to be citizens;
  • Hispanic workers in general are more likely than workers of any other race/ethnicity to be in poverty. Among Hispanics, Guatemalans are most likely to be members of the working poor (19.1 percent);
  • About 30 percent of Hispanic workers do not have health insurance, but over half of Guatemalan and Honduran workers lack health insurance.

hispanics-ctConnecticut’s population is 15 percent Hispanic, the 11th largest Hispanic statewide population share nationally, according to the Pew Hispanic Center.  The Latino population increased by 50 percent in Connecticut from 2000 to 2010. The highest percentage of Hispanics in Connecticut municipalities are in Hartford, Willimantic, Bridgeport, New Britain, Waterbury, Meriden, New Haven, New London, Stamford and Danbury, according to Zip Atlas. In Connecticut, Mexicans are the second largest Hispanic community in the state behind Puerto Rican residents, CT Mirror has reported. Willimantic, New Haven and Norwalk have the three highest Mexican populations in Connecticut, with 5.24 percent, 2.8 percent and 2.28 percent, according to 2013 data.

The American Immigration Council reports that the Latino share of Connecticut’s population grew from 6.5% in 1990, to 9.4% in 2000, to 14.7% (or 527,163 people) in 2013. In 2009, 94.4% of children in Latino families in Connecticut were U.S. citizens.

Orlando Rodriguez, former legislative analyst at the now-defunct state Latino and Puerto Rican Affairs Commission, told ctlatinonews.com last year that Connecticut’s future is largely dependent on how successful Latinos are in getting into the middle class, and how successful the state is in being able to create middle class jobs for them.

“Simply put,” he said, “The numbers are growing, and if Latinos don’t enter the middle class of Connecticut in large numbers, the state’s economy will feel it negatively…and if they do enter it in large numbers, the economy will grow.”

Cherrie Bucknor, author of the CEPR report explained, “Understanding the diversity and challenges faced by Hispanic workers is key to making better policy decisions.”  The Center for Economic and Policy Research (CEPR) is an independent, nonpartisan think tank that was established to promote democratic debate on the most important economic and social issues that affect people's lives.

Children Who Primarily Attended Early Childcare Centers Before Kindergarten Start School Stronger in Math, Reading

Young children who attended day care, preschool and other types of center-based care in the year before kindergarten earned higher scores in math and reading and had stronger learning and cognitive flexibility skills than their peers who did not participate in such activities, according to a national report by Institute of Education Sciences (IES). The study revealed racial and ethnic disparities in early care arrangements. The percentages of first-time kindergartners who received center-based care as their primary early care and education arrangement the year before kindergarten were lower for Hispanics (48%) and Pacific Islanders (28%) than for whites (58%), blacks (56%), Asians (62%), American Indians/Alaska Natives (57%) and kindergartners of two or more races (61%).cover

About 36 percent of kindergartners from households where a primary language other than English was spoken had no regular early care and education arrangement in the year before kindergarten, compared with 18 percent of kindergartners whose primary home language was English. The data of the study, released this year, is from the fall of 2010.

The 60-page report, produced by the American Institutes for Research (AIR) for the U.S. Department of Education’s National Center for Education Statistics (NCES), drew from a nationally representative sample of U.S. kindergartners as they entered school.

Connecticut's Office of Early Childhood, established in 2014, notes that "Study after study confirms the value of high-quality early childhood education for developing the cognitive, social and emotional skills that children need to succeed in kindergarten."

Major findings from the study, which examined children’s performance as they entered kindergarten in fall 2010, include the following:

childrenReading: children who had no regular early care and education arrangements the year before kindergarten and those whose primary arrangements were home-based relative care or non-relative care tended to score lower than children who were primarily in center-based care or who spent the same amount of time in multiple care arrangements.

Math: children who had no regular early care and education arrangements the year before kindergarten tended to score lower than children who attended any type of arrangement outside of parental care. Children who were primarily in home-based relative care scored lower than children who were primarily in home-based non-relative care, center-based care or multiple care arrangements for equal amounts of time.

Cognitive flexibility scores were lower, on average, for children who had no regular early care and education arrangements the year before kindergarten and for those whose primary arrangements were home-based relative care than for children who primarily attended center-based care. (These scores measure a child’s ability to adjust behavior or attention in response to changes in the environment.)

Approaches to learning—in which teachers rated students on attentiveness, task persistence, eagerness to learn, learning independence, flexibility, organization and ability to follow classroom rules—tended to be lower for children who had no regular early care and education arrangements the year before kindergarten than for those who were primarily in home-based non-relative care, center-based care or multiple care arrangements for the same amount of time.

The report examined five categories of primary early care and education arrangements for children:

  1. center-based care, including day care centers, Head Start programs, preschool, prekindergarten and other early childhood programs;
  2. home-based relative care;
  3. home-based non-relative care;
  4. multiple arrangements for equal amounts of time;
  5. no regular early care arrangement (i.e., mainly parental care only)

It found that the percentage of children who attended center-based care as their primary arrangement before kindergarten has increased only slightly over nearly two decades, from 55 percent in 1995 to 58 percent in 2012.

The American Institutes for Research (AIR) is a nonpartisan, not-for-profit organization that conducts behavioral and social science research and delivers technical assistance both domestically and internationally in the areas of health, education and workforce productivity.


https://youtu.be/bs_Svx6JPro

CT Has Nation's 10th Lowest Rate of Cigarette Smoking

West Virginia had the highest prevalence of cigarette use in the United States, according to a new CDC study.  Utah had the lowest, and Connecticut had the 10th lowest rate. Using data from the 2014 Behavioral Risk Factor Surveillance System, CDC determined that the prevalence of cigarette use in West Virginia was 26.7%, while the lowest rate was 9.7% in Utah.  In Connecticut the rate of cigarette use was 15.4 percent.map

CDC recommended that continued implementation of proven population-based interventions, such as increasing tobacco product prices and enforcing comprehensive smoke-free laws, and increasing access to evidence-based clinical interventions can help reduce tobacco use.

"These findings highlight the importance of enhanced implementation of evidence-based strategies to help smokers and other tobacco users quit completely," CDC said.

Cigarette smoking was significantly higher among males than females in 34 states. Among males, cigarette smoking ranged from 11.2% (Utah) to 27.8% (West Virginia), and among females, from 8.2% (Utah) to 25.6% (West Virginia).

The report also indicated that the prevalence of smokeless tobacco use ranged from 1.4% (Hawaii) to 8.8% (Wyoming). It was 1.8 percent in Connecticut.

rates
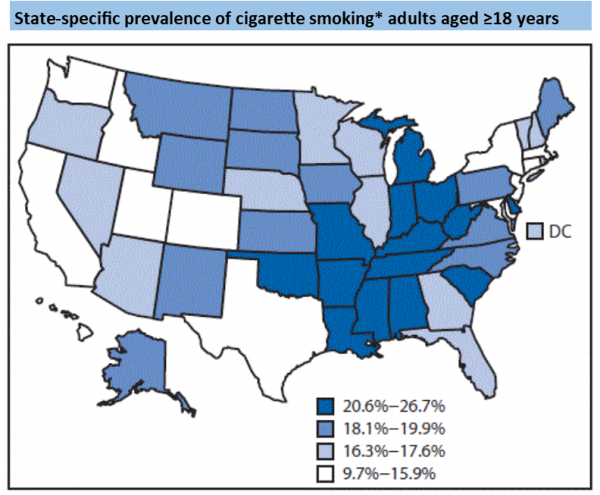
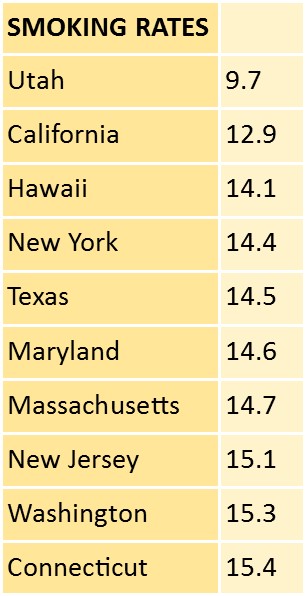
Prevalence of any cigarette and/or smokeless tobacco use ranged from 11.3% (Utah) to 32.2% (West Virginia).  Connecticut was 15.3 percent.

The CDC also indicated that the prevalence of any cigarette and/or smokeless tobacco use differed significantly by race/ethnicity in 21 states. Prevalence was highest among whites in eight states (Arizona, Delaware, Georgia, Maryland, New York, North Carolina, Texas, and Virginia), followed by adults of non-Hispanic other races in six states (Arkansas, Florida, Kansas, Nebraska, Oklahoma, and South Carolina), blacks in five states (California, Illinois, Indiana, New Jersey, and Wisconsin), and Hispanics in two states (Connecticut and Michigan).

The report was issued last week from the CDC.  The report concluded that “continued implementation of proven population-based interventions, including increasing tobacco product prices, implementing and enforcing comprehensive smoke-free laws, warning about the dangers of tobacco use through mass media campaigns, and increasing access to evidence-based clinical interventions (including behavioral counseling and FDA-approved medication), can help reduce tobacco use, particularly in populations with the highest use prevalence.”

smoke-that-cigarette


Obesity Rate Climbs in Connecticut, Is Among the Nation's Lowest

Connecticut now has the 10th lowest adult obesity rate in the nation, according to The State of Obesity: Better Policies for a Healthier America. Connecticut's adult obesity rate is currently 25.3 percent, up from 16.0 percent in 2000 and from 10.4 percent in 1990.42

reportAccording to the most recent data, adult obesity rates now exceed 35 percent in four states, 30 percent in 25 states and are above 20 percent in all states. Louisiana has the highest adult obesity rate at 36.2 percent and Colorado has the lowest at 20.2 percent.

U.S. adult obesity rates decreased in four states (Minnesota, Montana, New York and Ohio), increased in two (Kansas and Kentucky) and remained stable in the rest, between 2014 and 2015. This marks the first time in the past decade that any states have experienced decreases — aside from a decline in Washington, D.C. in 2010.

The data, released in September 2016 by the Trust for America’s Health and the Robert Wood Johnson Foundation, reflects information compiled nationwide in 2015.

Connecticut’s childhood obesity rates are 15.8 percent for 2-to-4 year olds from low-income families, 15 percent of 10-17 year olds, and 12.3 percent of high school students.

Regarding obesity-related health issues, Connecticut ranked 31st among the states in the current adult diabetes rate, which is 9.3 percent, and 30th in hypertension at 30.4 percent of the population. rate

In 1985, no state had an adult obesity rate higher than 15 percent; in 1991, no state was over 20 percent; in 2000, no state was over 25 percent; and, in 2006, only Mississippi and West Virginia were above 31 percent.  Nationwide, obesity rates are higher among women (40.4 percent) compared to men (35.0 percent).


CT Families Continue to Struggle Financially, United Way Report Reveals

More Connecticut households are struggling to pay for their most basic needs, according to a new report from United Way.  More than one out of four households - in one of the wealthiest states in the U.S. - are employed, yet still fall below what is needed to thrive financially.  That is an increase in both the number and percentage of such households in 2014 as compared with 2012, according to the updated ALICE report. Two years ago, United Ways introduced ALICE, which stands for - Asset Limited Income Constrained Employed - to place a spotlight on a large population of residents who are working, but have difficulty affording the basic necessities of housing, food, child care, health care and transportation.pie

In those two years, the problem has grown worse, even has the recession has given way to a slow economic recovery, in Connecticut and nationwide.  ALICE and poverty households combined account for 38 percent of households in the state that struggle to make ends meet.

A total of 361,521 Connecticut households fall into what the study describes as the ALICE population. These are households earning more than the official U.S. poverty level, but less than the basic cost of living. This is more than 2.5 times the number of households that fall below the federal poverty level. ALICE households make up 20% or more of all households in 114 (67%) of Connecticut’s 169 cities and towns.

The highest levels (ALICE and poverty households) were in Hartford (74%), New Haven (65%), Waterbury (63%), Bridgeport (63%) and New Britain (63%).  Also above 50 percent are Meriden, West Haven, East Hartford and New London.  From 2007 to 2014, two cities, Danbury and Waterbury, saw their total household population decrease, by 7 and 9 percent respectively, while the rest experienced an increase in households, with the largest increase of 8 percent in Stamford, according to the report. The number of household below the ALICE Threshold increased in every one of the nine largest cities and towns with Norwalk seeing the largest percent increase (38 percent).

2016-alice-report-update-coverWhile the prevalence of low-wage jobs still defines Connecticut’s economy for ALICE, for the first time in the past decade, the percent of jobs paying less than $20 per hour fell below 50 percent of all jobs.  The report also highlights a number of trends in Connecticut, including:

  • The population is aging, and many seniors do not have the resources they need to support themselves.
  • Differences by race and ethnicity persist and ethnicity persist, creating challenges for many ALICE families, as well as for immigrants in Connecticut.
  • Low-wage jobs are projected to grow faster than higher-wage jobs over the next decade.
  • Technology is changing the workplace, adding some jobs, replacing many others, while also changing where people work, the hours they work, and skills required. The report notes that technology creates opportunities as well as challenges for ALICE workers.

For the first time, an online simulator is also available to experience the financial challenges that ALICE households in Connecticut face at www.MakingToughChoices.org.  The updated Report uses data from a variety of sources, including the U.S. Census and the American Community Survey to provide tools that quantify the number of households in Connecticut's workforce that are struggling financially. The updated United Way ALICE Report reveals:

  • The composition of the ALICE population is men and women, young and old, of all races.
  • The breakdown of jobs in Connecticut by hourly wage (51% of jobs pay more than $20/hour) compared to what it costs to survive for a family of four (2 adults, 1 infant, 1 preschooler) - $70,788.
  • Every city and town in Connecticut has ALICE households. More than two-thirds of Connecticut's cities and towns have at least 1 in 5 households that fit the ALICE definition for financial hardship.cropped-alicemicrositelogo2

Poverty and ALICE households exist in every racial and ethnic group in Connecticut, but the largest numbers are among White non-Hispanic households. There were about one million White households in 2014, compared to 328,000 households of color (Figure 4 shows the populations of color for whom there is income data: Hispanic, Black and Asian). However, these groups made up a proportionally larger share of households both in poverty and ALICE: 64 percent of Hispanic households, 58 percent of Black households, and 30 percent of Asian households had income below the ALICE Threshold in 2014, compared to 31 percent of White households.

The largest population of color in Connecticut, Hispanics, has been growing since 2007, totaling 156,837 households in 2014, a 25 percent increase. As the number of Hispanic households increased, so did the number and proportion of Hispanics living below the ALICE threshold. The percentage of Hispanic ALICE households rose from 34 percent in 2007 to 39 percent in 2010 and then to 43 percent in 2014. Together Hispanic households in poverty and ALICE made up more than two-thirds of Hispanic households in 2014.

making-tough-choicesThere are some signs of improvement in the education gap among racial and ethnic groups, suggesting that some structural changes are occurring in Connecticut. In K-12 education, the Education Equality Index (EEI) shows that the achievement gap – the disparity in educational measures between socioeconomic and racial or ethnic groups – narrowed slightly between 2011 and 2014 in Connecticut.

Achievement gaps impact graduation rates and college performance. Among the Class of 2013, 64 percent of Black students and 59 percent of Hispanic students in the state went on to college within a year after graduating from high school, compared to 78 percent of White students. They also had lower 6-year college graduation rates: While 54 percent of White students got a college degree within 6 years, only 24 percent of Black students and 21 percent of Hispanic students did the same (Connecticut State Department of Education, 2015).

The updated ALICE Report recommends both short-term and long-term strategies to help ALICE families and strengthen our communities. United Ways work with many community partners to provide support to ALICE families to help them get through a crisis and avoid a downward spiral into even worse circumstances such as homelessness as well as assisting with financial literacy, education and workforce readiness.

Further, United Ways in Connecticut have invested more than $8.5 million in child care and early learning; $1.3 million in housing and homeless prevention work; $5 million in basic needs programs; and, have assisted working families in obtaining nearly $40 million in EITC and tax refunds and credits in 2016.

The updated Connecticut ALICE Report was funded by the 16 Connecticut United Ways. For more information or to find data about ALICE in local communities, visit http://alice.ctunitedway.org.  Connecticut United Ways are joining with United Ways in fifteen other states to provide statewide ALICE Reports. The updated Connecticut ALICE Report provides analysis of how many households are struggling in every town, and what it costs to pay for basic necessities in different parts of the state (Household Survival Budget).

https://youtu.be/u7gPJGu2psw

 [2014 ALICE introductory video]

Heart Disease, Cancer Leading Causes of Death in CT; Septicemia Deaths Among Highest in USA

Heart disease, cancer and accidents were the leading causes of death in Connecticut according to data released by the National Center for Health Statistics of the Centers for Disease Control and Prevention.  The other major causes of death in Connecticut include chronic lower respiratory diseases, stroke, alzheimer’s disease, diabetes, influenza/pneumonia, kidney disease and septicemia. In all but two instances, Connecticut ranked in the lowest quintile among the states, ranking 40th in the rate of heart disease deaths, 43rd in cancer deaths, 48th in dCDC_logo2eaths due to diabetes, and 48th in deaths caused by stroke.  The state ranked 15th, however, in deaths caused by septicemia and 35th in accidental deaths.

Septicemia, or sepsis, is a life-threatening complication of an infection in the bloodstream. Sepsis is the body’s overwhelming response to infection which can lead to tissue damage, organ failure, and death. It kills 258,000 Americans each year, according to the Sepsis Alliance, but remains largely unknown. Although it is among the 10 most frequent causes of death nationwide, in a 2015 online survey of 2,000 participants, only 47 percent of Americans were aware of sepsis, the Alliance reported. The deaths this year of actress Patty Duke and boxing legend Muhammad Ali have brought some increased attention to sepsis.causes

Connecticut had 578 recorded deaths caused by septicemia, a rate of 12.6 per 100,000 total population, in 2014, according to the CDC data.  The United States rate was 10.7.  The highest death rates from septicemia were in Mississippi, Louisiana, Alabama, Texas, New Jersey, Kentucky, Arkansas, Maryland, Georgia, and Virginia.

There were 7,018 deaths from heart disease and 6,621 from cancer in Connecticut in 2014, according to the data.  The next most frequent cause of death, accidents, totaled 1,642, followed by chronic lower respiratory diseases, which caused, 1,368 deaths, and stroke, which caused 1,266.

Connecticut’s rate of deaths per thousand population by stroke, 26.3, is among the nation’s lowest.  The national rate is 36.5.  The only states with lower rates of stroke deaths are Rhode Island and New York.  Connecticut is tied with Arizona, just ahead of Massachusetts, New Hampshire and Wyoming.  The highest rate of deaths from stroke are in Mississippi, Alabama, Tennessee, Louisiana and Arkansas.

Heart disease has long been the leading cause of death for all U.S. states, with cancer as the second leading cause, according to the CDC. In 1990, Alaska became the first state to experience a switch in ranks between these two causes. In 2000, Minnesota experienced the same switch. As of 2014, there are now 22 states with cancer as the leading cause of death.  Heart disease remains the leading cause in Connecticut.

In 2013, the leading causes of death in Connecticut were heart disease (7.090), cancer (6,619), chronic lower respiratory diseases, accidents, stroke, alzheimer's disease, diabetes, influenze/pneumonia, kidney disease and suicide.

cdc-map

Connecticut Public Accounting Firms Reach National Rankings

The largest Connecticut-based public accounting firm, BlumShapiro, earned the #54 position in the nation’s top 100, according to the publication Inside Public Accounting.  It is one of a handful of Connecticut firms to make the annual top 300 list, in addition to regional firms with offices in Connecticut. BlumShapiro is the largest regional business advisory firm based in New England providing accounting, tax and business consulting services. The firm serves clients from six offices offices in Connecticut (West Hartford and Shelton), Massachusetts and Rhode Island. BlumShapiro ranked #53 last year. 2016_ipa-300_web-147x150

Noted among the nation’s top 200 public accounting firms is Hartford headquartered Whittlesey & Hadley.  The firm, ranked at #155 this year, up from #178 a year ago, and #192 in 2014, has two additional offices, located in Hamden, CT and Holyoke, MA. The firm provides a comprehensive array of accounting, auditing, tax, and advisory services to a broad range of businesses and individuals.

Ranked #285 is Reynolds & Rowella LLP, which maintains offices in Ridgefield and New Canaan.  “We are proud to be counted among the top-ranked accounting firms nationwide on a list that includes Deloitte, PwC, Ernst & Young and KPMG,” Frank Rowella, Reynolds & Rowella’s managing partner, told the Fairfield County Business Journal. “The IPA list is known as one of the most thorough and accurate sets of rankings in the accounting profession. Our inclusion reflects our determination to provide the very best quality compliance and financial services solutions to our valued clients.”

blum At #296 is Glastonbury-based Fiondella Milone & LaSaracina.  FML was founded in 2002 “for the purpose of providing professional auditing, tax and business consulting services to a wide range of clients and industries throughout the Northeast,” the company’s website indicates.  After working together at Ernst & Young, the firm’s founding partners, Jeff Fiondella, Frank Milone and Lisa LaSaracina launched FML.

Inside Public Accounting (IPA), founded in 1987, is published by The Platt Group. The Platt Group publishes both the award-winning Inside Public Acwhcounting newsletter and the award-winning National Benchmarking Report.

Beginning in 1994, INSIDE Public Accounting’s Survey and Analysis of Firms and the resulting national benchmarking report on the nation’s largest accounting firms has served as a barometer of the overall health, challenges and opportunities of the profession, according to the publication.

Annually more than 500 accounting firms across the North America complete the in-depth financial and operational survey. The data is then used to compile the annual ranking of the nation’s largest accounting firms, which is unveiled in August of each year. The annual IPA rankings are considered to be among the longest-running, most accurate and up-to-date for the nation’s largest accounting firms.

Leading the list nationally were Deloitte, PricewaterhouseCopers, Ernst & Young, KPMG, RSM, and Grant Thornton.  Ranked at #11 is New York based CohnReznick, which has offices in Hartford.  Marcum LLP ranked #16, Citrin Cooperman & Company, also based in New York and ranked #21, has offices in Fairfield County.

Opioid Epidemic Leads Conference Marking 100 Years of Public Health in CT

Tackling the opioid epidemic at the federal, state, and local levels will be the focus of the featured panel when the Connecticut Public Health Association (CPHA) celebrates 100 years of public health in Connecticut at the 2016 CPHA annual conference in November. photoIn addition to the expert panel on opioid abuse, there will be more than 30 presenters on public health topics, a presentation on the history of CPHA and public health in thelogo state, and a look forward to the future and innovations on the horizon in health research, policy, and community programs.

“Today, more than ever, the value of public health in saving lives and reducing health care costs is at the forefront of public policy,” the organization’s website points out.  Members represent a wide variety of disciplines, and “are united in the goal of protecting and promoting the public's health.”

Keynote speaker will be Camara P. Jones, MD, MPH, PhD, President of the American Public Health Association (APHA).  Dr. Jones is a research director on social determinants of health and equity in the Division of Adult and Community Health, National Center for Chronic Disease Prevention and Health Promotion and President of the American Public Health Association (APHA).

cpha-logo_2She seeks to broaden the national health debate to include not only universal access to high quality health care but also attention to the social determinants of health (including poverty) and the social determinants of equity (including racism). As a methodologist, she has developed new ways for comparing full distributions of data (rather than means or proportions) in order to investigate population-level risk factors and propose population-level interventions.

Opioid abuse has hit record levels in the United States, with drug overdose deaths quadrupling over the last 15 years, the CPHA points out. According to the Centers for Disease Control, Connecticut is experiencing a death rate for drug and opioid overdoses that surpasses the national rate and has reached epidemic proportions.

The conference is being held at Anthony’s Ocean View in New Haven on November 10.  The theme is “Back to the Future – 100 Years of Public Health in Connecticut and Beyond.” The annual meeting is the oldest and largest gathering of public health professionals in Connecticut, attracting hundreds of attendees each year.

Financial Capital Remains Hurdle for Women Entrepreneurs

“Data reveal that an increasing number of women are choosing entrepreneurship as a career path, and of those, a growing number of them share aspirations for growth.”  That fact, pointed out in the preface of a new book co-written by a local university professor, is the proverbial tip of the iceberg. According to the U.S. Census Bureau, there are roughly 9.9 million women-owned firms in the United States, representing over a third of all firms in the country—and the ranks of new enterprises with women at the helm are growing rapidly. Between 2007 and 2012, women-owned firms in the U.S. grew by 27 percent compared to a growth rate of 2 percent for firms overall.

“But in spite of their impressive growth in numbers,” writes University of Hartford finance professor Susan Coleman, “the business ventures women are launching today continue to lag behind those launched by men in terms of revenues and employment. So while an increasing number of women can count themselves as entrepreneurs, many appear to be running into barriers, as the vast majority of their businesses remain quite small.”6a00d8342f027653ef01b8d205bcbd970c-800wi

Coleman, along with Alicia M. Robb, have co-authored The Next Wavcoleman_8_13e: Financing Women’s Growth-Oriented Firms (published by Stanford University Press), which points to “three essential factors that women entrepreneurs need to thrive: knowledge, networks, and investors. In tandem, these three ingredients connect and empower emerging entrepreneurs with those who have succeeded in growing their firms while also realizing the financial and economic returns that come with doing so.”

Robb is Senior Fellow with the Ewing Marion Kauffman Foundation and Visiting Scholar at the University of California, Berkeley and the University of Colorado, Boulder. She previously worked with the Office of Economic Research in the Small Business Administration and the Federal Reserve Board of Governors. Coleman is Professor of Finance and Ansley Chair at the Barney School of Business at the University of Hartford.

Coleman notes that “A crucial pitfall is that women face unique challenges in their attempts to acquire financial capital. Growth-oriented firms typically require substantial investment—both in the form of bank loans and external equity in the form of angel or venture capital funding—to scale up.” Studies reveal, however, that “women entrepreneurs raise significantly smaller amounts of capital than men and face continued barriers in their attempts to secure external equity in particular,” Coleman points out.

In the book’s forward, the authors explain that the motives behind women-run entrepreneurial businesses vary.  “Some of these growth-oriented entrepreneurs are motivated by a desire to pursue an opportunity or an unmet need in the marketplace.  Others are frustrated by the constraints imposed by a ‘glass ceiling’ that prevents them from reaching the most senior ranks of corporations.  Still others are drawn by the financial and economic rewards that can come from leading a firm that achieves scale.”

According to IRS data, women represent over 40 percent of top wealth holders in the United States, yet estimates from the University of New Hampshire’s Center for Venture Research indicate that they represented only 25 percent of angel investors in 2015, Coleman notes.

Optimistic about the future success of women entrepreneurs, Coleman and Robb observe that “Successful women entrepreneurs who are paying it forward in a variety of ways are a driving force” in what they describe as the “next wave.”

“In a virtuous cycle, women entrepreneurs evolve from being the recipients of human, social, and financial capital into becoming the providers of those key resources as their firms grow and create economic value. The more successful women at the helm of businesses that kick off cash, the more women there are to invest in others, and the faster we see the number of women grow in the ranks of larger businesses and investing.”

In addition to appreciation expressed to the Kansas City-based Kauffman Foundation for financial support, the book’s acknowledgements note that the Barney School of Business and the University of Hartford’s Women’s Education and Leadership Fund provided grants that helped support initial research and development of case studies on women entrepreneurs. The authors also expressed appreciation to three University of Hartford graduate assistants – Ece Karhan, Mert Karhan, and Isha Sen – who “played an invaluable role in the book’s development.”

UConn Study: Look-alike ‘Smart Snacks’ Confuse Students, Parents

Unhealthy snack food brands such as Cheetos, Fruit-by-the-Foot and Froot Loops have reformulated their products to meet new USDA Smart Snacks nutrition standards so they can be sold to kids in schools. But these products often come in packages that look similar to the unhealthy versions of the brands that are still sold in stores and advertised widely to youth. Selling these look-alike Smart Snacks in schools confuses students and parents, provides companies a way to market their brands to kids in schools, and may hurt schools’ credibility, according to a new study by the Rudd Center for Food Policy and Obesity at the University of Connecticut, published in the journal Childhood Obesity and reported by UConn Today.Exhibit_Revised-July (1)

It is the first to examine how selling look-alike Smart Snacks in schools affects attitudes about the brands and perceptions of schools selling these products.

“Kids think the healthier Smart Snacks they can buy in school are the same products that are sold in stores,” says Jennifer Harris, lead author of the study and director of marketing initiatives for the UConn Rudd Center. “It’s confusing because the packaging for these look-alike Smart Snacks looks so much like the less nutritious versions that kids see advertised on TV and in the stores.

“This is a great marketing tool,” she adds. “The snack makers get to sell their products in schools and at the same time market their unhealthy brands to kids every school day.”

The study involved an online experiment with 659 students 13 to 17 years old, and 859 parents of children 10 to 13 years old.  The participants viewed information about a hypothetical school that sold either look-alike Smart Snacks, regular versions of the same brands sold in stores, Smart Snacks in redesigned packages, or only brands whose regular products met Smart Snacks standards.

Specific findings of the study include:

  • Students and parents rated the healthier look-alike Smart Snacks similarly in taste, healthfulness, and purchase intent as the store versions, while considering Smart Snacks in different packages to be healthier but less tasty.
  • Most participants inaccurately believed they had seen look-alike Smart Snacks for sale in stores.
  • Participants also rated schools offering the look-alike Smart Snacks and the store versions of the brands as less concerned about students’ health and well-being.

RUdd
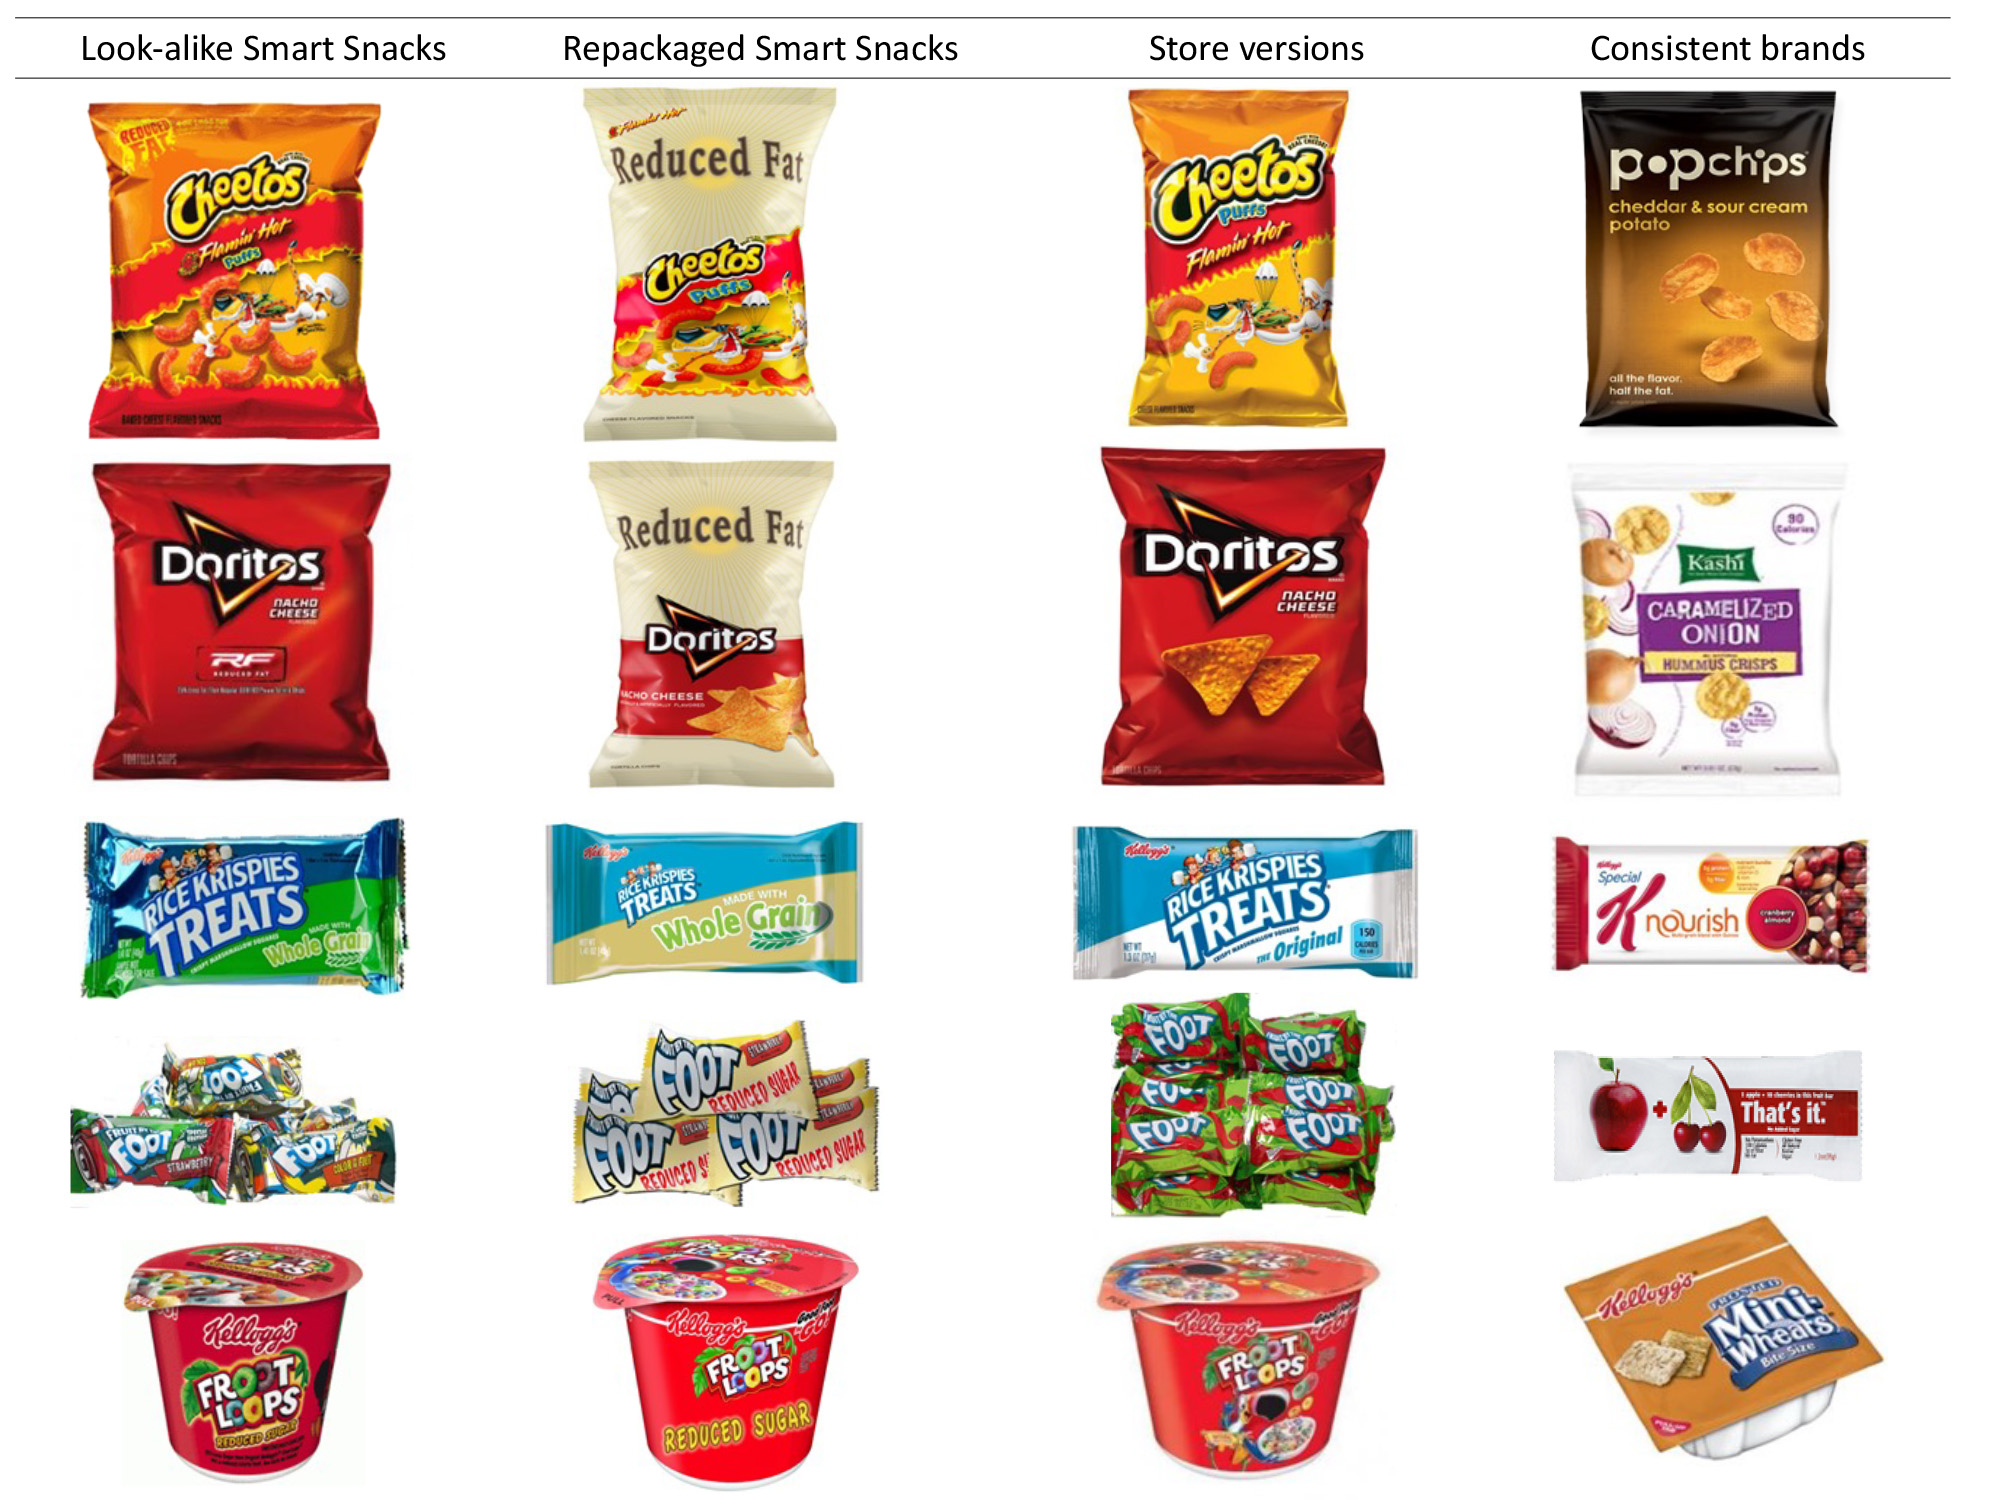
“The practice of selling look-alike Smart Snacks in schools likely benefits the brands,” says Harris, “but may not improve children’s overall diet, and undermines schools’ ability to teach and model good nutrition.”

The Rudd Center for Food Policy & Obesity relocated to UConn in 2015 after 10 years at Yale.  The Center is a distinguished multi-disciplinary policy research center dedicated to promoting solutions to childhood obesity, poor diet, and weight bias through research and policy. The Rudd Center is a leader in building broad-based consensus to change diet and activity patterns by conducting research and educating policy makers and the public.

The research was funded by a grant from the Michael & Susan Dell Foundation.