Immigration Is Key to Connecticut's Economic Strength, Report Shows
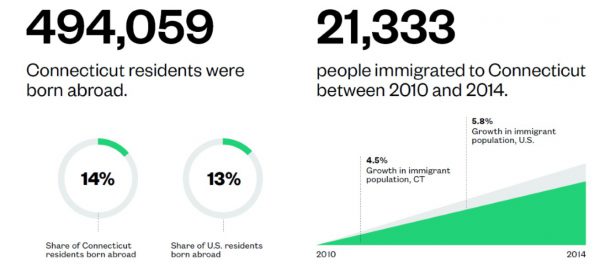
By 2014, Connecticut was home to almost half a million people who were born abroad.  In Connecticut, like the country as a whole, immigrants are currently punching far above their weight class as entrepreneurs, according to a report issued last year highlighting the impact of immigrants in the state. Foreign-born workers make up 21.3 percent of all entrepreneurs in the state, despite accounting for 13.7 percent of Connecticut’s population. Their firms generated $1.1 billion in business income in 2014, according to the report.

The report, “The Contributions of New Americans in Connecticut,” was prepared by the Partnership for a New American Economy, an organization that “brings together more than 500 Republican, Democratic and Independent mayors and business leaders who support sensible immigration reforms that will help create jobs for Americans.”

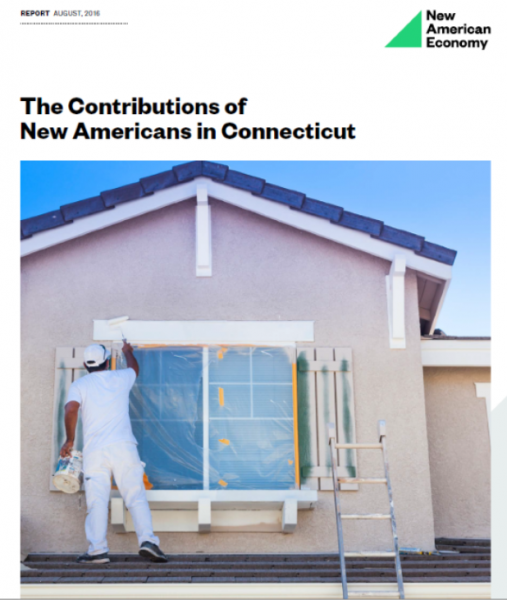
Immigrants are nothing new in Connecticut.  Even the Land of Steady Habits keeps changing.  In 1990, the state was already home to more than 279,000 immigrants, a group that made up 8.5 percent of Connecticut’s population overall. By 2010, the number of immigrants in this small state had grown to almost 473,000 people. By 2014, Connecticut was home to almost half a million people who were born abroad.

The report research also found:

  • Of the 18 Fortune 500 firms based in the state, 50 percent have at least one founder who was an immigrant or the child of an immigrant. For the country as a whole, the equivalent figure is 41.4 percent.
  • In Connecticut immigrants held $13.8 billion in spending power in 2014, defined in this brief as the net income available to a family after paying federal, state, and local taxes.
  • In Connecticut 69.8 percent of the foreign-born population is working aged, defined in the report as between the ages 25 and 64, while only 50.8 percent of the native-born population is. That 19 percentage point gap has major implications for the state’s workforce.
  • Foreign-born residents makeup more than one in three employees in the state’s computer systems design and related services industry. They also account for 32.2 percent of the state’s workers in medical equipment and supplies, contributing to Connecticut’s sizeable medical devices and supplies manufacturing industry, which generated more than $2.1 billion in sales in 2012.
  • Despite making up 13.7 percent of the state’s population, foreign-born Connecticut residents made up 23.8 percent of STEM workers in the state in 2014.

Research for the report also found that in 2016 nearly one in three physicians in Connecticut graduated from a foreign medical school, “a likely sign they were born elsewhere.”  Only six other U.S. states had a higher share of foreign-educated physicians. Immigrant healthcare practitioners also made up 15.3 percent of the state’s nurses in 2014, as well as 29.5 percent of those working as nursing, psychiatric, or home health aides. Both those figures were higher than the national average.

Flexer Sees Bad Choices Ahead if State Doesn't "Do Something Dramatically Different"

“Connecticut’s got to do something dramatically different,” implored State Sen. Mae Flexer.  Her impassioned comments came as part of a panel discussion at the unveiling of the 2017 Kids Count Policy Report at the State Capitol.  With budget negotiations proceeding in earnest amidst a worsening state fiscal situation, Flexer expressed her concern about the forces driving the conversation at the Capitol, and the long-term implications for residents in the state’s rural and urban communities. “As I think about the days and the weeks ahead, I’m frustrated, because frankly, this building as far as I can tell right now, is being ruled by the voices of the people of the wealthy and suburban communities, and not by the voices of people (in these districts),” she said, following concerns raised by colleagues Rep. Brandon McGee (Hartford, Windsor) and Rep. Susan Johnson (Windham), who had focused on the significant disparities outlined in the report, and the adverse impact on children and families in Connecticut.   

“We’re not winning the battle,” said Flexer, who represents Killingly, Brooklyn, Canterbury, Mansfield, Putnam, Scotland, Thompson and Windham.  “And as I sit here and think about what this data should be leading us to do, and the reality of the choices that we are going to be making in the next couple weeks, we’re going to be making bad choices,” Flexer continued.

The 37-page report, “Race Equity in the Five Connecticuts: A Kids Count Special Report“ provided detailed analysis on the disparities in the state’s differing communities, described based on demographic data as being in one of five categories:  wealth, suburban, rural, urban periphery or urban core.   The report was published by the Connecticut Association for Human Services.

The stark differences, according to Chief Executive Officer Jim Horan, “are reflected not only in disparities in economic well-being, but in education, health, and family and community indicators.” The report found “there are persistent inequities in outcomes along racial and ethnic lines. Poverty rates differ starkly by race and ethnicity, as do other economic indicators, academic achievement (including graduation rates), and health outcomes.”

“We need to do things differently,” Flexer told those attending the May 15 panel discussion, one of two held back-to-back as part of the release of the report  that began with a detailed presentation of the report’s findings.  “The workforce training program (that you’re talking about) – it’s not going to exist in four or five years on the path that we’re taking right now in Connecticut of thinking that we have to do things the same way but not bringing anymore resources into the picture and not thinking of creative ways to allocate those resources is just going to make these statistics worse.  It’s going to make the outcomes for the communities that the three of us represent, worse.  It’s going to drive up rates of poverty, it’s going to make a study like this when it’s done again in five years even more stark of a contrast between the different regions.”

Noting that the towns of Chaplin, Hampton, Windham, Scotland, and Mansfield were one town early in the state’s history, Flexer asked “how much money would that save if that were still the case?  Is looking at our past the solution to what we need to do in the future, in a system with limited resources?”

Reflecting on the budget choices being discussed at the Capitol to reign in the multi-billion dollar deficit, Flexer expressed apprehension at some of the options under consideration.

“There are people who think that the Office of Early Childhood should no longer exist, that your commission [Commission on Children, Women and Seniors] should no longer exist, as a solution to Connecticut’s budget situation.  That throwing more families off of HUSKY insurance coverage is the answer to the problem we’re in the State of Connecticut,” Flexer said.

Flexer’s frustration and apprehension, however, was tinged with optimism.

“I’m so grateful to have this report and to have this conversation. I’m hopeful that people will look at what you’ve put together here and understand that we’ve got to do things differently and we can’t fail folks in … these communities.”


CT-N coverage

Five Connecticuts: Disparities Persist, Continue to Adversely Impact State's Children

Connecticut is among the wealthiest states in the country, and aggregated statewide economic, health, and education indicators suggest that children and families fare better here than in much of the United States. According to a new report developed by the Connecticut Association of Human Services, the reality on the ground is not what it appears to be. “Race Equity in the Five Connecticuts:  A Kids Count Special Report,” found that Blacks’ and Hispanics’ poverty rates are lower in Connecticut than nationally, and Blacks’ median incomes are higher. However, “as we have seen when looking within communities, historic patterns of inequality observed nationally do indeed persist here.”

The report indicates that as is the case nationally, Blacks and Hispanics in Connecticut are “disproportionately impoverished, and have the highest rates of negative outcomes for most of our indicators. Merely being a resident of one of the most affluent states in the U.S. is not a sufficient buffer against the intransigent inequality that affects our children and families along racial and ethnic lines,” the report explains.

"Not all children in our wealthy state are doing well," summed up Jim Horan, Chief Executive Officer of the Connecticut Association of Human Services, in releasing the report at a State Capitol complex conference. "All children, regardless of the color of their skin or their zip code, should have the opportunity to succeed. Connecticut can do much more to provide opportunity for all and address the huge inequities we see today, so that all children will prosper and contribute to and share in Connecticut’s growth," he said in the report's Foreword.

“Five Connecticut’s” refers to a breakdown developed by the Connecticut Data Center based upon each town’s median income, population density, and population below 100% of the poverty threshold (Levy, et al, 2004).

  • Wealthy Connecticut towns have “exceptionally high-income, low poverty, and moderate population density.”
  • Suburban towns have “above average income, low poverty, and moderate population density.”
  • Rural towns are those with “average income, below average poverty, and the lowest population density.”
  • Urban Periphery towns are marked by “below average income, average poverty, and high population density.”
  • Urban Core towns have “the lowest income, highest poverty, and the highest population density.”

The report used data from communities representing each of the five Connecticuts:  Wealthy (New Canaan, W3ilton, Weston, Easton, Fairfield); Urban Periphery (East Hartford and Manchester); Urban core (Hartford); Suburban (Branford, East haven, North Branford, Guilford and Madison); and Rural (Ashford, Brooklyn, Canterbury, Chaplin, Eastford, Hampton, Killingly, Plainfield, Pomfret, Putnam, Scotland, Sterling, Thompson, Woodstock, and Windham).

“Blacks are more segregated in Connecticut than in Arkansas and Hispanics are more segregated than in Texas,” pointed out Orlando Rodriquez, research associate at the UConn Health Disparities Institute, speaking at a forum on the report at the Legislative Office Building, noting that Connecticut is among the nation’s most segregated states.

Demographically, Connecticut, like the nation, is becoming more racially and ethnically diverse. It is estimated that by 2055, America will not have a single racial or ethnic majority.  From 2000 to 2015, as the total population grew by 5%, Connecticut’s Black, Hispanic, Asian, and Native American populations combined grew by 42.3%. In 2000, Connecticut’s population was 22.5% Non-White; in 2015, it was 30.8%.

The research also found that “place can correlate somewhat with the degree of the differences observed across these indicators, with outcomes either ameliorated or exacerbated depending on one’s ‘Connecticut’ of residence.”

The general trend, the analysis indicated, “is that White and Asian children and families experience positive outcomes, while their Hispanic and Black counterparts are almost invariably worse off. Even in those areas where Hispanic and Black households have relatively higher median incomes, they often still have worse outcomes than White and Asian households for many non-economic indicators.”

“Place remains tightly intertwined with opportunity, compounding the effects we observe along racial lines,” the report indicated.

“While more affluent suburban towns offer safer neighborhoods and greater social and economic opportunity to residents,67 these neighborhoods and towns tend to have less affordable housing and perhaps less economic opportunity for employees of limited credentials. Finances tie less affluent families to areas of low opportunity, contributing to a cycle of poor outcomes.”

Officials said the report is intended to be the beginning of a “more nuanced and continuous conversation about the role of place in social and economic equity in the State of Connecticut,” to assist in the development of “policies that work earnestly to close the racial and ethnic gaps among our families and children.”

In 2000, Connecticut’s population totaled 3,405,565, with 2,638,845 non-Hispanic Whites, 309,843 Blacks, 320,323 Hispanics, 9,639 Native Americans, and 82,313 Asians. In 2015, the estimated total population was 3,593,222, with 2,478,119 non-Hispanic Whites, 346,206 non-Hispanic Blacks, 526,508 Hispanics, 8,908 Native Americans of any ethnicity, and 149,368 non-Hispanic Asians.

In New England, Most Believe At Least Half of High School Grads Not Ready for College, Career

New Englanders overwhelmingly believe that at least half of high school students across the region graduate unprepared for college and a career, and that student-centered learning environments are part of the solution to this readiness problem. That’s according to the results of a poll that reflects growing concerns that children are not fully equipped for life after high school.  It is seen by some as a tipping point in public opinion that positions student-centered learning—which tailors education to the interests and needs of each student—as an answer to providing young people with the skills and knowledge they need to succeed upon entering post-secondary education and the workforce.

That’s according to the Nellie Mae Education Foundation (Nellie Mae) which released the poll that was conducted by the Rennie Center for Education Research & Policy, which surveyed 2,400 individuals across the region from August 5-31, 2016.

“Although graduation rates are at an all-time high, New Englanders are well aware that a diploma alone is no longer sufficient to ensure success for our students after high school,” said Nick Donohue, president & CEO of the Nellie Mae Education Foundation.

Among Connecticut residents, 33% said most graduates are prepared for college and a career, 48% said about half of graduates are ready, and 18% believe that “few graduates” are prepared for college and career.  Connecticut and New Hampshire had the highest percentage indicating that “most graduates” are prepared, with one-third of respondents (33%) expressing that view.

“Too frequently students arrive at college requiring developmental or remedial classes to strengthen basic skills just to move on to college-level material, or they begin careers without the tools and skills necessary to help them early on in their professional lives. The situation is more severe for people in traditionally marginalized communities – places that we need to prosper so our society can advance. The good news is that student-centered approaches to learning represent a path forward in which all students can succeed.”

There were some differences among the states.  In Connecticut, 48 percent said “some changes are needed, but basically schools should be kept the same.”  Only 14 percent said “public schools work well as they are now,” while 30 percent said “major changes are needed” and 8 percent said “a complete overhaul is needed” (the smallest percentage among the New England states).

A significantly greater proportion in Rhode Island believe “a complete overhaul is needed” than in Connecticut, Massachusetts, New Hampshire and Vermont.   A significantly greater proportion in Maine believe “a complete overhaul is needed” than in Connecticut.

Nearly two-thirds of those surveyed in Connecticut (64%) called for “using technology to enhance the way students learn in the classroom” – the highest percentage among the six New England states.  A majority called for “more significant efforts to close achievement gaps” (59%), more effective teachers (62%) and changes to the ways schools are funded (57%).  The state legislature in Connecticut is currently considering changes in the school funding formula proposed by Gov. Malloy in the wake of a state court decision.

According to Nellie Mae, across New England, only 50 percent of high school students are graduating with the skills and knowledge necessary to succeed after high school. These poll results show that New Englanders not only agree this is unacceptable, but that 90 percent believe that student-centered learning environments are part of the solution toward ensuring high school graduates are college and career ready.

Nellie Mae defines student-centered learning as personalized and happening anywhere, anytime. In student-centered environments, students move ahead based on mastery of content rather than class-seat time and they exert ownership over their own learning.

New Englanders found teachers to be among the most trusted group when it comes to educational decision-making and showed confidence in their ability to improve public education. Respondents also reported having confidence in parents and school and district leaders for improving education.

The poll comes amidst efforts by Nellie Mae to reshape public education in New England to reach an aggressive benchmark of 80 percent college and career readiness among our high school graduates by 2030. The Foundation is investing $200 million in grantmaking efforts toward advancing student-centered learning in schools and districts across the region in order to achieve this goal.

The Nellie Mae Education Foundation is the largest philanthropic organization in New England that focuses exclusively on education.

To read the poll report in its entirety, please visit http://bit.ly/2k4Dvv5

Disconnected Youth: Fewer in Connecticut Than Nationally; Disparities Reduced But Continue

Fewer young people across the country are disconnected from school and work today than were before the Great Recession, according to new national data. The 2015 youth disconnection rate, 12.3 percent, is below the 2008 rate of 12.6 and well below the 2010 youth disconnection peak, 14.7 percent. All of Connecticut’s five Congressional Districts show lower rates of disconnected youth than the national average.

That’s a 16 percent drop over five years translates to roughly 900,000 fewer young people cut off from pathways that lead to independent, rewarding adulthoods, according to data compiled by the Social Science Research Council.

The report, “Promising Gains, Persistent Gaps,” compares the degree of youth disconnectedness in Congressional Districts across the country.

Disconnected youth are teenagers and young adults between the ages of 16 and 24 who are neither in school nor working. Being detached from both the educational system and the labor market during the pivotal years of emerging adulthood can be dispiriting and damaging to a young person, and the effects of youth disconnection have been shown to follow individuals for the rest of their lives, resulting in lower incomes, higher unemployment rates, and negative physical and mental health outcomes. The harms accrue not only to young people themselves, but reverberate across time and place, making youth disconnection a national concern that must be addressed by society at large.

Youth disconnection rates vary enormously by congressional district—from an impressively low rate of 4.4 percent in Wisconsin District 2, the mostly urban Madison area, to an alarmingly high rate of 23.1 percent—or nearly one in every four young people—in Kentucky District 5 in rural Appalachia.

Connecticut fares relatively well.  Northeastern and Midwestern congressional districts have lowest rates of youth disconnection, 11.1 percent on average.

Connecticut’s best ranked Congressional district is the 2nd, in Eastern Connecticut, with an 8.7 percent of youth ages 16-24 disconnected, ranking 60th among the nation’s 435 Congressional districts.  Next best if Connecticut’s 5th district, in Western Connecticut, ranked 116th with 9.9 percent disconnected youth.  The 3rd C.D. ranks 134th, at 10.1 percent; the 4th C.D ranks 104th with 10.3 percent; and the 1st C.D. ranks 167th at 10.9 percent.

On average, a gap of 7.4 percentage points separates the best and worst districts within a state. Connecticut’s gap is only 2.2 percentage points.

The greatest disparity is found in New York State; a worrisome 15.2 percentage points separate New York’s District 20 in the Albany area (7.1 percent) and District 15 in New York City’s South Bronx (22.3 percent).

The most equitable state in terms of youth disconnection is also found in the Northeast; a nearly negligible 0.1 point separates Maine’s District 1, which hugs the southern coast and includes the capital, Augusta (9.8 percent), and District 2, a more rural district that encompasses most of the state (9.7 percent).

The analysis found that nationally, young women are slightly less likely to be disconnected than young men. And there is “astonishing variation in disconnection rates by race and ethnicity.” The share of young people cut off from workforce and educational opportunities, the report found, ranges from only one in fourteen Asian American youth to more than one in four Native American youth. The Asian American youth disconnection rate is 7.2 percent; the white rate is 10.1 percent; the Latino rate is 14.3 percent; the black rate is 18.9 percent; and the Native American rate is 25.4 percent.

The report concludes that “at-risk youth need the kind of support from communities and institutions that other young people take for granted: safe places to live and food on the table; caring adults to help them navigate the often-bewildering transition from child to adult; opportunities to try new things, to fail, and to try again; and experiences that build not just hard and soft skills for the marketplace, but also self-knowledge, agency, and confidence.”

Home Ownership in CT: Not Best, But Not Worst

When it comes to home ownership, Connecticut is in the middle of the pack among the nation’s 50 states.  A new report ranks the state at number 30, in the lower echelons of the states.  And when the report, by financial website ValuePenguin, identified optimal factors when considering homeownership, Connecticut faired more poorly in some key factors. Connecticut ranked 48th in affordability, followed only by California (49) and Florida (50).  New Jersey and Massachusetts were just ahead of Connecticut.  The best states for affordability were South Dakota, Wyoming and Idaho.

Ten factors, organized into three key categories were used to measure and rank the states. The three key categories of focus were: Housing Market Strength, Residual Costs, and Living Factors.

Factors that weakened a state’s position included propensity for crime, weak housing markets, and heavy burdens of costs to maintain a home – for instance the likelihood of property damage caused by storms and other calamities. Attributes that strengthened a state’s position included homeownership affordability, low mortgage rates, and low risk of calamities.

The 10 worst states to be a homeowner, according to the report, are Louisiana, Mississippi, Tennessee, New Mexico, and Alabama.  The best states, according to the analysis, are Iowa, South Dakota, Wyoming, Nebraska, Maine and Minnesota.

In terms of livability, the top states in the nation are the New England states of New Hampshire, Maine, and Vermont.


Strong Defense: Where CT's Jobs Will Be

“As a convergence of technological advancements, changing military demand and shifting workforce demographics force a major period of transformation across the (defense) industry, Connecticut must adjust its approach to workforce development and retention, or risk losing its competitive edge to other regions.” That’s the conclusion of a 23-page policy brief issued by CT21 which analyzed the pitfalls and potential of the aerospace and defense industries - a “significant pillar of Connecticut’s economy” - and the state’s workforce, on the brink of what the report describes as “an inflection point” for the state.

“With a workforce that is aging into retirement faster than the current pipeline of workers can fill the gap, existing training programs are being strained to both produce higher numbers of qualified graduates and keep their programs current with the skills industry needs,” the report indicated.

To solve this multi-faceted challenge, CT21 calls on state officials to:

  • Expand existing training programs and launch new ones
  • Increase industry input into training program development
  • Expand the workforce applicant pool
  • Incentivize the retention of retiring industry expertise

“The full ecosystem around the defense industry in the state must come together to address these overlapping trends – and many of these collaborative initiatives are already producing significant results – but state government still has a unique role to play in bringing the right ideas to the table,” the report explains.

The report notes that the 2016 Aerospace and Defense Workforce Study conducted by Aviation Week and Space Technology found over a quarter of the nation’s A&D workforce is over the age of 55. To highlight the local impact, 35% of Electric Boat’s workforce is within ten years of retirement. Over 7,800 workers have 20 or more years of service, and nearly 950 have 40 or more.

By way of illustration, the report devoted attention to United Technologies’ Pratt and Whitney.

“Based on projections for deliveries of military and commercial engines, Pratt expects to double production by 2020 and again by 2027. As of last September, the company expected to hire nearly 8,000 new workers in Connecticut over the next decade, including 1,000 engineers and 1,000 manufacturers in the next year. Pratt operates a business model that also relies heavily on the supply chain, with 85% of its engine parts being manufactured elsewhere.”

The report calls on state government to take a range of actions, including:

  1. Expand existing training programs and launch new ones
  2. Increase industry input into training program development
  3. Expand the workforce applicant pool
  4. Incentivize the retention of retiring industry expertise
  5. Create additional professional growth opportunities
  6. Take steps to improve the quality of life – both real and perceived
  7. Expand existing training programs and launch new ones
  8. Increase industry input into training program development
  9. Expand the workforce applicant pool
  10. Incentivize the retention of retiring industry expertise

Among the challenges the report cites are increasing competition from other industries and variable quality of life across the state. To respond, CT21 urges that state to create additional professional growth opportunities and improve quality of life statewide. CT21 stresses that the state must “leverage the opportunity before us to truly put Connecticut on a path towards a prosperous future.”

The Connecticut Institute for the 21st Century provides continuing opportunities for its members and other organizations to understand and discuss economic activity in the state and obstacles to its success. For more information, visit www.CT21.org

CT Is a Top Ten State - In A Good Way

Awash in a sea of negativity amidst yet another state budget deficit and intensifying concern about the prospects of additional fees, taxes, and service reductions, state residents now have an opportunity to accentuate the positive, courtesy of the 2017 Connecticut Economic Review. Noting that Connecticut is “at the epicenter of the Northeast” and “at the forefront of innovation,” the publication highlights an array of statistics that produce a “dynamic blend of advantages that make Connecticut a great place to start or grow a business.”

Among the key stats:

  • Connecticut ranks #3 in the country for the percentage of employees with advanced degrees - more than 400,000 employees have advanced degrees. And Hartford was identified as one of the 19 global Knowledge Capitals by the Brookings Institution.
  • Connecticut ranks #4 among the top states for private R&D investment per capita, at $2,227. Massachusetts, Delaware and California are the only states that rank higher. That’s also more than twice the national average.
  • Connecticut ranks #5 among the states for productivity per person, and #6 on the State Technology and Science Index, which benchmarks states on their science and technology capabilities and broader commercialization ecosystems that contribute to company growth, high value-added job creation and overall economic growth.

The state’s growing bioscience industry is responsible for more than 35,000 bioscience employees in over 2,000 companies. Connecticut also ranks #6 for academic R&D growth and #7 for state R&D investment.  Overall, the state ranks 5th in patents per capita and has 39 percent more patents than the U.S. average. Two Connecticut companies, Alexion and priceline.com, have been named by Forbes as among the nation’s most innovative companies.

In his introduction to the economic report, Governor Dannel Malloy points out that “Connecticut has grown to become a global hub in bioscience, digital media and green technology. We enjoy a combination of a real entrepreneurial spirit, remarkable experience and one of the most educated and productive workforces in the world.”

The New Economy Index, which measures how states are positioned to drive economic evolution in today’s changing society, ranks Connecticut #8 in the U.S., indicating that the state “offers the kind of environment that is particularly conducive to growth for companies that are capitalizing on the latest global economic trends.  (The top seven are Massachusetts, Delaware, California, Washington, Maryland, Colorado and Virginia.)  The ranking is based on measures in five key areas:  Knowledge jobs, Globalization, Economic dynamism, digital economy, and innovation capacity.

Produced by the Connecticut Economic Resource Center, the publication was sponsored by Eversource.

World’s Most Ethical Business: Three Headquartered in CT

Three Connecticut-based companies are among the world’s most ethical businesses. Norwalk-based Xerox Corp, Danbury’s Praxair Inc., and The Hartford, located in the Capital City are on the 2017 list developed by Ethisphere Institute, a Scottsdale, Arizona organization that measures corporate ethical standards.  The annual list has been published since 2007.

The Ethisphere Institute announced 124 companies spanning five continents, 19 countries and 52 industry sectors as the 2017 World’s Most Ethical Companies® honorees.

Ethisphere honors companies that “recognize their role in society to influence and drive positive change in the business community and societies around the world,” a news release announced the list stated. “These companies also consider the impact of their actions on their employees, investors, customers and other key stakeholders and leverage values and a culture of integrity as the underpinnings to the decisions they make each day.”

Xerox is one of only 13 honorees that have been named to the list for all 11 years, underscoring the company’s commitment to leading ethical business standards and practices.  The Hartford earned a spot on the list for the ninth time.

“At Xerox, we take great pride in our name being synonymous with innovation, quality and integrity,” said Jeff Jacobson, chief executive officer of Xerox. “We are committed to doing business the right way, with the highest degree of ethics and in compliance with laws worldwide.”

Among the 2017 list of companies are 13 eleven-time honorees and 8 first-time honorees. 2017 also marks the first-time appearance of a Mexico-based company.

The methodology is weighted into five key categories: ethics and compliance program (35%), corporate citizenship and responsibility (20%), culture of ethics (20%), governance (15%) and leadership, innovation and reputation (10%).  Non-profit colleges and universities, governments, governmental agencies, and NGOs are not considered for inclusion on the list.

“At Praxair, ensuring a culture of ethics and compliance is paramount to doing business the right way and is top of mind for all of our global employees,” said Steve Angel, Praxair chairman and chief executive officer. “It is a great honor to be recognized as a World’s Most Ethical Company and I thank all of our employees for their dedication to our core values and making this accomplishment possible.”

“Over the last eleven years we have seen an impressive shift in societal expectations, aggressive emergence of new laws and regulation and geopolitical swings that can further disrupt the balance. We have also seen how companies honored as the World’s Most Ethical respond to these challenges. They invest in their local communities around the world, embrace strategies of diversity and inclusion and focus on long term-ism as a sustainable business advantage. In short, these companies are transformative, not just out of need, but because they recognize that integrity is the key to their advancement,” explained Ethisphere CEO, Timothy Erblich.

Xeorx is one of 13 companies have made the list every year, including: Aflac, Deere & Company, Ecolab, Fluor, GE, International Paper, Kao Corporation, Milliken and Company, PepsiCo, Starbucks, Texas Instruments, and UPS.

The World’s Most Ethical Company assessment is based upon the Ethisphere Institute’s Ethics Quotient® (EQ) framework which offers a quantitative way to assess a company’s performance in an objective, consistent and standardized way, according to the Institute. The information collected provides a comprehensive sampling of definitive criteria of core competencies, rather than all aspects of corporate governance, risk, sustainability, compliance and ethics.

Disparities Evident As Fairfield County Considers Its Community Wellbeing

Fairfield County’s sizeable immigrant population - twenty percent of Connecticut’s most populous county - grew 89 percent from 1990 to 2014. In some municipalities, foreign-born residents make up as much as a third of the population. That is among the findings in the Fairfield County Community Wellbeing Index 2016, which examined regional demographics, economic opportunity, education, health, quality of life, and happiness.  The report includes analysis of the communities, populations, and neighborhoods of Fairfield County, as well as opportunities available and issues facing the area.

Since 1980, the size of the population living in neighborhoods that are considered most affluent – defined as those with an average family income more than 2.5 times higher than the state level - has tripled within Fairfield County. Meanwhile, the number of people living in poor neighborhoods is 3.5 times its 1980 size. The number of people in middle-income neighborhoods has decreased by sixteen percent.

Fairfield County’s Community Foundation, a major funder of the report, partnered with DataHaven, area hospitals, and government agencies to help launch a more robust and comprehensive resource that could serve as a part of the hospitals’ and health departments’ Community Health Needs Assessments as well as a broader county-wide indicators program.

“Fairfield County’s Community Foundation is committed to addressing the most pressing issues facing Fairfield County, but to do that we first need to be able to identify and understand those issues,” stated Nancy M. von Euler, Vice President, Programs, Fairfield County’s Community Foundation. “The data in the Fairfield County Community Wellbeing Index 2016 will help us to develop priorities for collective action to build a stronger, healthier Fairfield County where everyone has the opportunity to thrive, regardless of their zip code.”

The report states that "Despite its overall affluence, Fairfield County is among the nation’s most unequal metropolitan areas. Inequities in well-being appear when evidence is stratified by income, age, race, gender, and zip code. These differences are often most apparent after considering data that were collected specifically for the age groups and neighborhoods that are most impacted."

Among the findings, between 2014 and 2025, adults ages 65 and over are Fairfield County’s only age group projected to grow significantly, with a thirty-seven percent increase. Disparities in the County were also evident:

  • High and rising childcare costs are often prohibitively expensive for low and middle-income families. While Fairfield County has nearly enough spaces for all 3- to 4-year-olds to attend preschool, there are only enough regulated childcare slots for fifteen percent of the county’s children ages 0 to 2, and enough subsidized slots to cover only twenty-two percent of these youngest children in low-income households.
  • The issue of dental care arose as an indicator of well-being, particularly among younger adults and families. The Index shows that for every 10,000 residents living in Fairfield County, 12 residents visit an emergency room to receive treatment for preventable dental conditions in any given year, whereas on the East Side of Bridgeport, 178 residents do.
  • Fairfield County residents are healthy when compared to national benchmarks. However, many conditions and risk factors—such as asthma, food insecurity, exposure to community violence, and the early onset of diabetes—are disproportionately prevalent in lower-income neighborhoods and communities of color. Sections of Bridgeport in particular fall very far behind the surrounding area in many of these measures.
  • Disparities in access to reliable transportation persist between racial and income groups. A majority of Fairfield County workers, regardless of income, commute to another town for work. Many low-income (annual wages under $40,000) workers leave Bridgeport for work, while large shares of high-income workers commute to New York City.

“The process of developing this report allowed local partners and community members to identify links between the well-being of residents and the places where they live. Looking beyond typical measures like income levels or unemployment rates, the Community Wellbeing Index reveals a much more uneven distribution of opportunities in areas such as neighborhood walkability, economic development, public health, and education,” said Mark Abraham, Executive Director of DataHaven and a lead author of the report. “The impact that these barriers to opportunity have on overall well-being and happiness will serve as a call to action for many groups working to improve Fairfield County’s diverse neighborhoods and towns.”

The Fairfield County Community Wellbeing Index 2016 was based on a variety of federal and statewide data sources. Partners of DataHaven’s Fairfield County Community Wellbeing Index 2016 include Fairfield County’s Community Foundation; Bridgeport Hospital; Danbury Hospital; Greenwich Hospital; Norwalk Hospital; St. Vincent’s Medical Center; and Stamford Hospital.