Public Hearings Conclude; State Spending Cap Commission Seeks Definitions to Impact Spending Decisions

“Stop with the financial games and own up to the problem.”  That was the succinct comment provided to the 24-member state Spending Cap Commission by Darien resident Ken Weil at a public hearing this fall.  Small business owner Justin Higgins, of Orange, added that citizens should “always know where we stand financially without loopholes and political gamesmanship.” The Commission has held 18 meetings, beginning in March and most recently on November 14, as well as five public hearings during the past two months, during which nearly two dozen people filed testimony.  With the state anticipating an estimated $3.1 billion deficit for the next two fiscal years, dollars and sense will be front and center when the legislature, with 30 new members and a dead-even split in the State Senate, convenes in January.

The Commission next meets on Nov. 28, according to CT-N.  Public Act 15-1, December Special Session (Section 24) established the Spending Cap Commission, charged with creating, for the purposes of the state's constitutional general budget expenditures requirements, proposed definitions of (1) "increase in personal income", (2) "increase in inflation", and (3) "general budget expenditures".

What the commission has been asked to address is two decades in the making - definitional questions with fiscal implications that have influenced policy and budget balancing since the passage of the state income tax in the early ‘90’s.  The Director of UConn’s Center for Economic Analysis, Fred Carstensen, said in an article published this month that “the spending cap as designed has been an unmitigated disaster, fiscally and economically.” spending-cap

The Commission is chaired by William Cibes, a former state legislator and Secretary of the Office of Policy and Management when the income tax was imposed and state spending cap was approved by voters, and Patricia Widlitz, also a veteran former legislator.  Members include Republicans and Democrats currently serving in the legislature, and others who have extensive experience with state government, in the public or private sector.  It is likely that the incoming state legislature will be looking to the Commission’s findings, as it grapples with the way forward for state finances.

As the public hearings approached in October, the Commission voted to include the following proposed definitions to be addressed:

  • “Increase in personal income” means the compound annual growth rate of personal income in the state over the preceding five calendar years, according to United States Bureau of Economic Analysis data
  • “Increase in inflation” means the increase in the consumer price index for urban consumers, all items less food and energy, during the preceding calendar year, calculated on a December over December basis, according to United States Bureau of Labor
  • The Commission is still considering potential optional language for the third proposed definition – “general budget expenditures” – it is charged with creating. That language may concern, among others, such expenditures as payments for bonds, notes and other evidences of indebtedness, court orders, federal mandates, grants to distressed municipalities, as well as the use of federal funds and monies contained in the budget reserve fund. Proposed language pertaining to these and other additional topics pertaining to general budget expenditures may also be suggested at the public hearing, and considered by the Commission.

Some of the comments received by the Commission, at hearings in Hartford, New Haven, Bridgeport, Willimantic and Waterbury, are quite clear on what the result ought to be done, even if precise wording is not offered:

connecticut-state-capitolLouise DiCocco, Assistant Counsel for the Connecticut Business & Industry Association, noted that “24 years ago, more than 80 percent of Connecticut votes overwhelmingly approved a spending cap to keep the cost of state government within the taxpayers’ means to afford it.  Voters demanded the cap as an offset to the persona income tax in Connecticut.  The state must enact a spending cap that is ironclad and works.”

Added the MetroHartford Alliance in testimony by Vice President Patrick McGloin: “Adoption by the legislature of well-crafted spending cap definitions will clearly demonstrate to our fellow residents and private sector employers that we have the political will to be fiscally disciplined.”  DiCocco noted that “the spending cap has always had a safety valve or escape mechanism.  They include bonded debt service, aid to distressed municipalities and first year costs of federal or court ordered mandates.”

The Connecticut affiliate of the National Federation of Independent Businesses pointed out that “reasonably understood, clear definitions of the key terms that will lead to additional budget transparency, predictability and ultimately cap state spending on an annual basis in a way that aptly reflects the will of the voters,” adding that “business owners feel that the legislature absolutely needs to stop allowing excessive spending to be an option and to recognize the ‘new economic reality’, just as small business owners have had to do. Achieving that goal is the most effective economic development policy we could have, and we believe that implementing the constitutional spending cap, and properly defining component terms, would go a long way in this regard.”

Westport resident Tom Lasersohn observed that “In business you learn that for every one customer that complains, there are many you have already lost as customers. For every citizen who gives testimony to this Commission, there are many who are so disgusted with the State’s fiscal mismanagement and chicanery that they will leave at the earliest convenient opportunity. Many outside the State peer in and resolve ‘no, not for me until the State gets its fiscal act together.’ A responsible definition for ‘general fund expenditures’ will communicate to both current and prospective residents and businesses that we are serious about fixing our problems.”
official_logo_mdState Senator Toni Boucher of Danbury told the Commission:  “I hope that the commission to adopt a definition of general budget expenditures that is comprehensive and gives a complete and realistic account of all the money that the state spends… it is equally critical that the legislature not be allowed to move what was once an expenditure included under the cap to bonding or fund it with a revenue intercept for the purpose of undermining the cap’s integrity.”

The final form of Commission recommendations remains unclear.  Minutes of the Commission’s most recent scheduled meetings, on October 31 and November 14, have not yet been posted to the Commission’s website, nor has an agenda for the Nov. 28 meeting (as of Nov. 27).

While Boucher is not a member of the Commission, a number of her legislative colleagues are.  The definitions – and the implications for the state’s budget and taxpayers – may soon be theirs to decide.  A decade ago, a UConn report observed that “the spending cap is only as restrictive as the legislative process decides it should be; its strictures are not written in stone.”

ct-nUPDATE: 

link to Agenda for Commission's Final Meeting on Nov. 28, 2016 and CTNewsJunkie article reporting on meeting.

link to CT-N video of Commission's Meeting on Nov. 28  at the Legislative Office Building in Hartford; Next meeting scheduled for Dec. 5

CT Ranked 9th Among Small States in "Main Street Entrepreneurship," Showing Improvement

Improvements in Connecticut’s “Main Street Entrepreneurship” has pushed the state’s ranking to 9th among the nation’s 25 smaller states, up from 12th a year ago, in the latest analysis from the Kauffman Foundation. The nation as a whole and most states and metro areas are experiencing higher rates of small business activity, according to the 2016 Kauffman Index of Main Street Entrepreneurship.  Nationally, there was a sharp uptick in the survival rate of businesses in the last year. At the same time, Main Street entrepreneurship activity gained ground in 47 states and 38 of the 40 largest metropolitan regions.kauffman

Among the nation’s smaller states, the top ranked entrepreneurial states were South Dakota, Vermont, Montana, North Dakota, Maine, Iowa, Nebraska, New Hampshire.  After Connecticut, Oregon rounded out the top ten.  Connecticut was one of only two states to move up three positions in the ranking.

The state’s rate of business owners was 6.55 percent; the percentage of the adult population that owns a business as their main job, according to the survey data.

The number of established (older than four years) small (less than fifty employees) businesses per 1,000 firms was 649.9 in Connecticut.  In Massachusetts, which ranked third among the nation’s 25 larger states, it is 684.7.  The top ranked larger states were Minnesota, Wisconsin, Massachusetts, Colorado, Pennsylvania, Maryland, Ohio, Louisiana, California and Illinois. state

"The Main Street Entrepreneurship Index provides additional evidence that U.S. small business activity has rebounded from the downturn and continues to gather strength," said Arnobio Morelix, senior research analyst at the Kauffman Foundation. "More new businesses are making it through their first five years of operation. While this could indicate that a lack of dynamism is allowing less-productive firms to hang on longer, overall the entrepreneurial increases bode well for the established, small businesses that underpin much of our economy."

Among the larger states, the rate of businesses surviving through their first five years ranges from 44 percent in Arizona to 53.3 percent in Pennsylvania. Among the smaller states, the business survival rate ranges from 43.4 percent in Nevada to 58.1 percent in North Dakota.  In Connecticut, the rate is 51.35 percent, the 8th highest among the 25 smaller states.

In start-up activity, Connecticut ranked 22nd out of 25 smaller states, a drop of two positions since last year.  The Survival Rate of American businesses is the main driver of the recent improvements in Main Street Entrepreneurship in the United States, and has reached a three-decade high of 48.7 percent—meaning that almost half of new businesses make it to their fifth year of operation.chart

U.S. Census Bureau business statistics show that established small businesses represent almost 68 percent of all employer firms in the country.   The five metros with the highest Main Street entrepreneurship activity are Pittsburgh, Boston, Portland, San Francisco and Washington, D.C.

The Kauffman Index of Main Street Entrepreneurship captures business activity in all industries and is based on both a nationally representative sample size of roughly 900,000 responses each year and the universe of all employer businesses in the United States, in a dataset that covers approximately five million businesses.

Aerospace Components Manufacturers to Convene in Hartford

Aerospace Components Manufacturers (ACM) “Future WorkForce Opportunities” Fair and Trade Show draws over 850 students to learn about the many career paths available in the local aerospace manufacturing industry. The event takes place the afternoon of Nov. 9 at the Connecticut Convention Center in Hartford.worldsaerospacealley_logo_rev-1 ACM comprises one of the largest, most experienced concentrations of world-class aerospace companies, the world's AEROSPACE ALLEY! ® The organization points out that member firms grew up where aerospace was born. Today, precision components manufacturer in the state take to the skies every day, in every corner of the globe, as they have since the inception of powered flight.

ACM member companies are “united by a single goal; be the world leader in providing customers with aerospace components of unsurpassed quality, at competitive prices and always, on-time delivery.”

To achieve that goal, officials work with peers and with regional, national and international experts to ensure continuous improvement of our products and services. The cornerstone of the effort is an aggressive program for adopting and implementing lean enterprise practices and conducting ongoing workforce training and development.acmlogo-notagline2

Student attendees of the event will have an opportunity to meet and talk with representatives of 100 top suppliers, all in one place at one time.  Last year, over 800 students and teachers visited from 32 schools spread across Connecticut and southwestern Massachusetts to learn about the array of career choices available in the aerospace manufacturing industry.


CT's Science and Technology Ranking Rises to 6th in the Nation

Following three consecutive finishes ranking ninth in the nation in the State Technology and Science Index (STSI), Connecticut has moved up to number six in 2016, it’s highest finish in more than a decade.  The state ranked ninth in 2010, 2012 and 2014 in the analysis produced every other year by the Milken Institute, following a 7th place ranking in 2008 and 10th in 2004.  The ranking was the highest for the state in all seven releases of the STSI index. The STSI benchmarks states on their science and technology capabilities and broader commercialization ecosystems that contribute to company growth, high-value-added job creation, and overall economic growth, the institute’s website explains.  ct-ranks-6th

“We view the STSI as a measure of a state's innovation pipeline. The index isn't intended to be a measure of immediate economic impact, but rather to demonstrate that the return on science and technology assets will accrue in future years.”

The top five states in 2016 are Massachusetts, Colorado, Maryland, California and Washington.  Rounding out the top 10, after Connecticut, are Minnesota, Utah, Virginia and Delaware.

In specific categories, the state’s ranking varied, with considerable improvement in some categories. In the Technology and Science Workforce composite index, Connecticut ranked 10th, an improvement from rankings of 16th in 2014, 13th in 2012 and 14th in 2010.  This composite measures the relative presence of high-end technical talent, and consists of 18 eighteen various indicators.

stsi-reportThe STSI's 107 individual indicators are sorted into five composites: Research and Development Inputs, Risk Capital and Entrepreneurial Infrastructure, Human Capital Investment, Technology and Science Workforce, and Technology Concentration and Dynamism.  The report indicated that "Connecticut showed major improvement in the Technology Concentration and Dynamism index, going from 21st to 10th. This dramatic rise marks one of the larger overall changes on this index. While modest increases were seen in the Research and Development Inputs index and Human Capital Investment index, these two indices have a much heavier focus on stock measures, and Connecticut’s aerospace and defense sectors help anchor the state’s performance in these areas."

Connecticut also ranked 10th in the Technology Concentration and Dynamism composite index, the state’s highest ranking in that category, and largest jump from two years ago.  In 2014, Connecticut ranked 21st.  In the two previous analyses, Connecticut was 12th in 2012 and 18th in 2010.

logoIn the Human Capital Investment composite index, Connecticut ranked third, as it did in 2014 and 2012, after ranking fifth in 2010.  In Research & Development, Connecticut placed eighth, its second highest finish, after ranking tenth, seventh and seventh in previous indexes.  Connecticut ranked 11th in Risk Capital and Entrepreneurial Infrastructure, up from 14th two years ago, but not as high as sixth place in 2012 and third in 2010.

The Human Capital Investment composite index looks at how much is invested in developing the workforce—the most important intangible asset of a regional or state economy. Twenty-one indicators are included in this composite index.  The R&D composite examines a state's R&D capacity to see if it has the facilities that attract funding and create innovations that could be commercialized and contribute to economic growth, and includes eighteen indicators.  The Risk Capital and Entrepreneurial Infrastructure Composite Index determines the success rate of converting research into commercially viable products and services. It includes 12 indicators.

While Connecticut was gaining ground, other states were bottom dwellers.  The analysis raised alarms regarding the prospects for those states.

map“The states with the weakest innovation assets and ecosystems for starting and growing innovative firms face a bleak future unless changes are made. West Virginia, Arkansas, Mississippi, Kentucky, and Louisiana make up the bottom five in this year's STSI. They are the least knowledge-intensive and their residents exhibit weak entrepreneurial skills. All of them have undertaken efforts to change their position in technology and science but have had limited success.”

Massachusetts remained in first place with a score of 83.7, retaining the position it has held since the inaugural STSI was released in 2002.

Wyoming, the most improved state, climbed 10 places, to 36th. The state had broad gains but benefited most from the broader definition of occupations in the Technology and Science Workforce category, which included its talent in mining engineering, the analysis pointed out. Missouri rose six spots, to 28th; seen as primarily attributable to a 24-place leap in Risk Capital and Entrepreneurial Infrastructure.

Diverse Hispanic Workforce More Likely to Face Challenges, Report Finds

There are about 24 million workers of Hispanic descent in the United States. While this group is frequently referred to as a single entity, the reality is that these workers come from a variety of ethnic backgrounds, each with their own challenges in the labor market. A new report from the Center for Economic and Policy Research (CEPR) provides an overview of the diverse backgrounds of the Hispanic workforce, and shows how each group experiences unique challenges in the labor market, specifically in terms of unemployment, wages, poverty, language barriers, and access to health and retirement benefits.workforce

The report, “Hispanic Workers in the United States” also shows that union representation has helped to address some of these challenges. Some highlights from the report include:

  • Workers of Mexican descent are by far the largest subgroup of the Hispanic workforce (14.9 million);
  • Women make up only 43.3 percent of the overall Hispanic workforce, but they are a majority of several subgroups, including Panamanians (58.1 percent), Bolivians (53.2 percent), and Paraguayans (51.0 percent);
  • sq-social-media-logo-gray200pxby200pxAbout two-thirds of Hispanic workers are U.S. citizens – Puerto Ricans (98.7 percent) and Spaniards (90.9 percent) are the groups most likely to be citizens;
  • Hispanic workers in general are more likely than workers of any other race/ethnicity to be in poverty. Among Hispanics, Guatemalans are most likely to be members of the working poor (19.1 percent);
  • About 30 percent of Hispanic workers do not have health insurance, but over half of Guatemalan and Honduran workers lack health insurance.

hispanics-ctConnecticut’s population is 15 percent Hispanic, the 11th largest Hispanic statewide population share nationally, according to the Pew Hispanic Center.  The Latino population increased by 50 percent in Connecticut from 2000 to 2010. The highest percentage of Hispanics in Connecticut municipalities are in Hartford, Willimantic, Bridgeport, New Britain, Waterbury, Meriden, New Haven, New London, Stamford and Danbury, according to Zip Atlas. In Connecticut, Mexicans are the second largest Hispanic community in the state behind Puerto Rican residents, CT Mirror has reported. Willimantic, New Haven and Norwalk have the three highest Mexican populations in Connecticut, with 5.24 percent, 2.8 percent and 2.28 percent, according to 2013 data.

The American Immigration Council reports that the Latino share of Connecticut’s population grew from 6.5% in 1990, to 9.4% in 2000, to 14.7% (or 527,163 people) in 2013. In 2009, 94.4% of children in Latino families in Connecticut were U.S. citizens.

Orlando Rodriguez, former legislative analyst at the now-defunct state Latino and Puerto Rican Affairs Commission, told ctlatinonews.com last year that Connecticut’s future is largely dependent on how successful Latinos are in getting into the middle class, and how successful the state is in being able to create middle class jobs for them.

“Simply put,” he said, “The numbers are growing, and if Latinos don’t enter the middle class of Connecticut in large numbers, the state’s economy will feel it negatively…and if they do enter it in large numbers, the economy will grow.”

Cherrie Bucknor, author of the CEPR report explained, “Understanding the diversity and challenges faced by Hispanic workers is key to making better policy decisions.”  The Center for Economic and Policy Research (CEPR) is an independent, nonpartisan think tank that was established to promote democratic debate on the most important economic and social issues that affect people's lives.

Pasta Making Business Continues to Grow, Government Continues to Help

Sometimes, home-grown businesses decide to stay in Connecticut.  That was the case this fall as Carla’s Pasta – an American Dream business success story – reportedly spurned an offer to relocate to a western state, and chose instead to expand in South Windsor, aided by a significant tax abatement. The company produces filled pastas, Italian sauces and pestos, appetizers, and entrees. The brainchild of Carla Squatrito, the business now employs 156 people, including her sons, Sandro Squatrito and Sergio Squatrito, who are vice presidents of business development and operations, respectively. The Italian food product manufacturer, which was launched in 1978, in Manchester and moved to South Windsor in 1997. carlas1

The latest expansion deal, as reported by the Journal Inquirer, will see the town give the family-run Carla’s Pasta a 70 percent tax abatement for seven years, reducing the company’s tax burden by well over $200,000 per year.  The planned expansion is expected to generate 60 to 100 new jobs, and is due to be completed next fall. In 2013, Carla's completed a 30,000-square-foot expansion of its South Windsor facility, the Hartford Business Journal reported.

Town Manager Matthew Galligan, the JI reported, said the state of Utah was courting the company, but Carla’s ultimately decided to stay in town as a result of the deal that was approved by the Town Council.

Carla, a native of the small Italian village of Madonna del’Olmetto, emigrated to the U.S. at age 27.  Her business began as a means of bringing “home-made filled pastas, Italian Sauces and Pestos, made from fresh ingredients, the flavors of her youth” to local customers, retail and later wholesale.  Since 2010, Carla has been recognized by the National Women Business Owners Corporation as an outstanding CEO.carla

The company distributes its pasta to restaurants, institutions and supermarkets. In 2012, the company estimated that it was making about 2 million pounds of pasta per month, with projections to increase that number by a third.

The company received a bridge loan of $2,175,000 from Connecticut Innovations that year to help purchase and install a fuel cell along with a $750,000 grant from the Connecticut Clean Energy Fund. The state assistance was aimed at supporting the company efforts to be environmentally conscious and energy efficient.

In Oct. 2015, the company launched its own retail brand, Cucina di Carla.  Among the distinctive products inspired by the season:  autumn-inspired cinnamon clove pasta ravioli filled with golden pumpkin, whole milk ricotta and Fall spices.

https://vimeo.com/150720277

CT Families Continue to Struggle Financially, United Way Report Reveals

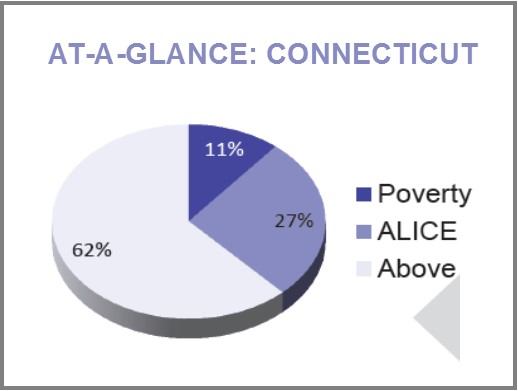
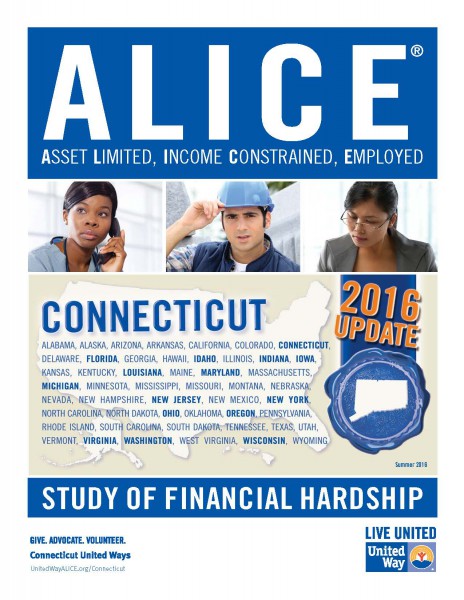
More Connecticut households are struggling to pay for their most basic needs, according to a new report from United Way.  More than one out of four households - in one of the wealthiest states in the U.S. - are employed, yet still fall below what is needed to thrive financially.  That is an increase in both the number and percentage of such households in 2014 as compared with 2012, according to the updated ALICE report. Two years ago, United Ways introduced ALICE, which stands for - Asset Limited Income Constrained Employed - to place a spotlight on a large population of residents who are working, but have difficulty affording the basic necessities of housing, food, child care, health care and transportation.pie

In those two years, the problem has grown worse, even has the recession has given way to a slow economic recovery, in Connecticut and nationwide.  ALICE and poverty households combined account for 38 percent of households in the state that struggle to make ends meet.

A total of 361,521 Connecticut households fall into what the study describes as the ALICE population. These are households earning more than the official U.S. poverty level, but less than the basic cost of living. This is more than 2.5 times the number of households that fall below the federal poverty level. ALICE households make up 20% or more of all households in 114 (67%) of Connecticut’s 169 cities and towns.

The highest levels (ALICE and poverty households) were in Hartford (74%), New Haven (65%), Waterbury (63%), Bridgeport (63%) and New Britain (63%).  Also above 50 percent are Meriden, West Haven, East Hartford and New London.  From 2007 to 2014, two cities, Danbury and Waterbury, saw their total household population decrease, by 7 and 9 percent respectively, while the rest experienced an increase in households, with the largest increase of 8 percent in Stamford, according to the report. The number of household below the ALICE Threshold increased in every one of the nine largest cities and towns with Norwalk seeing the largest percent increase (38 percent).

2016-alice-report-update-coverWhile the prevalence of low-wage jobs still defines Connecticut’s economy for ALICE, for the first time in the past decade, the percent of jobs paying less than $20 per hour fell below 50 percent of all jobs.  The report also highlights a number of trends in Connecticut, including:

  • The population is aging, and many seniors do not have the resources they need to support themselves.
  • Differences by race and ethnicity persist and ethnicity persist, creating challenges for many ALICE families, as well as for immigrants in Connecticut.
  • Low-wage jobs are projected to grow faster than higher-wage jobs over the next decade.
  • Technology is changing the workplace, adding some jobs, replacing many others, while also changing where people work, the hours they work, and skills required. The report notes that technology creates opportunities as well as challenges for ALICE workers.

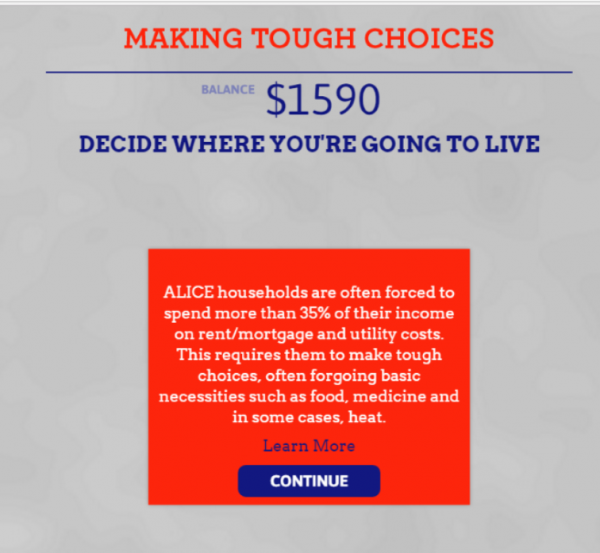
For the first time, an online simulator is also available to experience the financial challenges that ALICE households in Connecticut face at www.MakingToughChoices.org.  The updated Report uses data from a variety of sources, including the U.S. Census and the American Community Survey to provide tools that quantify the number of households in Connecticut's workforce that are struggling financially. The updated United Way ALICE Report reveals:

  • The composition of the ALICE population is men and women, young and old, of all races.
  • The breakdown of jobs in Connecticut by hourly wage (51% of jobs pay more than $20/hour) compared to what it costs to survive for a family of four (2 adults, 1 infant, 1 preschooler) - $70,788.
  • Every city and town in Connecticut has ALICE households. More than two-thirds of Connecticut's cities and towns have at least 1 in 5 households that fit the ALICE definition for financial hardship.cropped-alicemicrositelogo2

Poverty and ALICE households exist in every racial and ethnic group in Connecticut, but the largest numbers are among White non-Hispanic households. There were about one million White households in 2014, compared to 328,000 households of color (Figure 4 shows the populations of color for whom there is income data: Hispanic, Black and Asian). However, these groups made up a proportionally larger share of households both in poverty and ALICE: 64 percent of Hispanic households, 58 percent of Black households, and 30 percent of Asian households had income below the ALICE Threshold in 2014, compared to 31 percent of White households.

The largest population of color in Connecticut, Hispanics, has been growing since 2007, totaling 156,837 households in 2014, a 25 percent increase. As the number of Hispanic households increased, so did the number and proportion of Hispanics living below the ALICE threshold. The percentage of Hispanic ALICE households rose from 34 percent in 2007 to 39 percent in 2010 and then to 43 percent in 2014. Together Hispanic households in poverty and ALICE made up more than two-thirds of Hispanic households in 2014.

making-tough-choicesThere are some signs of improvement in the education gap among racial and ethnic groups, suggesting that some structural changes are occurring in Connecticut. In K-12 education, the Education Equality Index (EEI) shows that the achievement gap – the disparity in educational measures between socioeconomic and racial or ethnic groups – narrowed slightly between 2011 and 2014 in Connecticut.

Achievement gaps impact graduation rates and college performance. Among the Class of 2013, 64 percent of Black students and 59 percent of Hispanic students in the state went on to college within a year after graduating from high school, compared to 78 percent of White students. They also had lower 6-year college graduation rates: While 54 percent of White students got a college degree within 6 years, only 24 percent of Black students and 21 percent of Hispanic students did the same (Connecticut State Department of Education, 2015).

The updated ALICE Report recommends both short-term and long-term strategies to help ALICE families and strengthen our communities. United Ways work with many community partners to provide support to ALICE families to help them get through a crisis and avoid a downward spiral into even worse circumstances such as homelessness as well as assisting with financial literacy, education and workforce readiness.

Further, United Ways in Connecticut have invested more than $8.5 million in child care and early learning; $1.3 million in housing and homeless prevention work; $5 million in basic needs programs; and, have assisted working families in obtaining nearly $40 million in EITC and tax refunds and credits in 2016.

The updated Connecticut ALICE Report was funded by the 16 Connecticut United Ways. For more information or to find data about ALICE in local communities, visit http://alice.ctunitedway.org.  Connecticut United Ways are joining with United Ways in fifteen other states to provide statewide ALICE Reports. The updated Connecticut ALICE Report provides analysis of how many households are struggling in every town, and what it costs to pay for basic necessities in different parts of the state (Household Survival Budget).

https://youtu.be/u7gPJGu2psw

 [2014 ALICE introductory video]

First Niagara Transitions to KeyBank This Weekend

For customers of the soon-to-be-history First Niagara Bank, this will be a holiday weekend of banking transition, as KeyBank becomes the new name on the door on Tuesday morning after a host of changes inside. First Niagara branches, converting to KeyBank, will close at 3 p.m. Oct. 7 and reopen for business the morning of Oct. 11, the day after Columbus Day. The company promises a smooth transition, and has been providing customers of the bank’s more than 60 branches in Connecticut with step by-step previews of what to expect. The changes represent the completion of the $4.1 billion KeyCorp purchase of First Niagara.logo-lockup

“As KeyBank and First Niagara come together you can continue to bank as you currently do, using your same account number, checks, debit card, ATM card, credit card, telephone banking, online access and branches,” the company website points out.

First Niagara has 65 branches in Connecticut that will be transitioned to KeyBank branches. There were no existing KeyBank branches in the state prior to the merger, so there was no overlap that required branch closings, as is often the case with bank mergers.

Headquartered in Cleveland, KeyBank’s footprint includes 15 states via a network of more than 1,200 branches and more than 1,500 KeyBank ATMs. The company’s roots trace back 190 years to Albany, New York. Since then, KeyCorp has grown into one of the nation's largest bank-based financial services companies, among the top 15, with assets of approximately $135 billion, according to the company.

keybank-mapIn recent months, First Niagara did consolidate five Connecticut branches (Woodstock, Dayville, Hamden, East Haven and Madison), and all of the employees who worked at those branches were offered positions within the bank, officials indicated, and no layoffs were associated with that consolidation.

"By asset size, this is the largest bank merger since the financial crisis,” Beth E. Mooney, Key’s chairwoman and CEO, told the Buffalo News last month, during a visit to Key’s Northeast regional headquarters in Buffalo, which had been First Niagara’s corporate headquarters.

“So there is a significance and an importance for us to do it well that’s critical for our communities, our clients, our employees and our shareholders. But from an industry perspective, this is actually one that there’s a fair amount of eyes on us, as well.”

The conversion of First Niagara accounts and services to KeyBank will begin at with a 3 p.m. close of business on Friday, October 7.  Due to Online Banking updates, customer balances that appears online on Thursday, October 6 at 11:59 p.m. will not change until Saturday, October 8, at 6 a.m., so any purchases or deposits made during that time will not be reflected on online balances until Saturday. Customers can continue to use current First Niagara ATM/debit card, account numbers and PINs will not change.

The acquisition of First Niagara by Keycorp was announced on Oct. 30, 2015, and includes the addition of approximately 300 First Niagara branches in New York, Pennsylvania, Connecticut and Massachusetts.  First Niagara had entered the Connecticut market in 2011 with the purchase of New Alliance Bank.

State Resident Published by National Magazine Concludes "Connecticut's Bad for Business"

The headline in the story posted over the weekend at the National Review website says simply, “Connecticut’s Bad for Business.” The article explains that “the state’s perpetual budget crisis has continued unhindered, with no resolution on the horizon,” and points to “a long list of causes” for the adverse business climate: “burdensome regulations, the second-highest tax burden in the country, restrictive zoning rules, high costs of labor, a lack of meaningful regional cooperation, clogged highways, crowded trains, and overall inadequate public transportation.”

The National Review focus on Connecticut launches into a discussion of “the educational disparities that characterize the school systems” including this spending review:national-review

“New Haven, featuring a perpetually beleaguered and fairly depleted school system, spends $17,200 per student. Fairfield, the wealthy town right next door to Bridgeport, actually spends less — just under $16,000. Waterbury, one of the poorest cities in the state, spends $15,000 per student; West Hartford, regarded by all as some sort of suburban Zion, spends $500 less. Hartford spends $19,400 per student, more than the New York exclaves of New Canaan and Darien and more than the shoreline oases of Madison and Guilford.”

The article suggests that among the factors adversely impacting the quality of education in urban districts is “stunningly dysfunctional boards of education” that feature “bitterly personal partisan acrimony” and “an inability to rise above petty, factionalist squabbling.”  Some examples are outlined.

Education funding, likely to be front and center in the 2017 state legislative session following a sweeping court decision now being appealed by the state, drew this observation:  “Wealthy towns may, on average, spend more per student than poorer towns and cities do, but it’s not a hard-and-fast rule; sometimes poor towns spend more, and sometimes they spend less. In any case, spending can’t explain it all.”

bearingsRecent articles by The New York Times and Atlantic are referred to, noting that they also reflected poorly on the state’s current condition.  National Review adds to the journalistic observations of a state filled with seemingly intractable dilemmas, noting that “Connecticut’s tax system is currently so dependent on the incomes of Fairfield County high-earners — as Governor Malloy has often made clear — that even the slightest variations can trigger a budget crisis.”  The article adds, however, that “finance lies somewhere near the bottom of a long list of factors in explaining the current state of Connecticut.”

The article suggests that GE’s departure and Sikorsky’s recent decision to stay in the state both reflect Connecticut’s weakness.

“That Sikorsky probably would have followed GE’s path out of the state without (state subsidies) suggests to me that Connecticut just isn’t a good place for business anymore — unless the state opens the coffers. The lack of middle-class jobs in Connecticut cannot be explained by an overreliance on finance in one of the state’s eight counties; rather, it has far more to do with Connecticut’s long-decaying business climate.”

The article was authored by National Review intern Noah Daponte-Smith, who is also a Yale University student and staff reporter and writer for the Yale Daily News, described as a “student of modern history and politics.”  Smith has also written - last summer - for Forbes, focusing on “British politics in the domestic and European spheres.” He is a graduate of the Hopkins School in New Haven.

Daponte-Smith indicates that Connecticut’s “problem can be solved,” but concludes that “blaming inequalities in education funding or the prominence of finance in Fairfield County’s economy are poor places to start.”

Some Businesses Anticipate More Hiring in CT, But Employers Expectations Lower than Last Quarter, Last Year

Employers in Connecticut expect to hire at an “upbeat pace” during the fourth quarter of 2016, according to the Manpower Employment Outlook Survey, but hiring intentions are weaker than in the previous quarter, and a year ago. Nearly one in five Connecticut employers, 18 percent of the companies interviewed, plan to hire more employees between October and December, while 6 percent expect to reduce their payrolls. Another 73 percent expect to maintain their current workforce levels and 3 percent are not certain of their hiring plans. This yields a Net Employment Outlook of 12 percent, according to Manpower, which produces the quarterly surveys of business hiring plans.

q4Those numbers are not as strong as in previous surveys, taken  in advance of the third quarter of this year, and prior to the fourth quarter a year ago. Nationwide, the trend is in the opposite direction.  Employers indicate a slight increase in hiring plans for the final three months of 2016.

“Hiring intentions are weaker compared to Q3 2016 when the Net Employment Outlook was 15 percent,” Manpower spokesperson Betty Gooding said about the Connecticut numbers. “The hiring pace is expected to slow down compared to one year ago when the Net Employment Outlook was 16 percent.”

Among metropolitan areas in Connecticut among the top 100 surveyed nationwide, 16 percent of Bridgeport area employers anticipate more hiring in the fourth quarter, compared with 8 percent of Hartford region employers, according to the survey data.

For the coming quarter, job prospects appear best in Transportation & Utilities, Wholesale & Retail Trade, Information, Financial Activities, Professional & Business Services, Education & Health Services, Leisure & Hospitality and Government.ct-usa  Employers in Durable Goods Manufacturing, Nondurable Goods Manufacturing and Other Services plan to reduce staffing levels, while hiring in Construction is expected to remain unchanged, according to the survey.

Connecticut’s employers’ hiring projections are also slightly lower than the nationwide numbers.  Of the more than 11,000 employers surveyed in the United States, 22 percent expect to add to their workforces, compared with 18 percent in Connecticut, and 6 percent expect a decline in their payrolls during Quarter 4 2016. Sixty-nine percent of employers anticipate making no change to staff levels, and the remaining 3 percent of employers are undecided about their hiring plans.

net-ctIn the Northeast, 20 percent of employers surveyed anticipate stronger hiring activity in Quarter 4 2016.  Connecticut employers expectations are somewhat lower.

Heading into the fourth quarter, the states with the most optimistic hiring outlook are Hawaii, Tennessee, Utah, Montana, Florida and Arizona.  The most pessimistic are Alaska, New Jersey, Wyoming, Puerto Rico and Indiana.

The Manpower Employment Outlook Survey is conducted quarterly to measure employers’ intentions to increase or decrease the number of employees in their workforces during the next quarter. The Manpower Employment Outlook Survey’s United States results are based on interviews with 11,000 employers located in the 50 states, the District of Columbia and Puerto Rico, which includes the largest 100 Metropolitan Statistical Areas based on number of business establishments.