Credit Card Balance? CT Residents Have Nation's Second Highest, on Average

With the holiday gift-giving season on the horizon, the sound of credit cards are being pulled from wallets and numbers being typed into online sites is also upon us. Before those bills even come due, Connecticut residents have a head start in building credit card balances. Connecticut residents have the highest average credit card balance, at $7,258, in the continental United States.  Alaska, at $8,515, is the only state where residents have a higher average balance in the U.S.

Rounding out the top ten are Virginia ($7,161), New Jersey ($7,151), Maryland ($7,043), Hawaii ($6,981), D.C. ($6,963), Texas ($6,902), Colorado ($6,718), and Georgia (6,675).  New York is next at $6,671.

The states with the lowest credit card balances overall are Iowa and Wisconsin, with an average of $5,155 and $5,363, respectively.

Connecticut average credit card balance - $7,258, - is not only second highest in the nation, but the average number of credit cards owned by Connecticut residents is 3.23, which ranks fifth among the states.  The states where people opened the most credit cards were New Jersey and New York, with an average number of 3.49 and 3.34 cards per person, respectively.

On the state’s average income of $70,121, which is second highest in the U.S., the average credit card balance is 10.35 percent of income.  Because of Connecticut’s high average income, the percent of income average is fourth lowest among the states.

The analysis, by the financial website Upgraded Points, used data of average credit card balances from Experian’s State of Credit: 2017, and data of average annual income by state in 2017 from research by the Federal Reserve Bank of St. Louis.

The analysis notes that “for the 58.8 percent of American households that pay off their balances in full, credit card debt is not a problem. But the other 41.2 percent carry some amount of debt every month and must pay interest fees.” In 2017, overall American credit card debt, according to Upgraded Points, broke through the $1 trillion mark and set an all-time high. The last time credit card debt was over $1 trillion was right before the Great Recession in 2008. In 2017, a survey by Pew Research found that only 46 percent of Americans made more than they spent.

The data indicates that states near the coasts tend to have the highest absolute credit card balances. “The only two states in the top 10 that aren’t by the ocean are Texas and Colorado.  States in the Midwest tend to have the lowest average credit card balances. Only three states in the bottom 10 were not in the Midwest: West Virginia, Arkansas, and Mississippi.”


Westport Earns Top 20 Ranking Among Nation's Small Cities; Shelton Reaches Top 100

For those looking to identify the best small cities in the nation - with populations between 25,000 and 100,000 – the search may not need to go further than Connecticut, according to a new analysis. Westport was the lone Connecticut community to reach the top 20 nationally, at number 19, with Shelton also earning a place in the top 100, at number 85, and Norwalk (#146), Trumbull (#157) and West Hartford (#159) also reaching the top 200.

The analysis, by the financial services website WalletHub, was based on 40 key indicators of livability, ranging from housing costs to school-system quality to restaurants per capita.  The indicators were grouped into five categories – affordability, economic health, education & health, safety, and quality of life.

On those scales, Westport was ranked 20th in education & health, 65th in safety, 82nd in economic health, 258 in affordability and 595 in quality of life.  Other than Westport, no Connecticut community reached the top 30 in any overall category.

"Of the 22 Connecticut cities analyzed, 18 ranked in the top half. This is an indication that many Connecticut communities are able to offer high quality of life at low living costs," said WalletHub analyst Jill Gonzalez.  "Westport in particular made it to the top of our ranking due to several factors. The city has a very healthy economy, demonstrated by the fact that its residents have one of the highest median household incomes, and had absolutely no personal bankruptcies filed in the past year. It also has one of the lowest crime rates in the country."

Westport tied for fourth in the U.S. for the highest percentage of the population with a high school diploma or higher.  Trumbull had the second lowest percentage of population in poverty in the U.S., just behind Plainfield, lllinois.

Just outside the top 200 communities, were Stratford, Milford, Middletown, Danbury, Newington, Torrington, Bristol, Manchester, and Naugatuck.

Nationwide, among the 1,200 communities included in the analysis, leading the way were Leawood, KS; Carmel, IN; Princeton, NJ; Brentwood, TN; Milton, MA; Needham, MA; Los Altos, CA; Littleton, CO; Newton, MA; and West Fargo, ND.  Massachusetts placed three communities in the top 10 and a total of six in the top 20.  Also reaching the top 20 from the Bay State were Arlington, Melrose and Wellesley.

National Startup Analysis Sees Potential, Standout Efforts Underway in Hartford

A new analysis of the status of the business startup community in six American cities – including Hartford – has found that Connecticut’s Capitol City has “strong startup potential,” and in some ways is already standing out among peers and competitors. Startup Genome, with support from the Kauffman Foundation, selected six U.S. metropolitan areas that are not in the top 40 most populous and which have been faring less well economically than the country as a whole for a deeper analysis.  In addition to Hartford, the analysis includes Albuquerque, Fresno, New Orleans, Reno and Springfield, MA.

“In each of these metros, efforts are underway to support entrepreneurs, create more startups, and generate stronger economic trajectories. Like many other American cities (and elsewhere), they’ve been through economic ups and downs and now see startups as their next best hope for sustainable and broadly-shared growth,” the report, released this week, points out.  Startup Genome works to increase the success rate of startups and improve the performance of startups across more than 30 countries.

“Every startup ecosystem shows room for growth and improvement, and Hartford has key strengths to build on. The city's strong heritage in insurance is already being leveraged by many stakeholders and the ecosystem is clearly attracting experienced talent to start and join companies,” Dane Stangler, president & chief policy officer of Startup Genome told CT by the Numbers.

In Hartford, reSET, which specializes in encouraging and assisting entrepreneurship and social enterprise, was among several local partners with whom Startup Genome worked to gather data from more than 300 respondents.  Additional partners were the MetroHartford Alliance, Wesleyan University, UConn’s Connecticut Center for Entrepreneurship and Innovation, Upward Hartford,  as well as Launch EZ, the West Hartford Chamber of Commerce and others.

“More broadly, Hartford shows greater diversity than peer ecosystems and already has a few hundred startups operating. By continuing to strengthen the local culture and focusing on startup success in key areas, the Hartford economy will enjoy higher levels of job creation and growth,” Stangler added.

Hartford and the other cities were determined to be in the Early Activation phase of the Ecosystem Lifecycle, with a mix of prominent attributes and areas with potential yet to be realized.  In its analysis, the report indicates that “just in the span of a few years the startup scene has exploded,” in Hartford, noting that:

  • investors and experts in Hartford provide more hours of help to founders than in the other cities, and more than the global average. (Experts include university faculty, corporate employees, mentors, and others.)
  • nearly four in 10 founders in Hartford are women, which is twice the global average across all ecosystems in the Startup Genome database.
  • 11 percent of startup founders in Hartford are immigrants, the second-highest in the sample.

“We’re so grateful that Startup Genome was able to include Hartford in its recent analysis of early-stage ecosystems, thanks to support from the Kauffman Foundation,” said reSET Managing Director Ojala Naeem.  “Our great city is too often overlooked, and with local and state funding being what they are, national attention on all of the amazing businesses making an impact here is more important than ever. We have so many smart and motivated entrepreneurs who are worthy of investment consideration. They just need a spotlight.”

The comprehensive assessment of Hartford’s ecosystem also noted that “Hartford’s [startup] founders claim to have the right ambition to go global,” concluding that “Hartford’s startups have more potential to strengthen Global Market Reach and Global Connectedness.” In a number of areas analyzed in the assessment, Hartford is seen as having potential to strengthen the local startup community, its reach beyond Hartford, and the demographic of startup teams.

During the past seven years Startup Genome has provided a way for entrepreneurs everywhere to “tell us about their journeys and their regions - giving their local expertise a voice at the policy-making table.” The organization’s primary research with founders, supplemented with secondary research and data from global and local partners, helps create the world’s most comprehensive research on startups. Approximately 10,000 startup founders fill out global survey providing direct input each year.

“Hartford has some record of successes – generating more will help ecosystem size and performance,” Startup Genome observed in its assessment of Hartford.

Income Inequality Increasing Faster in CT Than US; Among Largest Disparities in Nation

In Connecticut, to earn a place in the top one percent would require making $700,800, the highest threshold in the nation.  The average annual income of the top one percent is also among the highest in the nation at $2,522,806.  That is 37 times the annual income of the bottom 99 percent, which is $67, 742, according to data analyzed by the Economic Policy Institute. The data reveal that the top one percent take home 27.3 percent of all the income in Connecticut, and that the share of income by the top one percent has increased at a faster rate in Connecticut in recent years than in the nation as a whole.

Connecticut ranks #3 of the 50 states in income inequality, based on the ratio of top one percent to bottom 99 percent income.  (New York’s top one percent makes 44 times the bottom 99 percent; Florida 39 times; Connecticut 37 times)  The Bridgeport-Stamford-Norwalk metro area is the most unequal metro area in Connecticut, the data indicate. The top 1 percent make 62.2 times more than the bottom 99 percent.

Overall in the Northeast, the top 1 percent take home 24.7 percent of all the income in the Northeast.  The average annual income of the top one percent is $1,777,756 compared with $54,662 for “everyone else,” the other 99 percent.  Nationwide, the top one percent take home an annual income of $1,316,985 versus $50,107 for the other 99 percent.   The most unequal metro area in the U.S. is Jackson, WY, where the top one percent make 132 times the rest of the population.

The data is based on an Economic Policy Institute report published this summer. EPI is an independent, nonprofit think tank based in Washington, D.C. that researches the impact of economic trends and policies on working people in the United States.

The report used 2015 data, the most recent available, finding that the top 1 percent of families in the U.S. earned, on average, 26.3 times as much income as the bottom 99 percent—an increase from 2013, when they earned 25.3 times as much.

Eight states plus the District of Columbia had gaps wider than the national gap. In the most unequal—New York, Florida, and Connecticut—the top 1 percent earned average incomes more than 35 times those of the bottom 99 percent.

The report found that income inequality has risen in every state since the 1970s and, in most states, it has grown in the post–Great Recession era. From 2009 to 2015, the incomes of the top 1 percent grew faster than the incomes of the bottom 99 percent in 43 states and the District of Columbia.

(Infographics:  Economic Policy Institute; howmuch.net)

Connecticut Has Nation's Highest Average Student Loan Debt, Analysis Shows

The average student debt in Connecticut is higher than any state in the nation, according to a new analysis.  The latest annual report from The Institute for College Access & Success (TICAS), a nonprofit and nonpartisan organization focused on making higher education more affordable, looked at the Class of 2017 broken down by the state in which they graduated college. The average student debt in Connecticut was $38,510, just ahead of Pennsylvania ($36,854), Rhode Island ($36,250), New Hampshire ($34,415), Delaware ($34,144), New Jersey ($32,247) and Massachusetts ($32.065).  On the other end of the scale are Utah ($18,838), New Mexico ($21,237) and Nevada ($22.064).

As the data reflects, the highest student debt is in states located in the Northeast. There are only two states from the Deep South where average debt tops $30,000, Alabama and Mississippi, and none are from the West Coast. States in the West produce graduates with average debt burdens of only $19-25,000, substantially less.

Nationally, about two in three graduating seniors had student loans. Their average debt was $28,650, about 1 percent higher than the Class of 2016. New graduates’ likelihood of having debt varied from 38 percent (Utah) to 74 percent.  In Connecticut, it is 57 percent.

In all but 8 states, 50 percent or more graduates are saddled with debt of some amount. New Hampshire, South Dakota and West Virginia are tied for having the greatest percentage of indebted graduates (74%). Utah takes first place as the most affordable where only 38 percent of students leave owing student loans.

Between 1996 and 2012, federal data on bachelor’s degree recipients show that the average debt of borrowers increased steadily, according to the study, at an average of 4 percent per year. It has edged higher only slightly in recent years.

(Infographic by howmuch.)


Norwalk Joins Sustainable CT Effort

Norwalk is the latest Connecticut municipality to join Sustainable CT, a statewide initiative that offers detailed array of sustainability best practices, tools and resources, peer learning, and opportunities for recognition.The Sustainable CT platform supports a broad range of actions, such as improving watershed management, supporting arts and creative culture, reducing energy use and increasing renewable energy, implementing “complete streets” (streets that meet the needs of walkers and bikers as well as cars), improving recycling programs, assessing climate vulnerability, supporting local businesses, and providing efficient and diverse housing options.   “I am delighted the city has joined Sustainable CT in our latest efforts to develop and implement sustainability and renewable energy initiatives in Norwalk,” said Mayor Harry Rilling. “Being energy conscience is the right thing to do as we all have a moral obligation to lessen our environmental impact. I am glad the city has taken a leadership role and joined this important sustainability initiative.”  Norwalk’s Council approved the resolution to join Sustainable CT in mid-August and designated the Common Council Planning Committee as the “Sustainability Team” for the program. Norwalk was officially registered with Sustainable CT on August 24.

The Sustainable CT initiative was developed under the leadership of the Institute for Sustainable Energy at Eastern Connecticut State University in partnership with the Connecticut Conference of Municipalities.

There is no cost to participate and communities voluntarily select actions that meet their unique, local character and long-term vision. After successful implementation of a variety of actions, municipalities will be eligible for Sustainable CT certification. According to the organization’s vision statement, “Sustainable CT communities strive to be thriving, resilient, collaborative, and forward-looking. They build community and local economy. They equitably promote the health and well-being of current and future residents, and they respect the finite capacity of the natural environment.”

“We are thrilled that Norwalk has passed a resolution to join Sustainable CT. The program builds on many current success stories in our communities to create and support more great places to live, work, and play,” said Lynn Stoddard, Director of the Institute for Sustainable Energy. “We are looking forward to working with the city as they pursue Sustainable CT certification."

The town of Thomaston joined the initiative in July. Three Connecticut philanthropies - The Emily Hall Tremaine Foundation, the Hampshire Foundation, and the Common Sense Fund – have supported the program's development and launch.

New $1 Coin Series to Be Produced by U.S. Mint; CT’s Himes, Murphy Advocated for Innovation – and CT Company

American innovation is about to be highlighted by the U.S. Mint, but don’t expect to see the results in your loose change. The American Innovation $1 Coin Act will launch the newest numismatic coin program of the United States Mint later this year. The Mint will soon produce and sell $1 collector coins in recognition of American innovation and significant innovation and pioneering efforts of individuals or groups from each of the 50 States, the District of Columbia, and the five U.S. territories.  The new program – passed by Congress and signed into law this year - calls for the minting and issuance of non-circulating American Innovation $1 coins.

The legislation was initially proposed by U.S. Rep. Jim Himes of Connecticut’s 4th District, and in the Senate by Connecticut U.S. Sen. Chris Murphy.

The program’s duration is a 14-year period that begins January 1, 2019.  The coins are to be issued in the order in which the state or territory ratified the Constitution or were admitted to the Union. The law also authorizes a 2018 introductory coin which will be minted and issued in the latter part of this calendar year.

When the bill passed the House, Himes said: “This bill will support jobs and the industry around collectible coins, including here in Connecticut, all without costing taxpayers at all.” Murphy added: “Our country was built on innovation and entrepreneurship, and what better way to celebrate it than through a program that creates jobs and reduces the national debt.”

He noted that the proposed coin series would also support local jobs at Norwalk-based MBI Inc., one of the leading commemorative coin companies in the country.

The introductory coin will bear an obverse common to all coins in the program. It will consist of a likeness of the Statue of Liberty, and the inscriptions of “$1” and “In God We Trust.” The reverse of the introductory coin will be inscribed with “United States of America” and “American Innovators,” and it will include a representation of President George Washington’s signature on the first U.S. patent. The inscription of the year of minting or issuance, mint mark, and “E Pluribus Unum” will be edge-incused into all coins.

American Innovation $1 coins, to be issued at a rate of four new coins per year, will bear a reverse image or images emblematic of a significant innovation, an innovator, or a group of innovators from each of the 50 states, the District of Columbia, and the territories of the United States.  Published reports indicate that the $1 coins would sell for more than face value — up to $1.32 — providing a healthy profit for the federal government since the coins cost less than 35 cents to make.

“Americans tinkering in the shed, programming in the garage, and growing big ideas from humble roots have always had great impact on our economy and future,” added Himes. “We can honor them, inspire a new generation of entrepreneurs and scientists, and help the economy with this coin series.”

MBI markets a wide range of historic coinage, like rare silver dollars and foreign coins from antiquity, according to the company website.  The company also capitalizes on the newly minted designs in circulation, and has already begun marketing the new state innovation dollar series to collectors.  The coins offered by the company, through PCS Coins, would be “protectively encased” in custom-designed “collector panels” prepared for placement in albums.  The coins will also be available from numerous other sources, but will not be issued by the U.S. Mint for general circulation.

The company’s publicity suggests that the Connecticut coin would include a back design honoring the state’s contribution to American Sign Language, but it is unclear if that decision has yet been made.  The company’s coin designs are shown on marketing materials “for illustrative purposes only.”

According to the legislation, the Secretary of the Treasury will select the designs after consultation with each Governor or other chief executive and the U.S. Commission of Fine Arts; and review by the Citizens Coinage Advisory Committee.

Congress created the United States Mint in 1792, and the Mint became part of the Department of the Treasury in 1873. As the Nation’s sole manufacturer of legal tender coinage, the Mint is responsible for producing circulating coinage for the Nation to conduct its trade and commerce. The Mint also produces numismatic products, including proof, uncirculated, and commemorative coins; Congressional Gold Medals; silver and bronze medals; and silver and gold bullion coins. Its numismatic programs are self-sustaining and operate at no cost to taxpayers, according to the Mint.

Bridgeport, New Haven Among Nation's 50 Most Stressful Cities, Analysis Says

Stress?  Look no further than Bridgeport and New Haven.  Both cities were ranked in the top 50 Most Stressed Cities in America, a new ranking produced by the financial website WalletHub. Bridgeport ranked 33rd and New Haven 41st, based on analysis that considered stress in four areas:  the workplace, finances, family, and health and safety as contributing factors.

The most stressed cities in America, according to the analysis, were Detroit, Newark, Cleveland, Birmingham, Toledo, Baltimore, Wilmington, Milwaukee Gulfport and St. Louis.  Among New England cities, Bridgeport led the list, followed by Worcester (37), New Haven, Boston (52), and Providence (57). 

Bridgeport ranked 17th in the workplace stress category and 23rd in financial stress; 103rd in family-related stress. Bridgeport also had among the lowest average weekly work hours, tied for 176th among the 182 cities included in the rankings.  New Haven ranked 168th in that category.

New Haven was 37th in health and safety related stress; in the mid-50’s in the other categories.

WalletHub evaluated the 150 most populated U.S. cities, plus at least two of the most populated cities in each state, using the four dimensions including 37 relevant metrics.  Those metrics included job security, traffic congestion, unemployment rate, average commute time and income growth in the work stress category.  Financial stress included evaluation of annual household income, foreclosure rate, food insecurity, housing affordability and debt per median earnings.

The family stress category included the separation and divorce rate, number of single parent households, child care costs and other factors.  The ten factors considered as part of the Health & Safety stress category included mental health, smoking, obesity, inadequate sleep, crime rate and hate-crime incidents.

Greensboro, North Carolina, residents spend the fewest annual hours in traffic congestion per auto commuter, 4, which is 25.5 times fewer than in Los Angeles, the city where residents spend the most at 102, according to the data.  Bridgeport and New Haven tied for 36th in the traffic congestion rankings.

Data used to create this ranking were collected from the U.S. Census Bureau, Bureau of Labor Statistics, INRIX, Chmura Economics & Analytics, Indeed, Federal Deposit Insurance Corporation, Renwood RealtyTrac, County Health Ranking, Zillow, Administrative Office of the United States Courts, TransUnion, Department of Housing and Urban Development, Council for Community and Economic Research, Gallup-Healthways, Numbeo, Centers for Disease Control and Prevention, Federal Bureau of Investigation and Sharecare.

K-12 School District Regionalization May Do More Harm Than Good, Analysis Reveals

“Generalizations about regionalization oversimplify a complex topic,” according to a new report on K-12 School District Regionalization in Greater Hartford, which warns that “K-12 regionalization can actually increase costs and harm educational outcomes.” As some school districts in Connecticut have been considering regionalizing their K-12 education services as a way to reduce costs, the 23-page report prepared for the Hartford Foundation for Public Giving raises some red flags, noting that “policies that call for wholesale regionalization based on imposed criteria (e.g., minimum/maximum number of students) can have unpredictable, and often adverse, consequences.”

In an effort to get a clearer understanding of the potential educational and community impacts of school and district regionalization, the Hartford Foundation for Public Giving sponsored the comprehensive analysis to help inform those efforts gathering data on what is known about the effects of K-12 regionalization on education expenditures and educational achievement, based on recent empirical studies.

“The Hartford Foundation is committed to the availability of high-quality, impartial research,” said Scott Gaul, the Hartford Foundation’s Director of Research and Evaluation. “As policymakers continue to consider strategies to reduce the costs of government, the issue of regionalizing services continues to draw attention. This research is intended to provide a clearer picture on the potential benefits and challenges of regionalizing school districts in an effort to support a shared understanding and to support informed decision-making.”

K-12 regionalization generally includes combining school districts, boards of education, and central office staff. This can result in closing schools, eliminating teaching positions, reducing administrative staff, and increasing student-to-teacher ratios, among other consequences, according to the report.  Connecticut, like other New England states, relies mainly on municipalities to provide government services, including K-12 education, to its residents.  In 2017, there were 196 public school districts including town districts, charter school districts, regional districts, and regional education service center districts.

The review of the research, conducted by Connecticut-based Rodriguez Data Solutions, points out that policymakers often promote K-12 regionalization as a way to achieve cost savings, but often fail to consider the consequences for student educational achievement. The report reviewed initiatives to promote K-12 regionalization in several states including Connecticut, Maine, New York and Vermont.  Among the findings:

  • While there is no definitive answer on optimum school size, research on Connecticut suggests that a district with 2,500 to 3,000 students may be both cost-effective and foster educational achievement. This roughly matches the range suggested in research from other locations. In at-risk communities, research suggests that elementary school enrollment should not exceed 300 students, and high school enrollment should not exceed 500.
  • In rural communities, closing a town’s school can cause the social fabric of a community to unravel. Research also suggests that “impoverished regions often benefit from smaller schools and districts and they can suffer irreversible damage if consolidation occurs.”
  • The literature review suggests that deconsolidation of large school districts be considered as an option for cost savings.  In Connecticut, it is estimated that the total savings from the 129 smallest school districts would match the combined equivalent per-pupil savings from the three largest school districts.  Consequently, a significant reduction in statewide education costs requires reducing per-pupil spending in urban areas, not just in small rural districts.

Researchers found that “regionalization may lead to diseconomies of scale resulting from: higher transportation expenses because of longer bus routes, overall increases (leveling up) in staff salaries because of seniority and/or contract renegotiation, and increases in the number of mid-level administrators and administrative support staff.”

Warning of the perils of large, consolidated schools, the report also included the finding that “Students who are involved in extracurricular activities (e.g., band, sports, clubs) have higher graduation rates and it is widely accepted that participation in extracurricular activities decreases as enrollment increases.”

The report also provides a cautionary tale regarding demographics and the impact of school closing decisions:  “While it seems apparent that the closing of school buildings will reduce costs, savings are limited because there may not be buyers, and the facilities still must be maintained by the school district. In already struggling neighborhoods, these now empty school buildings (with boarded windows)

contribute to a downward economic spiral by attracting scavenging, dumping, drug users, and graffiti. The neighborhood children who previously attended the now closed school are then exposed to an increase in crime resulting from the blighted property.”

“Connecticut’s Black and Hispanic children,” the report adds, “are already disproportionately overexposed to crime in their neighborhoods.”

In addition, the report explains, “Students from advantaged (i.e., high socioeconomic status) households have similar educational achievement in both small and large schools. However, the situation is much different for students from low-income communities for whom “… smaller [school] size mediates the association between

socioeconomic status and achievement.” The potential for high educational achievement diminishes for at-risk students when they attend large schools that are disconnected from their communities.”

The report also included an update on the state’s student population.  From 2010-2011 to 2016-2017, the state’s public school enrollment dropped by 25,606 students – a decline in enrollment of 4.5 percent. The analysis found that “most Connecticut school districts have declining enrollments and it is more prevalent in rural areas.”

The report also cited a survey of Vermont voters, who expressed preferences for saving money and maintaining local control of local schools. “Vermont voters had not grasped that saving money may inherently include loss of local control,” the report indicated, concluding that “Vermont voters had conflicting goals, which could also be expected from Connecticut voters.”

Fiscal Commission’s Work is Done (Technically), But Members Aren’t Going Away

They may be disbanded, but they’re sticking together – driven by a belief that the state’s future hangs in the balance. The Connecticut Commission on Fiscal Stability and Economic Growth, a panel of primarily state business leaders appointed by the state legislature and Governor last year to help the state grapple with its ongoing fiscal challenges, went out of existence on March 1 when they issued a comprehensive 119-page report following three months of public hearings and deliberations. 

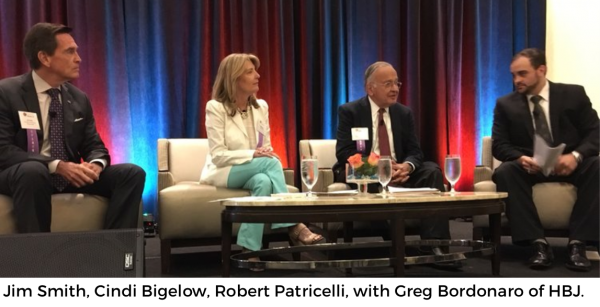
Nonetheless, the 14 members, mostly prominent business leaders, continue to seek opportunities to discuss their recommendations in public forums, regularly advocate for substantial changes in the management of state fiscal affairs, have begun meeting with gubernatorial candidates, and are urging business leaders across the state to keep up the pressure on state elected officials to take comprehensive action consistent with their wide-ranging recommendations.

“We committed to see it through,” said Commission co-chair Jim Smith, Chairman and former CEO of Webster Bank. “We knew it wouldn’t be one (legislative session) and done.  This is about policy, not politics.  We’ve all checked our politics at the door.  This is about the greater good, and how we change the course of Connecticut’s future.”

With all 187 legislative seats and the six state’s statewide constitutional offices – including Governor - up for election this November, the Commission co-chairs believe Connecticut’s best opportunity for much-needed systemic structural changes will be in the next legislative session, which begins in January. They intend to “actively engage” throughout this election season and in next year’s legislative session, and have already met with about half of the current field of gubernatorial candidates.

Smith and Robert Patricelli, former CEO & Founder of Women's Health USA, who co-chaired the panel, were featured along with Commission member Cindi Bigelow, CEO of Bigelow Tea, at an event coordinated by the Hartford Business Journal last week. It was one of nearly 100 forums, discussions and one-on-one meetings that the co-chairs and other commission members have had since their findings and recommendations were issued.

The Commission uses the analogy of a “burning platform” to describe the current budgetary process, fiscal structure and economic status of the state, a frame of reference that reflects the public’s concern about the state’s precarious standing.  Smith said he is encouraged by the response they’re receiving.

“When we talk about the platform burning, people are riveted.  They’re anxious to hear solutions,” Smith explains, noting that the approaches proposed by the Commission are resonating with audiences because they provide a comprehensive – if challenging – path to douse the flames and stimulate economic growth, achieve sustainable budgets long-term, and re-establish the state’s competitiveness.

“Our findings are irrefutable, inescapable and require action,” Smith told CT by the Numbers.  “That comes across loud and clear.”

The Commission leaders are committed to generating a spirited public conversation about their findings and recommendations.  They told an attentive audience in Hartford last week that the 14 members remain in communication, and have now been working longer since they ceased to exist as a Commission than during the 76 days that they were officially constituted by law.  And they have no plans to walk away from the work they began.

In underscoring their commitment to remain involved beyond the life of the Commission, the co-chairs have evoked the memorable phrase from the 1976 movie Network – they’re mad as hell and they’re not going to take this anymore.  In fact, their goal remains to do something about it.  Pursuing a public conversation and meeting privately with leading gubernatorial candidates are parts of the strategy.

Smith indicates that as the Commission’s work unfolded, members were concerned that the “platform was even hotter than we knew,” but encouraged that creation of the Commission reflected a willingness to involve the private sector in charting the path forward.

Patricelli, in fact, has floated the idea of having 500 businesses to sign a letter to the state’s elected officials urging action on the Commission’s recommendations, which include changes in spending, tax policy, investments, infrastructure, transportation and competitiveness. Only with sustained pressure, he argues, will the incoming legislature and Governor take action.  They point to the sustained drop in Connecticut’s Gross State Product (9.1% over the past decade), while the state’s New England and Tri-State neighbors saw growth, as among the numerous factors that led to their conclusion that substantial changes are needed in the state’s fiscal policies.

The co-chairs say it is understandable that more was not done with the Commission’s recommendations during the short 2018 legislative session, largely because an election was just around the corner.  Instead, the legislature opted to have the Office of Policy and Management (OPM) coordinate two studies, soon to get underway.  One would look at the Commission’s recommendations that involve “rebalancing of state taxes to better stimulate economic growth without raising net new taxes”; the other would conduct a study of the proposal for reform of the Teachers' Retirement System.

The legislature also voted to have OPM issue a request for proposals to hire a national consultant to study and make recommendations regarding efficiency improvements in revenue collection and agency expense management that will result in a savings of at least 500 million dollars.

Each is a potential step forward, but not nearly enough, the co-chairs have indicated since the session ended on May 9. Some aspects of the Commission’s work is evident in those actions, and the timing of those efforts, to be ready in January as newly elected officials take office, may provide pieces to build on.

Patricelli has also suggested that the state’s part-time legislature is not up to the task of governing a 21st century state, by its very nature.  The legislature is in session for 5 months in even-numbered years and 3 months in odd-numbered years, in accordance with the state constitution.  That’s just not enough, he says, suggesting that a comprehensive study be done on the legislative systems in other states to determine what might be best for Connecticut.

In addition to Smith, Patricelli, and Bigelow, Commission members were Pat Widlitz (Vice-Chair), former state representative from Guilford and Co-Chair of the General Assembly’s Joint Committee on Finance, Revenue and Bonding; Jim Loree, President and CEO of Stanley Black & Decker; Chris Swift, Chairman and CEO of The Hartford; Bruce Alexander, Vice President of State Affairs and Campus Development at Yale University; Greg Butler, Executive Vice President and General Counsel of Eversource Energy; Roxanne Coady, Founder and CEO of R.J. Julia Booksellers; David Jimenez, Partner at Jackson & Lewis and a member of the state Board of Regents for Higher Education; Paul Mounds, Vice President for policy at the Connecticut Health Foundation; Frank Alvarado, Veterans Affairs Officer, Small Business Administration; Eneas Freyre, New York Life and Michael Barbaro, President, Connecticut Realtors.