Disparities Evident As Fairfield County Considers Its Community Wellbeing
/Fairfield County’s sizeable immigrant population - twenty percent of Connecticut’s most populous county - grew 89 percent from 1990 to 2014. In some municipalities, foreign-born residents make up as much as a third of the population.
That is among the findings in the Fairfield County Community Wellbeing Index 2016, which examined regional demographics, economic opportunity, education, health, quality of life, and happiness. The report includes analysis of the communities, populations, and neighborhoods of Fairfield County, as well as opportunities available and issues facing the area.
Since 1980, the size of the population living in neighborhoods that are considered most affluent – defined as those with an average family income more than 2.5 times higher than the state level - has tripled within Fairfield County. Meanwhile, the number of people living in poor neighborhoods is 3.5 times its 1980 size. The number of people in middle-income neighborhoods has decreased by sixteen percent.
Fairfield County’s Community Foundation, a major funder of the report, partnered with DataHaven, area hospitals, and government agencies to help launch a more robust and comprehensive resource that could serve as a part of the hospitals’ and health departments’ Community Health Needs Assessments as well as a broader county-wide indicators program.
“Fairfield County’s Community Foundation is committed to addressing the most pressing issues facing Fairfield County, but to do that we first need to be able to identify and understand those issues,” stated Nancy M. von Euler, Vice President, Programs, Fairfield County’s Community Foundation. “The data in the Fairfield County Community Wellbeing Index 2016 will help us to develop priorities for collective action to build a stronger, healthier Fairfield County where everyone has the opportunity to thrive, regardless of their zip code.”
The report states that "Despite its overall affluence, Fairfield County is among the nation’s most unequal metropolitan areas. Inequities in well-being appear when evidence is stratified by income, age, race, gender, and zip code. These differences are often most apparent after considering data that were collected specifically for the age groups and neighborhoods that are most impacted."
Among the findings, between 2014 and 2025, adults ages 65 and over are Fairfield County’s only age group projected to grow significantly, with a thirty-seven percent increase. Disparities in the County were also evident:
- High and rising childcare costs are often prohibitively expensive for low and middle-income families. While Fairfield County has nearly enough spaces for all 3- to 4-year-olds to attend preschool, there are only enough regulate
 d childcare slots for fifteen percent of the county’s children ages 0 to 2, and enough subsidized slots to cover only twenty-two percent of these youngest children in low-income households.
- The issue of dental care arose as an indicator of well-being, particularly among younger adults and families. The Index shows that for every 10,000 residents living in Fairfield County, 12 residents visit an emergency room to receive treatment for preventable dental conditions in any given year, whereas on the East Side of Bridgeport, 178 residents do.
- Fairfield County residents are healthy when compared to national benchmarks. However, many conditions and risk factors—such as asthma, food insecurity, exposure to community violence, and the early onset of diabetes—are disproportionately prevalent in lower-income neighborhoods and communities of color. Sections of Bridgeport in particular fall very far behind the surrounding area in many of these measures.
- Disparities in access to reliable transportation persist between racial and income groups. A majority of Fairfield County workers, regardless of income, commute to another town for work. Many low-income (annual wages under $40,000) workers leave Bridgeport for work, while large shares of high-income workers commute to New York City.
“The process of developing this report allowed local partners and community members to identify links between the well-being of residents and the places where they live. Looking beyond typical measures like income levels or unemployment rates, the Community Wellbeing Index reveals a much more uneven distribution of opportunities in areas such as neighborhood walkability, economic development, public health, and education,” said Mark Abraham, Executive Director of DataHaven and a lead author of the report. “The impact that these barriers to opportunity have on overall well-being and happiness will serve as a call to action for many groups working to improve Fairfield County’s diverse neighborhoods and towns.”
The Fairfield County Community Wellbeing Index 2016 was based on a variety of federal and statewide data sources. Partners of DataHaven’s Fairfield County Community Wellbeing Index 2016 include Fairfield County’s Community Foundation; Bridgeport Hospital; Danbury Hospital; Greenwich Hospital; Norwalk Hospital; St. Vincent’s Medical Center; and Stamford Hospital.

 ped the list in two additional categories: Lowest Percentage of Adults Who Experienced Pain in the Past Year Due to Oral Condition and Lowest Sugar-Sweetened Beverage Consumption Among Adolescents. The state also ranked in a tie for third for having the lowest percentage of elderly population with no natural teeth.
 The Connecticut Health Policy Project is a non-profit, non-partisan research and educational organization dedicated to improving access to affordable, quality health care for all Connecticut residents.
 “Unlike mental health consultation,” the report states, “overall health consultation is not supported with state level infrastructure and payments for health consultants to early Childhood Education sites. For private child care or preschool programs, the cost to hire a health consultant is borne by the program, with no system in place to ensure the quality of the CCHC workforce or ensure that health consultation is implemented to maximize the health and safety of children in child care.”

 The researchers say it’s important to look at the context in which foods are presented as well as the frequency, observing that the people they interviewed rarely noticed that food was mentioned in children’s books, nor what messages were being conveyed, UConn Today reported.
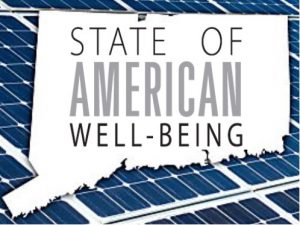 In 2016, Connecticut had a Well-Being Index score of 61.7, which is lower than the national Well-Being Index score of 62.1. The report, which is part of the Gallup-Healthways State of American Well-Being series, examines well-being across the nation, including how well-being varies by state and which states lead and lag across the five elements of well-being. They are:
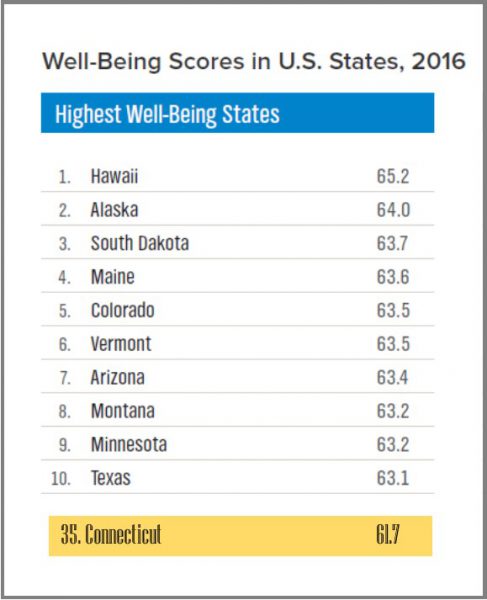

 The findings of a state review would be reported to the legislature and governor to evaluate the appropriateness of the price increases in question.
 The report, “Broken Promises to our Children: A State-by-State Look at the 1998 State Tobacco Settlement 17 Years Later," said the state was spending $1.2 million in FY 2016 to fight tobacco use. That's compared to an estimated marketing investment of $80.4 million by tobacco companies in Connecticut that year. The national average shows a margin of 20.1 to 1. At that time, Connecticut ranked 38th in spending on a percentage basis. The state has consistently spend