Good News, Bad News in State Health-Related Data, Analysis Finds

Connecticut is 11th best among states in the number of people who had no trouble finding a doctor in 2015, according to State Health Compare. The top 10 states were Minnesota, Kansas, Vermont, Utah, North Dakota, Montana, Maine, Nebraska, Hawaii and Tennessee.  That's the good news. But Connecticut is also 17th worst among states in the percent of residents with high medical cost burdens, at 23.1 percent. Utah has the highest percentage at 27.5 percent; Maryland the lowest at 15.3 percent, among the 50 states.

According to the data, 70.7 percent of state residents had a general doctor or provider visit during the year, a lower percentage than the national average of 73 percent, and ranking the state 38th in the nation.  The data also reveal that Connecticut is 19th lowest among states in the percent of state budget devoted to Medicaid, and 28th lowest in state public health spending per person.

Nearly one in ten Connecticut residents (9.1 percent) spent the night in a hospital during the year, 15th highest in the nation.

Created by SHADAC, State Health Compare is a new online comparison tool with state-level estimates across 46 measures of health and health care from six federal agency sources. SHADAC is a multidisciplinary health policy research center with a focus on state health policy, supported by the Robert Wood Johnson Foundation and affiliated with the Health Policy and Management Division of the School of Public Health at the University of Minnesota.

Categories in the database include health insurance coverage, cost of care, health behaviors, outcomes, access, utilization, quality of care, public health, and social and economic factors. Metrics include costs of potentially preventable hospitalizations, percent of residents who needed but did not get care due to cost, chronic disease prevalence, weight assessment in schools, and adult cancer screening rates.

Data for most measures is available for multiple years, allowing trend analysis. Within most of the 46 measures, the tool allows visitors to dive deeper into the data by subpopulations such as by age, race/ethnicity, and education level. The tool provides a map, state rank and trend display for each metric. The data can be downloaded and exported.

The data was recently featured in CT Health Notes, a biweekly informational newsletter of the Connecticut Health Policy Project. It includes research summaries, news, event notices, policy proposals and other issues important to Connecticut’s health policy.

Motorcycle Deaths in CT Projected to Remain Steady This Year and Next

The state Department of Transportation expects 47 motorcyclists to die in traffic accidents in this year and next.  According to a Department of Transportation report for Fiscal 2017, there was a fluctuating number of motorcyclist fatalities from 2010 to 2014, with a low of 37 in 2011 and a high of 57 in 2013.  Those numbers are expected to remain constant, department projections indicate. The report said the majority of motorcycle fatal and injury crashes occurred between the hours of noon and 8 p.m. and the crashes most commonly happened on Saturdays and Sundays.  Most fatal and injury crashes occurred in the summer months, and almost all motorcycle operators involved in crashes were male.

Cited most often as contributing factors were “driver lost control,” “driving too fast for conditions,” and “road condition/object in road.” In multiple vehicle crashes where the other driver was at fault, the major contributing factor in 47 percent of these crashes was failure to grant the right-of-way, the DOT report indicated. May is Motorcycle Safety Awareness Month.

Earlier this month, a Meriden man died in a motorcycle accident and another rider was injured in East Haven, and last week a Manchester man was seriously injured in a motorcycle crash in Manchester and an East Hartford man was killed in rural Washington.  Motorcycle accidents in April in Stonington, Coventry, and Middletown injured riders.  Earlier this year, state legislators discussed a bill proposing to reinstate Connecticut's motorcycle helmet law, which was repealed four decades ago. Currently, the law only requires riders under age 18 to wear helmets. That law was approved in 1989.  For adults driving or riding as a passenger, helmets are optional, as they have been since 1976.  After the February 10 public hearing, the bill has not moved forward.

Only about 42 percent of motorcyclists in Connecticut wear helmets, according to Neil Chaudhary, PhD, leader of a Trumbull team of premier investigators on behavioral traffic safety-related issues at Preusser Research Group, Inc.  In states where helmets are required, there is near 100 percent compliance, he recently told the Newtown Bee, adding professional driver training, offered throughout the state, can help riders to develop stronger defensive driving skills.

The Connecticut Transportation Safety Research Center reports the estimated loss to the state from motorcycle related injuries and death is $400 million. The group says helmet use reduced the risk of death by 37% and head injuries by 69%, FOX61 reported.

“Ultimately a motorcycle is more vulnerable because there is no protection like you have in a passenger vehicle. The only protection you have is what you put on yourself,” Dr Chaudhary told the local newspaper.

State Police set a goal in the report to train 5,000 motorcycle operators of all skill levels this year in an effort to reduce the number of deaths and injuries by reducing “operator error.”  The effort includes adopting a newly updated curriculum developed by the Motorcycle Safety Foundation for Department of Transportation's Connecticut Rider Education Program (CONREP). This new curriculum, according to the report, “will have a larger focus on rider responsibility and risk awareness.”  In addition, there will be a targeted media campaign, including promoting helmet use by all riders (not just those young riders currently covered under existing law), and “including motorcyclists in the planned emphasis on reducing impaired driving.”  The CONREP website, ride4ever.org provides updated information on education programs. 

The National Highway Transportation Safety Administration (NHTSA) reports that about 5,000 motorcycle operators and hundreds of motorcycle passengers lose their lives in accidents each year in the United States. These numbers account for about 13 percent of total traffic fatalities, even though motorcycles account for just three percent of all registered vehicles, the Newtown Bee reported.  In addition to the fatalities, about 100,000 operators and passengers are injured each year.

Immigration Is Key to Connecticut's Economic Strength, Report Shows

By 2014, Connecticut was home to almost half a million people who were born abroad.  In Connecticut, like the country as a whole, immigrants are currently punching far above their weight class as entrepreneurs, according to a report issued last year highlighting the impact of immigrants in the state. Foreign-born workers make up 21.3 percent of all entrepreneurs in the state, despite accounting for 13.7 percent of Connecticut’s population. Their firms generated $1.1 billion in business income in 2014, according to the report.

The report, “The Contributions of New Americans in Connecticut,” was prepared by the Partnership for a New American Economy, an organization that “brings together more than 500 Republican, Democratic and Independent mayors and business leaders who support sensible immigration reforms that will help create jobs for Americans.”

Immigrants are nothing new in Connecticut.  Even the Land of Steady Habits keeps changing.  In 1990, the state was already home to more than 279,000 immigrants, a group that made up 8.5 percent of Connecticut’s population overall. By 2010, the number of immigrants in this small state had grown to almost 473,000 people. By 2014, Connecticut was home to almost half a million people who were born abroad.

The report research also found:

  • Of the 18 Fortune 500 firms based in the state, 50 percent have at least one founder who was an immigrant or the child of an immigrant. For the country as a whole, the equivalent figure is 41.4 percent.
  • In Connecticut immigrants held $13.8 billion in spending power in 2014, defined in this brief as the net income available to a family after paying federal, state, and local taxes.
  • In Connecticut 69.8 percent of the foreign-born population is working aged, defined in the report as between the ages 25 and 64, while only 50.8 percent of the native-born population is. That 19 percentage point gap has major implications for the state’s workforce.
  • Foreign-born residents makeup more than one in three employees in the state’s computer systems design and related services industry. They also account for 32.2 percent of the state’s workers in medical equipment and supplies, contributing to Connecticut’s sizeable medical devices and supplies manufacturing industry, which generated more than $2.1 billion in sales in 2012.
  • Despite making up 13.7 percent of the state’s population, foreign-born Connecticut residents made up 23.8 percent of STEM workers in the state in 2014.

Research for the report also found that in 2016 nearly one in three physicians in Connecticut graduated from a foreign medical school, “a likely sign they were born elsewhere.”  Only six other U.S. states had a higher share of foreign-educated physicians. Immigrant healthcare practitioners also made up 15.3 percent of the state’s nurses in 2014, as well as 29.5 percent of those working as nursing, psychiatric, or home health aides. Both those figures were higher than the national average.

Five Connecticuts: Disparities Persist, Continue to Adversely Impact State's Children

Connecticut is among the wealthiest states in the country, and aggregated statewide economic, health, and education indicators suggest that children and families fare better here than in much of the United States. According to a new report developed by the Connecticut Association of Human Services, the reality on the ground is not what it appears to be. “Race Equity in the Five Connecticuts:  A Kids Count Special Report,” found that Blacks’ and Hispanics’ poverty rates are lower in Connecticut than nationally, and Blacks’ median incomes are higher. However, “as we have seen when looking within communities, historic patterns of inequality observed nationally do indeed persist here.”

The report indicates that as is the case nationally, Blacks and Hispanics in Connecticut are “disproportionately impoverished, and have the highest rates of negative outcomes for most of our indicators. Merely being a resident of one of the most affluent states in the U.S. is not a sufficient buffer against the intransigent inequality that affects our children and families along racial and ethnic lines,” the report explains.

"Not all children in our wealthy state are doing well," summed up Jim Horan, Chief Executive Officer of the Connecticut Association of Human Services, in releasing the report at a State Capitol complex conference. "All children, regardless of the color of their skin or their zip code, should have the opportunity to succeed. Connecticut can do much more to provide opportunity for all and address the huge inequities we see today, so that all children will prosper and contribute to and share in Connecticut’s growth," he said in the report's Foreword.

“Five Connecticut’s” refers to a breakdown developed by the Connecticut Data Center based upon each town’s median income, population density, and population below 100% of the poverty threshold (Levy, et al, 2004).

  • Wealthy Connecticut towns have “exceptionally high-income, low poverty, and moderate population density.”
  • Suburban towns have “above average income, low poverty, and moderate population density.”
  • Rural towns are those with “average income, below average poverty, and the lowest population density.”
  • Urban Periphery towns are marked by “below average income, average poverty, and high population density.”
  • Urban Core towns have “the lowest income, highest poverty, and the highest population density.”

The report used data from communities representing each of the five Connecticuts:  Wealthy (New Canaan, W3ilton, Weston, Easton, Fairfield); Urban Periphery (East Hartford and Manchester); Urban core (Hartford); Suburban (Branford, East haven, North Branford, Guilford and Madison); and Rural (Ashford, Brooklyn, Canterbury, Chaplin, Eastford, Hampton, Killingly, Plainfield, Pomfret, Putnam, Scotland, Sterling, Thompson, Woodstock, and Windham).

“Blacks are more segregated in Connecticut than in Arkansas and Hispanics are more segregated than in Texas,” pointed out Orlando Rodriquez, research associate at the UConn Health Disparities Institute, speaking at a forum on the report at the Legislative Office Building, noting that Connecticut is among the nation’s most segregated states.

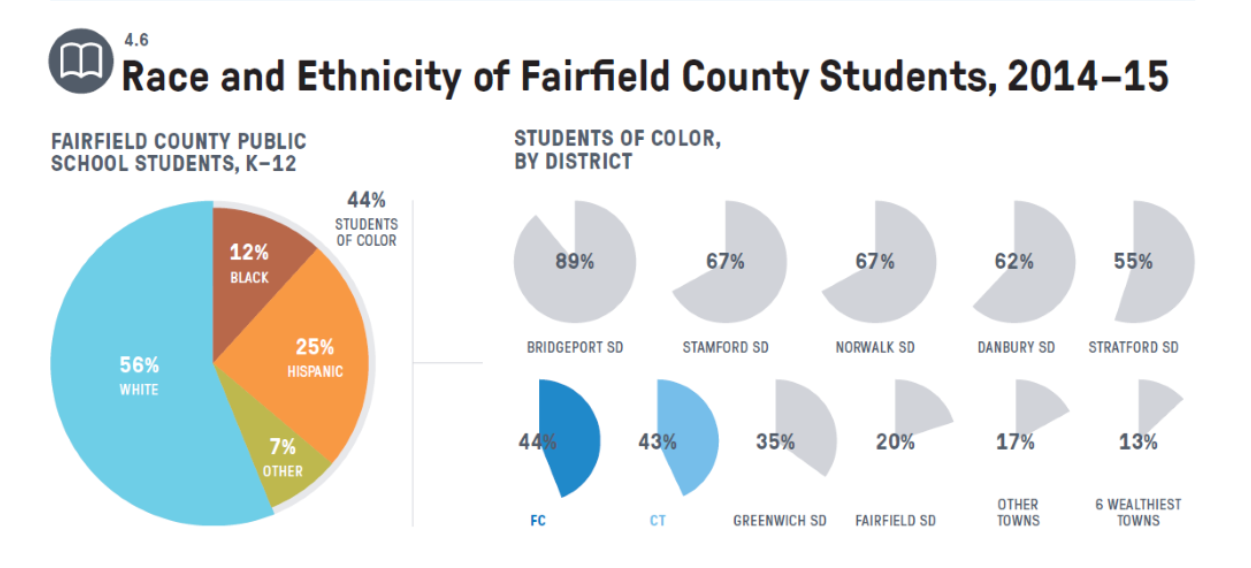
Demographically, Connecticut, like the nation, is becoming more racially and ethnically diverse. It is estimated that by 2055, America will not have a single racial or ethnic majority.  From 2000 to 2015, as the total population grew by 5%, Connecticut’s Black, Hispanic, Asian, and Native American populations combined grew by 42.3%. In 2000, Connecticut’s population was 22.5% Non-White; in 2015, it was 30.8%.

The research also found that “place can correlate somewhat with the degree of the differences observed across these indicators, with outcomes either ameliorated or exacerbated depending on one’s ‘Connecticut’ of residence.”

The general trend, the analysis indicated, “is that White and Asian children and families experience positive outcomes, while their Hispanic and Black counterparts are almost invariably worse off. Even in those areas where Hispanic and Black households have relatively higher median incomes, they often still have worse outcomes than White and Asian households for many non-economic indicators.”

“Place remains tightly intertwined with opportunity, compounding the effects we observe along racial lines,” the report indicated.

“While more affluent suburban towns offer safer neighborhoods and greater social and economic opportunity to residents,67 these neighborhoods and towns tend to have less affordable housing and perhaps less economic opportunity for employees of limited credentials. Finances tie less affluent families to areas of low opportunity, contributing to a cycle of poor outcomes.”

Officials said the report is intended to be the beginning of a “more nuanced and continuous conversation about the role of place in social and economic equity in the State of Connecticut,” to assist in the development of “policies that work earnestly to close the racial and ethnic gaps among our families and children.”

In 2000, Connecticut’s population totaled 3,405,565, with 2,638,845 non-Hispanic Whites, 309,843 Blacks, 320,323 Hispanics, 9,639 Native Americans, and 82,313 Asians. In 2015, the estimated total population was 3,593,222, with 2,478,119 non-Hispanic Whites, 346,206 non-Hispanic Blacks, 526,508 Hispanics, 8,908 Native Americans of any ethnicity, and 149,368 non-Hispanic Asians.

Minorities, Children with Autism at Greater Risk of Drowning; Legislative Response Launched

“I understand all too well the dangers that water can represent,” said Karen Cohn, founder of the Zac Foundation, pointing out that drowning is the second leading cause of death for children under age 14.  “Many of these deaths could have been prevented.” Cohn’s 6-year-old son drowned in 2007 after his arm became stuck in the suction of the drain in their backyard pool.  Although he was a strong swimmer, “swimming skills are not enough to combat an entrapment,” she said.  The foundation named for her son is dedicated to educating parents about water safety, which goes beyond swimming skills.  The ZAC Foundation held its first water safety awareness camp, called ZAC Camp in Greenwich in April 2011. “We can save lives,” Cohn stressed.

Cohn was among advocates and legislators who held a State Capitol news conference to announce the creation of a legislative task force to bring awareness to the issue of childhood drownings.  Steven Hernández,, Executive Director of the Commission on Women, Children and Seniors, said the goal of the effort was “to prevent tragedies like these,” adding that “we need a multi-pronged response to a multi-pronged problem.”

The initiative was launched during National Water Safety Month, held each year in May, driven by statistics including:

  • Almost 800 children die the U.S. every year from accidental drowning;
  • 54% of these deaths are among children ages 0-4;
  • African-American and Latino children are more than twice as likely to die from drowning, compared to Caucasian children; and
  • According to the National Autism Association, accidental drowning led to 90% of the deaths of children with autism ages 14 and younger.

The statistics about children’s drowning deaths have not changed over time, implying that current strategies for prevention are not enough, officials said. Increasing children’s access to swim lessons, encouraging schools to teach water safety skills to students and giving parents easy-to-use and engaging tools to talk to their children about how to be safe around water are just a few actions that can have a big effect in reducing drowning rates, officials stressed.

An issue brief on the subject, prepared by Jennifer L. Masone of the Institute for Educational Leaders, and Principal, Wolfpit Elementary School in Norwalk, indicated that “from 2004-2014, 62 children from birth to 19 died from unintentional drowning. Of those, 35% were white and 34% were minority while the general population averaged 75% white and 25% minority. These data do not include children who experienced other short or long term effects.

The State Department of Public Health corroborates this information with its summation that for 2000-2004, “The Non-Hispanic Black population experienced a drowning rate twice that of the Non-Hispanic White population, and 33% higher than the Hispanic population.”

Senate Majority Leader Bob Duff said the issue needs to be “seen as a community solution through education.”   He said “this is an issue we can solve,” saluting the effort to bring interested parties together to work collectively.

In addition to establishing the task force, proponents of the initiative highlighted their support for HB 6260, which would require police officers to be trained to handle incidents involving juveniles with autism.  The measure has passed the House and is awaiting Senate action. Rep. Liz Linehan, who introduced that bill, said, “Children with autism are at an increased risk of drowning because they have a tendency to wander away from adult supervision and to seek out bodies of water.”

Rep. Cathy Abercrombie said “accidental drownings in Connecticut are a serious problem that deserves our full attention and one thing we can stress is the need for more education for parents and people overseeing children, especially now as we approach summer.”


https://youtu.be/CULPxBSa_10

https://youtu.be/hkmY3oZWxyU

Fun in CT? Ranked 37th in the US, But Among Leaders in Marinas, Fitness Centers, Money Spent on Recreation

While Connecticut ranked 37th overall among the nation’s 50 states analyzed for their “fun” quotient, the state did have some standout rankings in specific categories – including the amount of money individual residents spend on recreation.  Despite ranking 35th overall in “entertainment & recreation” categories and 40th in “nightlife,” the state reached the top five in three sub-categories. In the analysis by the financial website WalletHub, Connecticut ranked third in the number of fitness centers per capita, at 15.7. New England neighbor Massachusetts ranked #1 with 17, and New Hampshire, New Jersey and Montana rounded out the top five in that category.

Connecticut ranked #1 in number of marinas per capita, tied with Maine and Rhode Island. Connecticut has 3.48 marinas per 100,000 residents, the data indicated. Maryland and Vermont ranked fourth and fifth, respectively.

In another top five finish, Connecticut ranked fourth in Personal Expenditures on Recreation per capita, at just over $1,900. Minnesota ranked first at $2,058. The Top 5 states, in order, were Minnesota, Massachusetts, Colorado, Connecticut and New Hampshire.

Overall, the “most fun states” were Nevada, South Dakota, Colorado, North Dakota, New York, Wyoming, Oregon, Louisiana, Montana, Hawaii, Maine, Minnesota, Florida, Vermont and California.  At the bottom of the list were Arkansas, Kentucky, Alabama, West Virginia and Mississippi.

The overall rankings were weighted 80-20 between Entertainment & Recreation and Nightlife.  The Entertainment & Recreation categories included restaurants, beaches, movie theaters,  national parks, arts venues, and state spending on parks and recreation. The nightlife category included average beer & wine prices, movie costs, music festivals and access to bars.

Data used to create the ranking, which included 22 separate sub-categories, were collected from U.S. Census Bureau, Bureau of Economic Analysis, National Park Service, Council for Community and Economic Research, TripAdvisor, Beachapedia, Stadium and Arena Visits, Graphiq, American Gaming Association and WalletHub research.


Cigna Recognized for Cultural Competency Efforts

Health disparities directly and indirectly cost the U.S. economy $309 billion annually, and it is estimated that approximately 30% of direct medical costs for Blacks, Hispanics, and Asians are unnecessary costs resulting from health disparities, according to a paper prepared by Connecticut-based Cigna. Indirect costs, the paper points out, include lost work productivity and premature death. The paper, focusing on Cultural Competency in Health Care, is part of an initiative by Cigna that has been recognized with an "Innovation in Advancing Health Equity Award" by the National Business Group on Health, which honored the insurer for its ongoing commitment to promoting health equity and reducing health care disparities in the workplace and community.

"Health equity exists when all people, regardless of race, gender, socio-economic status, geographic location, or other societal constructs have the same access, opportunity, and resources to achieve their highest potential for health. It is our hope that these companies provide an example and encourage other employers to advance health equity," said Brian Marcotte, president and CEO of the National Business Group on Health.

Cigna was recognized for its nationwide program, America Says Ahh, to improve preventive care and encourage regular check-ups. A key feature of the campaign is the TV Doctors of America preventive care advocacy campaign featuring five famous TV doctors.  Among them is Alan Alda, best known for his role on M*A*S*H.  Alda will be on Hartford on Saturday evening at The Connecticut Forum.

“For Cigna's network doctors and clinicians, we created and delivered an in-depth cultural competency training with an emphasis on engaging Hispanic patients, and produced an external white paper on Cultural Competency in Health Care,” said Peggy Payne, a leader within Cigna's Health Equity Strategy area.

“The U.S. population is increasingly diverse. Cultural competency is essential to deliver health care services that meet the needs of each individual and improves overall health,” said Christina Stasiuk, D.O., National Medical Director for Health Equity at Cigna.

Racial and ethnic minorities currently make up about a third of the U.S. population, and are expected to become a majority by 2055, the paper points out, noting that:

  • Hispanics will continue to make up the largest portion of the minority population
  • The Asian population is expected to grow at the fastest rate between 2015 and 2055
  • The foreign-born population will increase at a higher rate than the native born population, accounting for approximately 20% of the U.S. population by 2060

As the U.S. becomes more diverse, it is likely that more individuals will have limited English proficiency or will not adhere to Western cultural norms, which may contribute to greater health disparities, the Cigna paper points out.

“Reducing health disparities is a business and social imperative. Minority populations will likely become an increasing share of providers’ patient panels, employers’ workforces, and health plans’ customers, requiring that all stakeholders seek ways to promote health equity to improve health and access, reduce costs, and improve experience,” the Cigna paper emphasizes, suggesting employers can take to build cultural competency and improve health outcomes for all their employees by:

  • Expanding their human resources leadership team to include experts in cultural competency and diversity
  • Instituting multicultural staff representatives to support onsite health services, such as health fairs and open enrollment
  • Seeking feedback from diverse groups of employees about their experiences as health care customers
  • Providing materials and benefits information that are culturally competent, e.g., culturally adapted or language-specific
  • Proactively gathering the demographic data of their workforce to measure and take action on health trends
  • Collaborating with their health plan to better engage employees in their health

Cigna indicates that the company has “ongoing efforts to help ensure that Cigna staff is culturally and linguistically competent.”

The National Business Group on Health is the nation's only non-profit organization devoted exclusively to representing large employers' perspective on national health policy issues and helping companies optimize business performance through health improvement, innovation and health care management.

https://youtu.be/foL9gfbfweY

Edible Arrangements, Subway Take Steps Forward and Back in Roller-Coaster Economy

Two of Connecticut’s leading food franchise success stories - Edible Arrangements and Subway – have both been in the news in recent days, seemingly moving in opposite directions.  Subway, for the first time in memory, is reducing the number of franchises across the country, while Edible Arrangements is in the midst of extending its brand, as its founder has taken back control of the equity in the business. Subway dropped 359 U.S. locations in 2016, the first time that Subway has had a net reduction. The store count dropped 1.3 percent to 26,744 from 27,103, but Subway remains the nation’s most ubiquitous eatery. (Behind only McDonald’s in sales.) Sales at Subway franchises fell 1.7 percent last year to about $11.3 billion, according to published reports. Subway is still growing internationally, with sales outside the U.S. increasing 3.7 percent to $5.8 billion last year, as the company continued to open locations.

Subway was founded about 52 years ago by Fred DeLuca and Peter Buck in Bridgeport. DeLuca died in 2015, leaving the company in the hands of his younger sister, Suzanne Greco, who became chief executive officer. The chain’s restaurants are entirely owned by franchisees.

Since its founding in 1999 in East Haven, Edible Arrangements has grown to more than 1,300 locations worldwide. Tariq Farid developed a "healthy obsession with fruit," and used his experience in the floral industry insight to develop a new business concept: fruit bouquets. Edible Arrangements began franchising in 2001, according to the company website.

Farid has completed a buyback of equity of the company which had been held by Greenwich private equity firm L Catterton.  The company has entered into a strategic partnership with L Catterton in June of 2012. Farid said the relationship provided assistance during a key growth phase for the brand, a time in which Edible Arrangements expanded into offering fresh fruit smoothies, froyo fruit blends, chocolates and more.

“The timing was right to take back full ownership so that I could be more fully engaged in building the future of the brand with our franchisees," Farid said, adding that "Edible Arrangements finds itself well-positioned for a future that includes exciting new opportunities for our franchises and the brand.”

Edible Arrangements has launched a system-wide conversion of traditional stores to a "whole-store" experience in the Edible To Go platform, featuring fresh fruit smoothies, froyo fruit blends and other fresh fruit treats. The company is coming off a year in which it registered a 27 percent increase over the previous year in both the number of new store openings and signings of new franchise agreements. It was named in Entrepreneur's Top 40 of "Fastest Growing Franchises" and "America's Top Global Franchises" as well as being included among the "Inc. 5000" list of the fastest growing privately-held companies.

"This is an exciting time to be a part of Edible Arrangements," Farid said. "At heart we are really a family of small businesses that have enjoyed incredible growth through a shared passion and willingness to work together towards common goals. Now we can focus all our energy on working together on the next evolution of the Edible Arrangements brand."

Edible Arrangements is headquartered in Wallingford; Subway is headquartered in Milford.

Responding to Hunger with Capacity Building; Coalition Initiative Renewed

The University of Saint Joseph (USJ)  and Urban Alliance received a $30,000 grant from the Farmington Bank Community Foundation to support More than Food, a framework that helps food pantries with more capacity-building resources in addition to short-term food supplies to help address the root causes of hunger.  More than Food, developed by USJ, Urban Alliance and Foodshare, was initially launched with funding from the Farmington Bank Community Foundation in 2014. This latest grant supports the program over the next two years. “More than Food focuses on promoting healthy food in pantries and helping people access other resources to find a job. We’re proud to support a partnership that is trying to find a solution to the hunger problem,” said Chris Traczyk, executive director of the Farmington Bank Community Foundation.  “It’s a comprehensive, collective-impact project.”  Dr. Katie Martin, assistant professor and director of the Public Health Program at USJ, and her research team developed a nutrition stoplight system called Supporting Wellness at Pantries, or “SWAP”, which helps food pantry clients choose healthier foods.

USJ is collaborating with the UConn Rudd Center for Food Policy and Obesity and the Council of Churches of Greater Bridgeport to pilot the SWAP system in six food pantries in CT, which together serve over 5,000 people on average every month. Under the More than Food framework, the grant from the Farmington Bank Community Foundation will help expand this work to offer trainings and implement and evaluate the SWAP system in additional food pantries.

As part of the More than Food framework, Urban Alliance has developed various training series and toolkits to equip food pantry staff and volunteers to offer case management services and resource centers that help connect clients to necessary community programs through its Beyond the Basics initiative. Also, Urban Alliance is developing a training program to help pantries create a welcoming environment that fosters the dignity and respect of each person served.

A website, www.ittakesmorethanfood.org , has been developed to share information about the More than Food framework and provide practical guidance and tools to food pantries to help them offer healthy foods with choice, connect clients to needed services, and create a welcoming culture. The recent grant award will help refine, disseminate, and evaluate materials that will be shared through the website.

The website points to the mission ahead: "When the 'emergency' of hunger has lasted over three decades, and with strong evidence that food insecurity is associated with chronic health problems, it is time to rethink the way we provide food assistance and time to examine the effectiveness of food pantries. Through our work, we are changing the conversation about hunger away from emergency food to a person-centered and strength-based approach to help people set and achieve goals in their life."

“We are very grateful for the continuing support of the Farmington Bank Community Foundation, as well as the collaborative work of our partner organizations in making More than Food a holistic way to address hunger in our area,” said USJ's Martin. Currently there are multiple food pantries in Connecticut, Texas and Rhode Island that are implementing the More than Food framework to address the root causes of hunger.


Disparities Evident As Fairfield County Considers Its Community Wellbeing

Fairfield County’s sizeable immigrant population - twenty percent of Connecticut’s most populous county - grew 89 percent from 1990 to 2014. In some municipalities, foreign-born residents make up as much as a third of the population. That is among the findings in the Fairfield County Community Wellbeing Index 2016, which examined regional demographics, economic opportunity, education, health, quality of life, and happiness.  The report includes analysis of the communities, populations, and neighborhoods of Fairfield County, as well as opportunities available and issues facing the area.

Since 1980, the size of the population living in neighborhoods that are considered most affluent – defined as those with an average family income more than 2.5 times higher than the state level - has tripled within Fairfield County. Meanwhile, the number of people living in poor neighborhoods is 3.5 times its 1980 size. The number of people in middle-income neighborhoods has decreased by sixteen percent.

Fairfield County’s Community Foundation, a major funder of the report, partnered with DataHaven, area hospitals, and government agencies to help launch a more robust and comprehensive resource that could serve as a part of the hospitals’ and health departments’ Community Health Needs Assessments as well as a broader county-wide indicators program.

“Fairfield County’s Community Foundation is committed to addressing the most pressing issues facing Fairfield County, but to do that we first need to be able to identify and understand those issues,” stated Nancy M. von Euler, Vice President, Programs, Fairfield County’s Community Foundation. “The data in the Fairfield County Community Wellbeing Index 2016 will help us to develop priorities for collective action to build a stronger, healthier Fairfield County where everyone has the opportunity to thrive, regardless of their zip code.”

The report states that "Despite its overall affluence, Fairfield County is among the nation’s most unequal metropolitan areas. Inequities in well-being appear when evidence is stratified by income, age, race, gender, and zip code. These differences are often most apparent after considering data that were collected specifically for the age groups and neighborhoods that are most impacted."

Among the findings, between 2014 and 2025, adults ages 65 and over are Fairfield County’s only age group projected to grow significantly, with a thirty-seven percent increase. Disparities in the County were also evident:

  • High and rising childcare costs are often prohibitively expensive for low and middle-income families. While Fairfield County has nearly enough spaces for all 3- to 4-year-olds to attend preschool, there are only enough regulated childcare slots for fifteen percent of the county’s children ages 0 to 2, and enough subsidized slots to cover only twenty-two percent of these youngest children in low-income households.
  • The issue of dental care arose as an indicator of well-being, particularly among younger adults and families. The Index shows that for every 10,000 residents living in Fairfield County, 12 residents visit an emergency room to receive treatment for preventable dental conditions in any given year, whereas on the East Side of Bridgeport, 178 residents do.
  • Fairfield County residents are healthy when compared to national benchmarks. However, many conditions and risk factors—such as asthma, food insecurity, exposure to community violence, and the early onset of diabetes—are disproportionately prevalent in lower-income neighborhoods and communities of color. Sections of Bridgeport in particular fall very far behind the surrounding area in many of these measures.
  • Disparities in access to reliable transportation persist between racial and income groups. A majority of Fairfield County workers, regardless of income, commute to another town for work. Many low-income (annual wages under $40,000) workers leave Bridgeport for work, while large shares of high-income workers commute to New York City.

“The process of developing this report allowed local partners and community members to identify links between the well-being of residents and the places where they live. Looking beyond typical measures like income levels or unemployment rates, the Community Wellbeing Index reveals a much more uneven distribution of opportunities in areas such as neighborhood walkability, economic development, public health, and education,” said Mark Abraham, Executive Director of DataHaven and a lead author of the report. “The impact that these barriers to opportunity have on overall well-being and happiness will serve as a call to action for many groups working to improve Fairfield County’s diverse neighborhoods and towns.”

The Fairfield County Community Wellbeing Index 2016 was based on a variety of federal and statewide data sources. Partners of DataHaven’s Fairfield County Community Wellbeing Index 2016 include Fairfield County’s Community Foundation; Bridgeport Hospital; Danbury Hospital; Greenwich Hospital; Norwalk Hospital; St. Vincent’s Medical Center; and Stamford Hospital.