High School A Risky Time for CT Students, Survey Finds
/The Youth Risk Behavior Surveillance System was designed to focus the nation on behaviors among youth related to the leading causes of mortality and morbidity among both youth and adults and to assess how these risk behaviors change over time. In Connecticut, the times they are a changin’. Data released this week by the state Department of Public Health highlights changes over the past decade, and disparities among current students depending upon their grades in school.
The Youth Risk Behavior Surveillance System measures behaviors that fall into six categories:
- Behaviors that contribute to unintentional injuries and violence;
- Sexual behaviors that contribute to unintended pregnancy and sexually transmitted diseases, including HIV infection;
- Alcohol and other drug use;
- Tobacco use;
- Unhealthy dietary behaviors; and
- Inadequate physical activity.
The 2017 Youth Risk Behavior Survey (YRBS) includes randomly chosen classrooms within selected schools, and is anonymous and confidential. It was completed by 2,425 students in 38 public, charter, and vocational high schools in Connecticut during the spring of 2017. The school response rate was 76%, the student response rate was 81%, and the overall response rate was 61%. The results are representative of all students in grades 9-12, according to the state Health Department.
The survey found that during the past decade, the percentage of students who rarely or never wore a seat belt has declined by one-third, as has the percentage who drove a car at least once in the previous month after they had been drinking. That drop was between 2013 and 2017.
The percentage of students who “felt sad or hopeless” almost every day for a two week period “so that they stopped doing some usual activities” during the previous year climbed from 228% in 2007 to 26.9% in 2017 – more than one-quarter of students. The survey found that in 2017, 13.5% of students seriously considered attempting suicide and 8.1% attempted suicide during the past year.
More than one-third of students (34.6%) of students did not eat breakfast every day in the week preceding the survey, and 14.1% did not eat breakfast on any of those days. The percentage of students who got 8 or more hours of sleep on an average school night dropped from 26% in 2007 to 20% in 2017,
The survey also found that 25.8% of students with mostly A’s and 48.6% of those with the lowest grades (D or F) have used marijuana at least once in their lifetime. More than one-quarter of students, across all academic grades (A-F) responded that they drank alcohol at least once in the month prior to the survey.
 The survey found that 38 percent of students whose grades were mostly A’s texted or e-mailed while driving a car on at least one occasion in the 30 days prior to the survey. The percentage was slightly less among students with lower grades: 31% of students with mostly B’s, 30% of students with mostly C’s and 23% of students with mostly D’s and F’s.
When it came to the percentage of students who rode with a driver who had been drinking alcohol (one or more times during the 30 days prior to the survey), students with better grades did so less often, ranging from 12% of students with mostly A’s to 26% of students with mostly D’s and F’s.
The survey also found that 1 out of 5 students (20.1%) whose grades were mostly D’s and F’s did not go to school because they felt unsafe at school or on their way to or from school, on at least one day during the 30 days prior to the survey. Among those with mostly A’s, that percentage was just under 4 percent.
Among those with the lowest grades, 38.9% were in a physical fight at least once during the previous 12 months, and 19.7% were threatened or injured with a weapon on school property, such as a gun, knife, or club, at least once during the past year. Among those with mostly A’s, the percentages were 10.2% and 3.6%.
https://youtu.be/d63xyYs9s94
 The ranking does not capture the full extent of deprivations or hardships affecting children. Instead, it focuses on some key rights, or “guarantees” of childhood: life, healthy growth and development, education and protection from harm. If a child experiences all of these, his/her childhood is considered to be “intact.”
 The report notes that “While children are only 20 percent of the population, they are 100 percent of America’s future.” Save the Children’s ranking reveals children in New Jersey, Massachusetts, Vermont and New Hampshire are far more likely to experience safe, secure and healthy childhoods than children in Louisiana, Mississippi, Oklahoma and New Mexico.
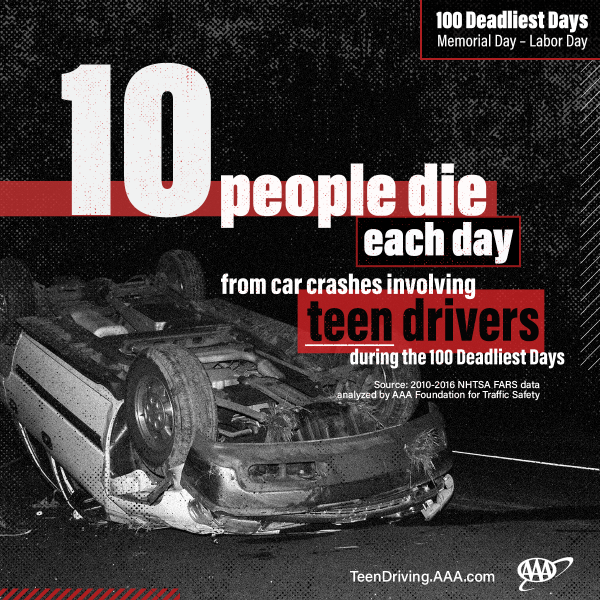


 “We understand, by all accounts, many of them may be using products that closely resemble a USB flash drive, have high levels of nicotine and emissions that are hard to see. These characteristics may facilitate youth use, by making the products more attractive to children and teens. These products are also more difficult for parents and teachers to recognize or detect. Several of these products fall under the JUUL brand, but other brands, such as myblu and KandyPens, that have similar characteristics are emerging.”
 The Summit will feature nearly a dozen sessions and speakers, many from local businesses, highlighting best practices and latest developments in a range of technology arenas.
 If you have a sense that reports of hit-and-run accidents have increased in frequency, you’re correct.
 In all states, it’s the drivers legal and moral responsibility to avoid hitting pedestrians, bicyclists, or another vehicle; and leaving a crash scene significantly increases the penalties, whether or not the driver caused the crash, AAA emphasized.


 Stating that “justice should not have an expiration date,” the organization points out that eight states have no statute of limitations for felony sexual assault crimes, and 28 states have a statute of limitations of 21 years or more. Only 10 states, including Connecticut, have a statute of limitation of 10 years or less.
 According to the National Institutes of Health, sexual violence is the leading cause of Post-Traumatic Stress Disorder (PTSD) in women.
  In comparing the average annual opioid-related death rates per 100,000 population in 2012-13, 2014-15, and 2016-17, the dramatic increases across communities statewide is quite evident. The data analysts point out that data are where deaths from 'any opioid' (meaning some type of opioid were found in the person) take place. Therefore, they explain, one would expect to see higher rates in places with large hospitals (hence high rates in cities). They add that one can also not discount that these places are also seeing higher rates among its residents.
 The Connecticut Data Collaborative has posted on its