Most Expensive States for Car Insurance? CT Ranks Fifth in Survey of 50 States

Connecticut is fifth, but Michigan has been first for five consecutive years in an annual comparison of car insurance rates.  Connecticut is 34 percent more expensive than the national average, according to the criteria used in the state-to-state comparison. When the website insure.com looked to compare car insurance rates, they worked with Quadrant Information Services to calculate car insurance rates for a 40-year old man seeking full coverage from six different major carriers. They tabulated the price quoted in 10 zip codes for every state, looking for the average of a 2018 model-year version of America’s 20 best-selling vehicles.

Their finding: car insurance rates can vary widely depending on the state you call home, and numerous other factors. Connecticut was near the top – in the middle of the top ten most expensive states for car insurance, based on this criteria.  A year ago, Connecticut ranked third.

The website’s analysis pointed out that high vehicle density is one culprit for higher than average premiums. They noted that Connecticut is the fourth densest state in the country and “tons of cars piled into a small space leads to accidents, which leads to claims, which ends in high car insurance rates.”

The top five states with the highest rates were Michigan ($2,239), Louisiana ($2,126), Florida ($2,050), Rhode Island ($1,852) and Connecticut ($1,831).  Rounding out the top ten most expensive states for car insurance, according to the survey, were Washington DC ($1,827), California (1,731), Georgia ($1,668), Delaware ($1,600), and Texas ($1,589).

Across the Northeast, Vermont ranks lowest in the entire country at just $932.  New Hampshire was also among the lowest, at $1,039.  Massachusetts ranked number 38, with an annual premium of $1,176.

Hartford, New Haven As “Suburbs” of Boston and New York Raises Possibilities - and Pushback

The objective was to provide evidence that Connecticut is on the cusp of a transit renaissance.  But a “thought leader” article by a prominent faculty member at the University of Connecticut School of Business – an acknowledged expert in transportation and its impact on residential property values – has drawn a range of reactions from municipal, business and transportation officials in Connecticut, including some pushback. 
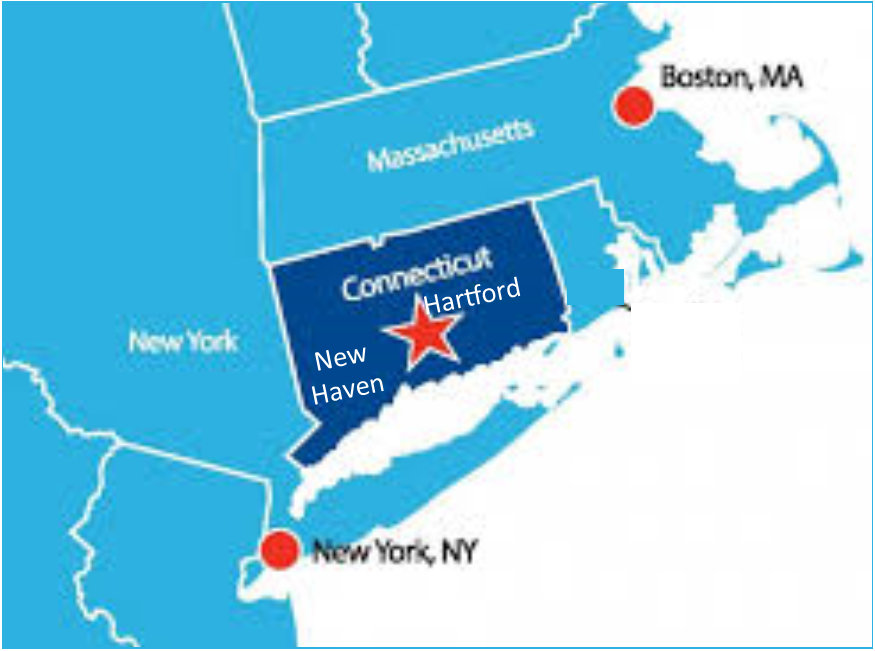
The article, by UConn associate professor of real estate and finance Jeffrey Cohen, stated that “with high speed, inter-state transportation, it would be much easier for Greater Hartford and New Haven to thrive as suburbs of Boston and New York City.  Imagine how great it would be to hop on a fast train to Logan Airport, JFK or LaGuardia.  The world would be at our doorsteps, and our doorsteps would be there for the world to explore.”

The characterization of two of the state’s largest cities as potential “suburbs” of New York and Boston, seemingly overlooking Bradley International Airport and Tweed-New Haven in the process, has raised questions from officials.

“As the second-largest airport in New England and the recently ranked third-best airport in the country, Bradley Airport offers convenience and efficiency that the airports in Boston and New York cannot match. Enhanced rail connectivity to the airport would be a major win for passengers throughout Connecticut and Western Massachusetts, and we would encourage UConn to consider maximizing the airport in its own state rather than promoting the outsourcing of Connecticut’s economy to its neighbors,” Connecticut Airport Authority Executive Director Kevin A. Dillon, A.A.E, told CT by the Numbers.

“While the Connecticut Airport Authority is supportive of high-speed rail connectivity in Connecticut, it is unfortunate that UConn would not recognize the benefit of promoting and utilizing Bradley International Airport as the primary airport for travelers in the region,” Dillon added.

“With regard to Bradley, Aer Lingus’ commitment to another four years of service between Hartford and Dublin is a huge boon to our economic development efforts and we hope other airlines will take note and pursue additional domestic and international routes,” said MetroHartford Alliance’s Brian Boyer, Vice President of Communications, Marketing, and Media and Public Relations.  “It’s time to continue showing loyalty to our hometown airport as we position ourselves as a global region attracting international companies. With the ease of use at Bradley, brief 90-minute layovers in Dublin en route to destinations throughout Europe, pre-screening on return flights to clear customs before arrival in Hartford and the prospect of attracting new airlines, this flight is a win-win for our community.”

While some officials saw possibilities, as did Cohen, in the potential impact of continued enhancements to the state’s transportation system, they also acknowledged that those changes were not immediate and current assets should be maximized.

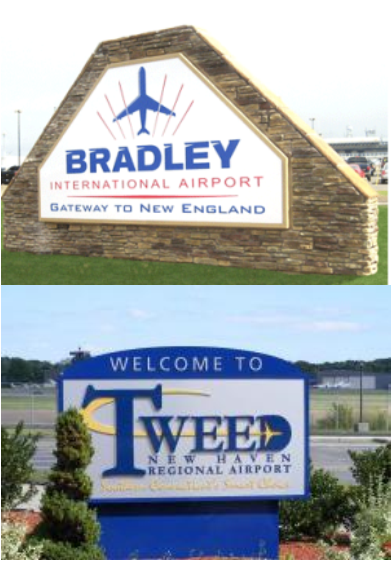
“Fast-growing healthcare, pharmaceutical, and technology sectors of the New Haven economy would be well-served with easier access to major markets in New York and Boston, and the international transportation options in those cities as well,” pointed out New Haven Mayor Toni N. Harp. “We know one-hour train service between New Haven and New York is technologically feasible: what we need to complete the project is the collective will to make it so.”

“High speed rail offers tremendous opportunities for New Haven.  Our proximity to New York City is already a great selling point for the region, if the commute time became significantly shorter, then we are that much more attractive as a location.  We should strive for this type of transportation improvement,” said Garrett Sheehan, president of the Greater New Haven Chamber of Commerce.

Sheehan went on to emphasize that “planning for the future of transportation should not take away from the present.  This type of high speed rail is years away.  In New Haven, we have an incredible transportation asset in Tweed-New Haven airport.  It is already located within the city limits and just short drive from anywhere in this region.  The Chamber supports expanding the airport’s runway and investing in Tweed to bring back more flights and destinations.  Even a handful of more flights would be beneficial to the economic growth of our region.”

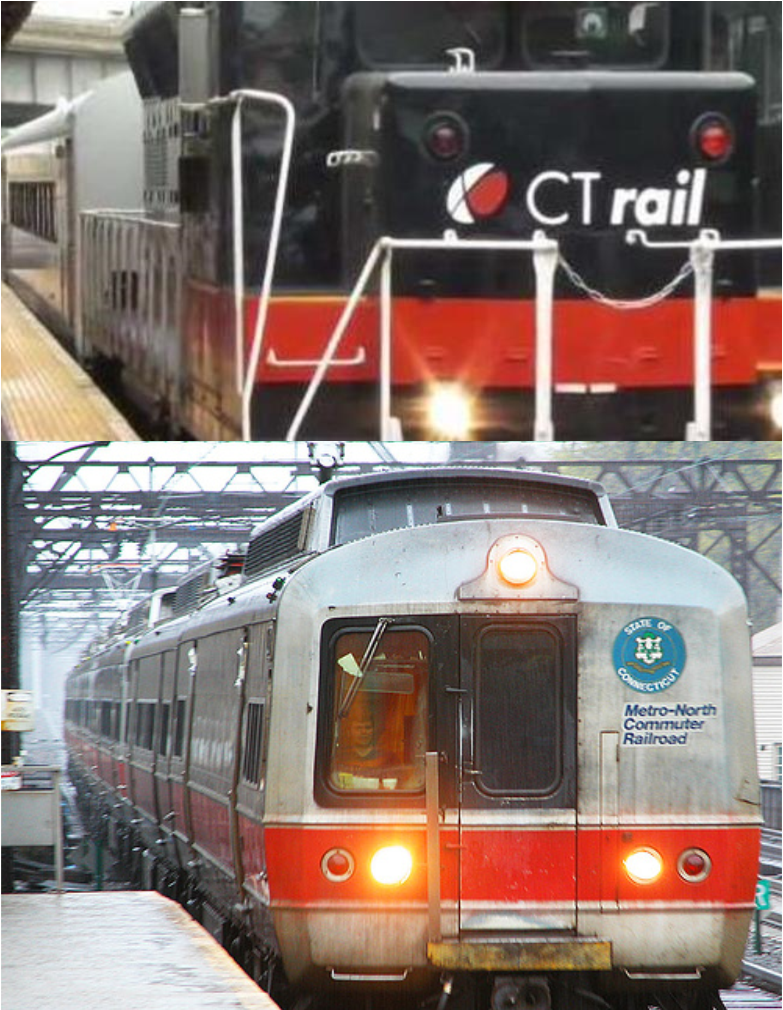
Cohen, who has received national recognition in his field, praised the CTrail Hartford line - which connects New Haven, Hartford, and Springfield, MA - and CTfasttrak bus line – which links Hartford and New Britain - noting that “we are starting to see residential and business development near the stations, and this is one of the big benefits of transit.”

He added that “Some people in New York are starting to discover the hidden treasure of relatively low-priced real estate, along with the good schools, beautiful parks, and savory restaurants in central Connecticut.”

“An ideal location with easy access to major cities in the Northeast and Mid-Atlantic, we are proud to be at a point where talent and businesses from these markets should consider Hartford as an opportunity for economic growth and development,” the MetroHartford Alliance’s Boyer noted. “Transportation plays an integral role in this growth and with the new Hartford Rail Line and the continued growth at Bradley International Airport as one of the nation’s top mid-sized airports, we look forward to working with our community and prospective businesses to ensure long-term economic growth for generations.”


Progress Cited on Integrating Pedestrian, Bicyclist Safety Into State Transportation Projects

What comes next at the Department of Transportation was on the minds of more than 150 advocates and enthusiasts gathered for the Annual Meeting of Bike-Walk Connecticut  at Central Connecticut State University in New Britain this past weekend.  The fast-approaching close of the Malloy administration may also mean the end of the tenure of DOT Commissioner James Redeker, who has not only walked the walked, but rode the ride in “building and delivering a comprehensive pedestrian and bicycle program.” 
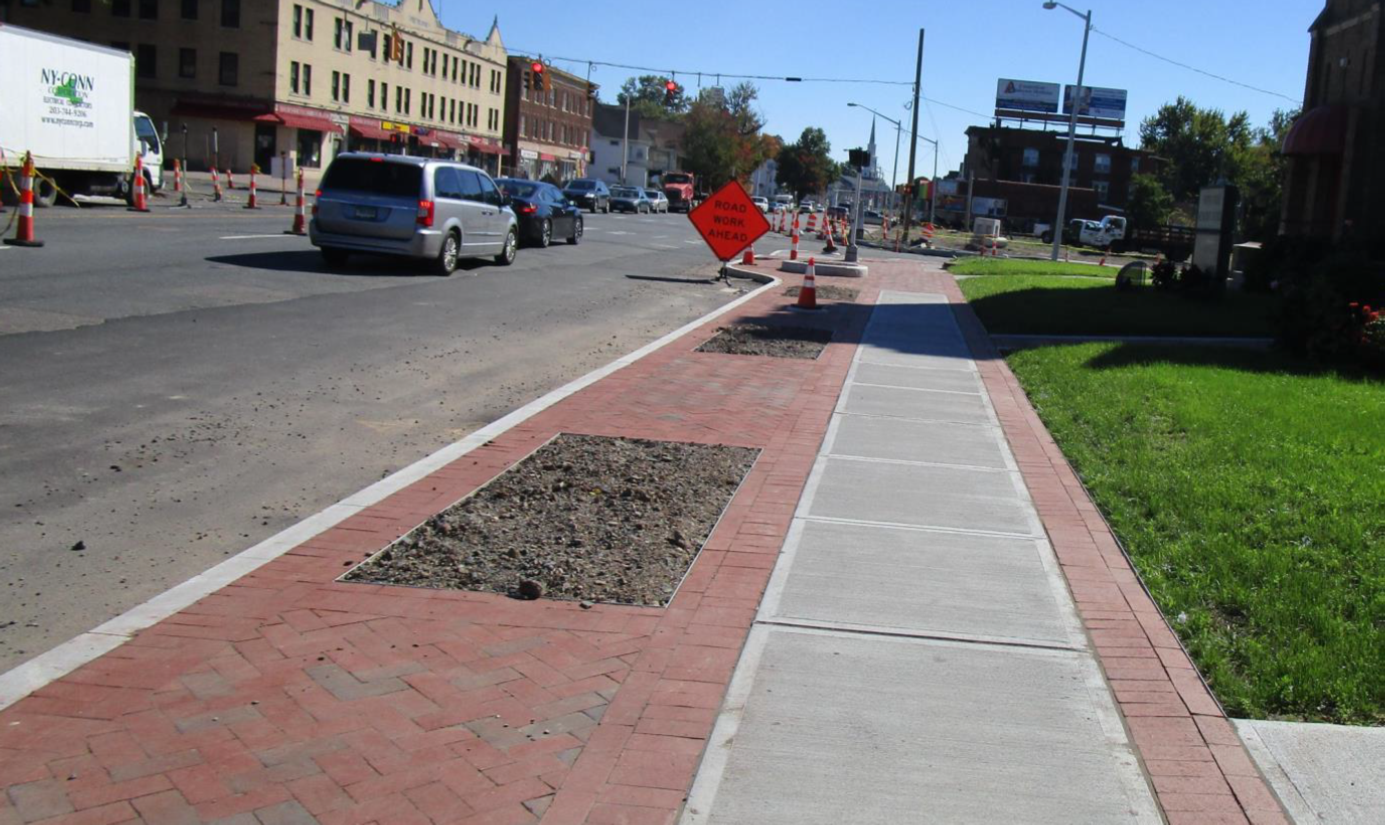
The accelerated change in attitude at DOT since Redeker took the helm in 2011 was evident in his being warmly introduced as a friend prior to his keynote address – not the adversary that previous vehicle-centric commissioners may have been.  He went on to highlight the department’s work on state projects, and in concert with municipalities, that is steadily transforming Connecticut into a more pedestrian and bike-friendly state.

Redeker’s presentation demonstrated why.  Among the highlights:

  • Connecticut has or will be constructing 97 miles of multi-use trails along side road construction or reconstruction through 2021, and 35 miles of sidewalks accompanying road construction.
  • A vendor-in-place resurfacing program has meant that 94 percent of roadways reconstructed have been restriped with wider shoulders, and roadway safety audits have been conducted on 145 miles of roadway and at 917 intersections.
  • Enhanced pedestrian signage and pavement markets at uncontrolled crosswalks have been included in 1200 locations on state roads, with an additional 1500 locations planned for local roads in 2019. In addition 133 locations are planned for upgraded pedestrian controls at signalized intersections by 2020.
  • 125 projects have been reviewed for Complete Streets design in 2017, with an additional 97 projects reviewed thus far in 2018. More than 80 Road Safety Audits have been conducted.

Driving the “absolutely amazing statistics” is a changed policy, Redeker said.  Now, supporting “safe access for all users by providing a comprehensive, integrated, connected multi-modal network of transportation options” is ingrained at DOT.  He noted that integrating trails is occurring regularly on major projects, with the goal of building a statewide trail system.

“Complete streets is now part of the DOT DNA,” Redeker explained.  Responding to some who question the lack of such plans as part of the agency’s manual, Redeker cited the statistics, adding, “look at us for outcomes, not manuals.”  The numbers – and the accomplishments - drew solid reviews in the room.

The agency’s Complete Streets program, established in 2014, established a new unit to review every project specifically for bicyclist and pedestrian needs, and requires project designers to evaluate and prepare a written assessment of pedestrian needs on every project.  A standing committee was also formed to guide and implement policy and practices, Redeker pointed out.

He noted that the changes are evident in large cities and small towns in Connecticut, from Hartford New Haven to Waterford and Washington.  He also highlighted the introduction of roundabouts in Connecticut communities, including Monroe, Seymour and Ellington, and Community Connectivity Grants that have funded 40 small-scale local projects totaling $12 million, with another 40 to be requested for upcoming State Bond Commission agendas, with an estimated cost of $13.4 million.

Upgrades in school warning signs include the replacement of traditional yellow signage with fluorescent yellow-green to enhance visibility was completed in 2015.  Pedestrian warning signs were replaced on state routes in 2017, and are on schedule to be upgraded on local routes in 2019 and include greater use of yield bars on pavement.

Upgrades in school wanting signs include the replacement of traditional yellow signage with fluorescent yellow-green to enhance visibility, and greater use of yield bars on pavement.  Signs were replaced on state routes in 2017, and are on schedule to be upgraded on local routes in 2019. 

Traffic signals are also being replaced along state roadways, with “pedestrian safety our number one concern,” Redeker stressed.  It is an extensive task.  Connecticut has more traffic signals that exceed 30 years old, more than any other New England state and the 10th highest volume in the U.S.

Mention of the state’s “Watch For Me” campaign drew extended applause – the comprehensive initiative seeks to alert the public to the presence of pedestrians and bicyclists, to underscore the importance of assuring safety and police enforcement.


Connecticut's State Gas Tax is Sixth Highest in the US; Two States Seek to Defeat Increases

Connecticut’s state gas tax – criticized both because some consider it to be too high and because others point out that it is insufficient to keep the state’s roads and bridges maintained appropriately – is not among the highest in the nation, but comes close. Leading the way with the highest state gas tax levels are Pennsylvania (59 cents a gallon), California (54 cents), Washington (49 cents), Hawaii (48 cents), and New York (46 cents).  Connecticut is the nation’s sixth highest, at 44 cents a gallon, followed by Indiana (42 cents), Florida, Michigan and New Jersey (41 cents).

In California, voters will see a referendum question on the November ballot that if passed would repeal a gas tax increase (12 cents a gallon) that was passed by the state legislature a year ago as part of a comprehensive transportation funding package to pay for highway, road and bridge repairs, as well as public transit projects in the state.  Recent polls predict a close vote on Proposition 6.

In Missouri, voters will consider Proposition D, which would increase the fuel tax in that state by 2.5 cents a year for four years, totaling 10 cents a gallon. The proposal is intended to provide a stable funding stream to the Missouri State Highway Patrol, as well as millions of dollars to the Missouri Department of Transportation to repair and maintain the state's highways and bridges, according to published reports.

New Jersey’s gas tax, which had been one of the lowest in the nation, was increased in 2016 by 23 cents per gallon under a bipartisan deal engineered by then-Chris Christie and the Legislature.  That pushed New Jersey into the top 10 highest rates in the nation, and was the state’s first gas tax increase since 1988, according to news stories at the time.

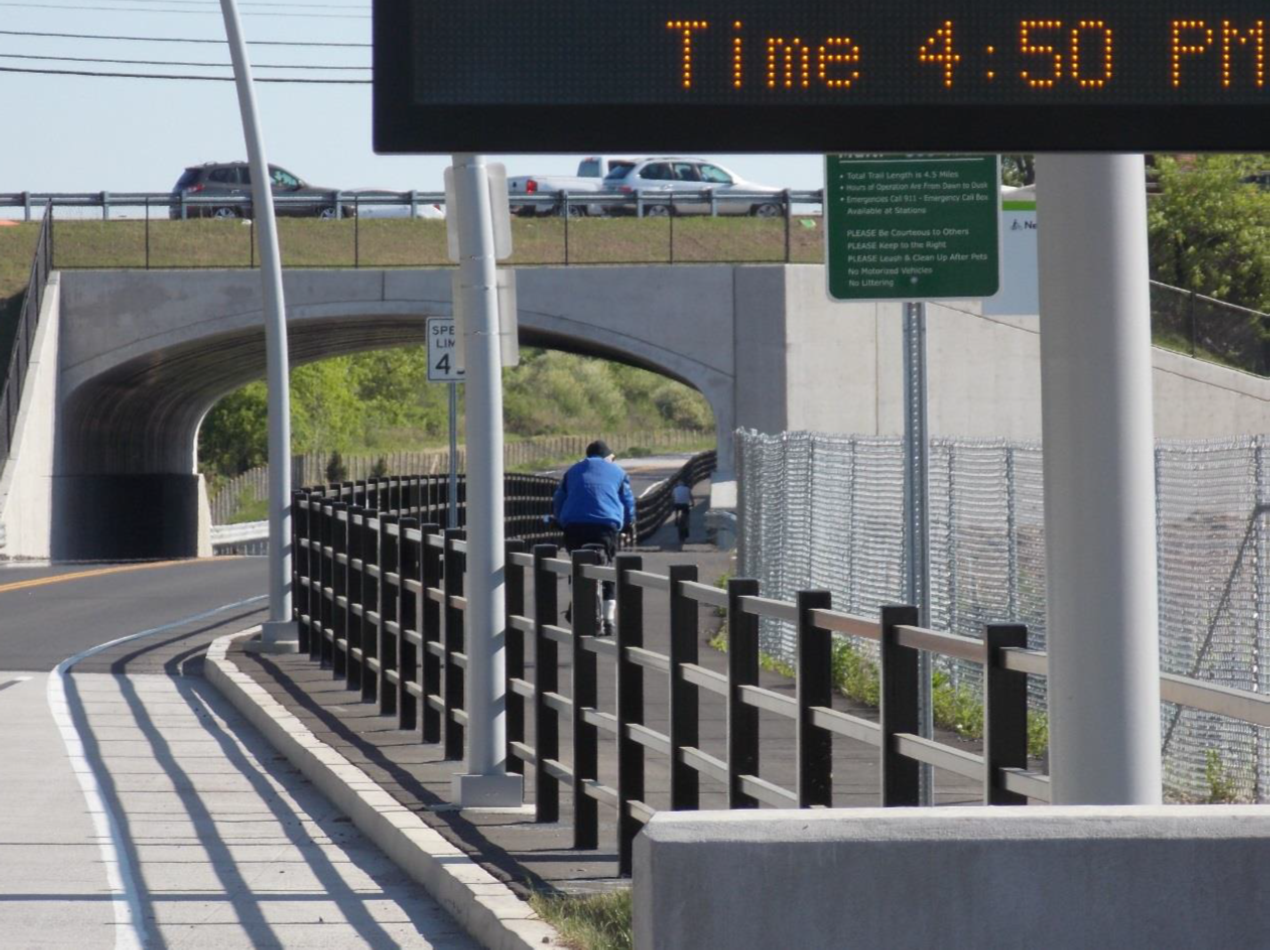
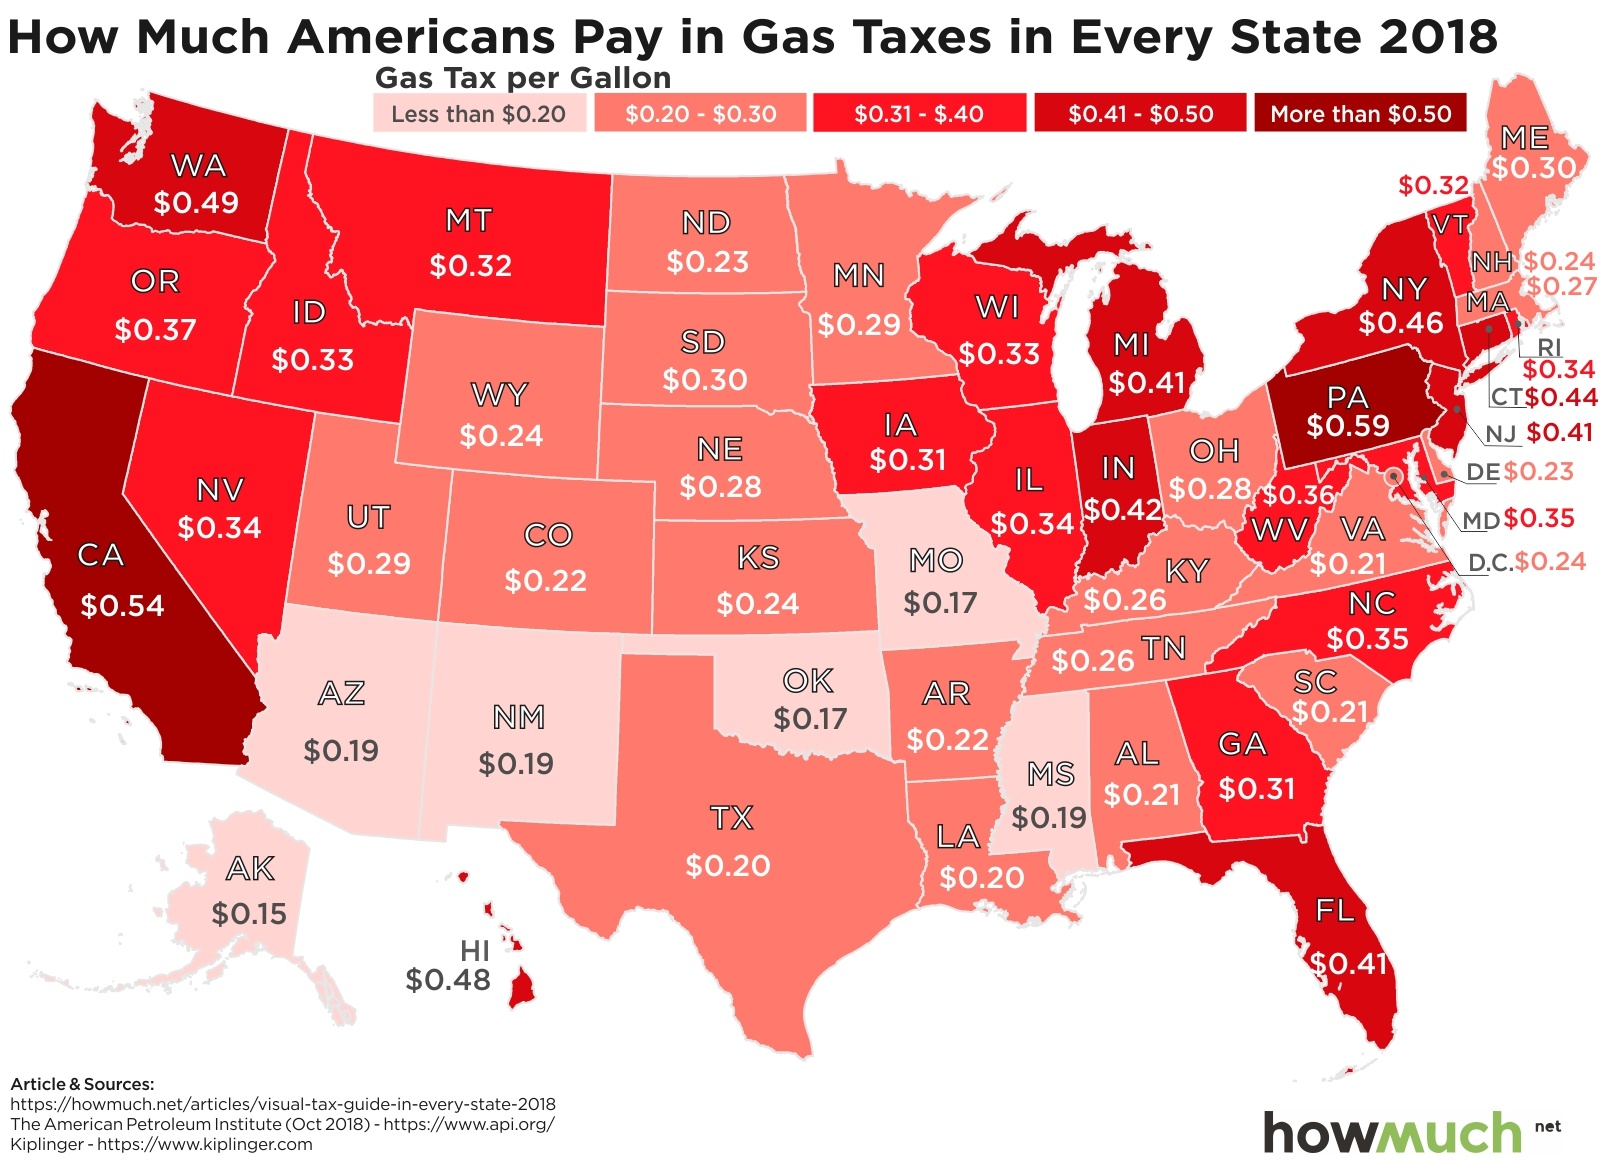
In total, 27 states have raised or reformed their gas taxes since 2013.  Indiana instituted a 10-cent increase in 2017; Oregon approved a 10-cent phase-in that began this year. The South Carolina legislature overrode a Governor’s veto to enact a 12-cent-per- gallon increase in the tax rate to be phased in over 6 years, according to data compiled by the Institute on Taxation and Economic Policy.  Oklahoma’s legislature approved a 3 cent increase this year - that state’s first since 1987.

The federal government last raised the gasoline tax 25 years ago in 1993, since then the states – in the vast majority of instances – have nudged tax rates upward in their individual jurisdictions.  The lowest state rates are in Alaska (15 cents a gallon), Missouri and Oklahoma (17 cents), Mississippi, Arizona and New Mexico (19 cents).

308 Structurally Deficient Bridges Across CT: Average Age 69 Years

Just last month, it was revealed that more than 1,500 of California’s bridges are structurally deficient, meaning there is significant deterioration of the bridge deck, supports or other major components. More than half – 56 percent – of California’s bridges are at least 50 years old – the eighth highest rate in the nation. 
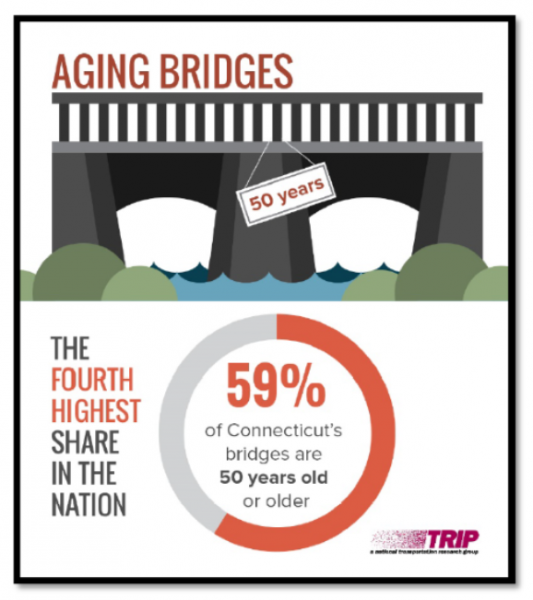
Yesterday, it was announced that 59 percent of Connecticut’s more than 4,000 bridges are 50 years or older, the fourth highest rate in the nation. The average age of all Connecticut’s bridges is 53 years, while the average age of the state’s 308 structurally deficient bridges – seven percent of the total - is 69 years.  Structurally deficient bridges in Connecticut are crossed daily by 4.3 million vehicles.

Both reports were done by TRIP, a national transportation research group, based on an analysis of Federal Highway Administration National Bridge Inventory (2017).  The organization did a similar report about Wisconsin, also released this week.  It found that nine percent of Wisconsin’s locally and state-maintained bridges are structurally deficient.

Connecticut has 4,252 bridges (20 feet or longer), compared with 14,253 in Wisconsin and 25,657 in California.

The 20-page Connecticut report indicated that “To retain businesses, accommodate population and economic growth, maintain economic competitiveness, and achieve further economic growth, Connecticut will need to maintain and modernize its bridges by repairing or replacing deficient bridges and providing needed maintenance on other bridges to ensure that they remain in good condition as long as possible.”

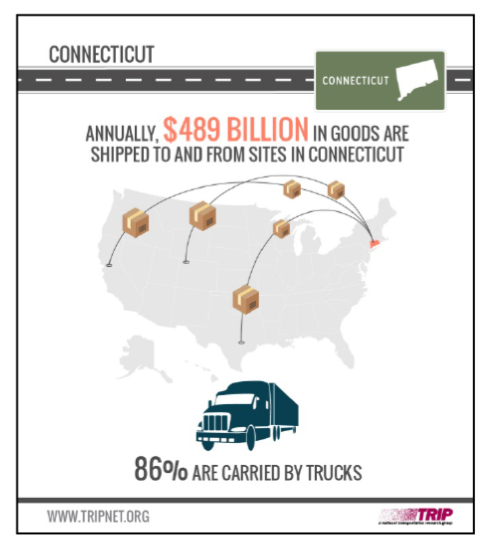
The report also noted that “annually, $489 billion in goods are shipped to and from sites in Connecticut, largely by truck,” adding that “approximately 731,000 full-time jobs in Connecticut in key industries like tourism, retail sales, agriculture and manufacturing are completely dependent on the state’s transportation network.”

Hartford, Fairfield and New Haven counties each have 60 or more structurally deficient bridges, with 65, 61 and 60 respectively.  Litchfield County has 39; New London County has 32.  The report listed Middlesex County with 22, Windham County with 17 and Tolland County with 12.

The report also sounded an alarm for Connecticut, a state seeking to attract and retain businesses to bolster a sluggish economy:  “Increasingly, companies are looking at the quality of a region’s transportation system when deciding where to re-locate or expand. Regions with congested or poorly maintained roads may see businesses relocate to areas with a smoother, more efficient and more modern transportation system.”

Highway accessibility, the report pointed out, was ranked the number one site selection factor in a 2017 survey of corporate executives by Area Development Magazine.

“Without a substantial boost in federal, state and local funding, numerous projects to improve and preserve Connecticut’s bridges will not be able to proceed, hampering the state’s ability to improve the condition of its transportation system and to support economic development opportunities in the state,” the report concluded.

This summer,  CT by the Numbers reported on a ranking developed by CNBC, found that 73 percent of Connecticut roads are in bad shape, giving the state a grade of D, while noting that nearly 8 percent of Connecticut’s bridges are deficient.

2017 Was A No-Growth Year for CT Hotel Industry; 2018 Brings Lower Rates

The Connecticut Lodging Association reports that the state’s hotel and lodging occupancy numbers were flat in 2017, with “little to no growth.”  The state’s occupancy numbers have “considerable room to grow” this year, in comparison to the New England Market.  The membership association also notes that one of the traditionally strongest regions of the state, the Stamford market, declined in 2017, while the neighboring New York market remained stable. “The Stamford market historically has the highest occupancy numbers in Connecticut,” officials point out, noting that “with business travel, leisure and New York City overflow, this market is generally stable and measure equal occupancy to New England’s numbers.  That wasn’t true in 2017, and they warn that “Stamford’s declining trend may be a forecast for other Connecticut markets.”

Overall, data for Connecticut compiled by the American Hotel & Lodging Association indicate that the state’s 400 properties in the hotel industry generate 55,000 hospitality jobs and 27,00 hotel hobs, which result in $4.4 billion guest spending at hotels, local businesses and on transportation.  The industry contributes $5.1 billion to GDP.

Connecticut has the highest combined lodging and sales tax in the nation at 15 percent, according to HVS Convention, Sports & Entertainment’s most recent state-by-state study in 2017, one of just five states in double digits along with Maine, Hawaii, Rhode Island and New Jersey.

Adding in local lodgings taxes in many cities nationally — Connecticut law does not allow it — 34 cities have higher combined rates than in Connecticut, HVS determined, none in the Northeast. St. Louis led the nation in 2017 at nearly 18 percent, with New York City highest in the Northeast with a 14.75 percent rate that is only a fraction below that of Connecticut, Hearst newspapers recently reported.

Earlier this month, a survey by BostonHotels.org found that Hartford and Stamford hotels offer the lowest rates for travelers in New England, with hotel stays averaging $107 per night in the Capitol City and $126 in Stamford. Among the other New England cities with low hotel rates are in North Conway, N.H. ($117), Groton ($119), and Lincoln, N.H. ($124).

The survey reviewed hotel rates at 30 popular destinations in New England during August. Hotels in New Haven ranked 19th (most expensive in Connecticut) with rooms averaging $174 a day and Mystic at 21st with rooms costing $168.

The most expensive in New England?  Martha's Vineyard, Mass. ($362), Kennebunkport, Maine ($347), Chatham, Mass. ($324), Portland, Maine ($294) and Provincetown, Mass. ($284). Boston ranked 9th, at $224.


Transportation Infrastructure in CT Among Nation's Worst; Including Structurally Deficient Highway Bridges

When the Mianus River Bridge on Interstate 95 in Greenwich collapsed 35 years ago, killing three motorists and putting an unprecedented focus on road and bridge infrastructure in Connecticut, it was apparently not preceded by public warnings about the poor condition of the state’s roads and bridges. Today, the warnings are abundant, in Connecticut and elsewhere, including a new ranking which underscores that New England and the Northeast are the epicenter for transportation infrastructure in need of improvement.

The latest comes from a ranking developed by CNBC, which found that 73 percent of Connecticut roads are in bad shape, giving the state a grade of D, while noting that nearly 8 percent of Connecticut's bridges are deficient.  Data from the American Road & Transportation Builders Association (ARTBA)  earlier this year indicated that 332 of the state’s 4,238 bridges were deemed deficient, six fewer than the previous year.    

Connecticut is not the only state in the region with acute infrastructure problems in need of costly solutions.  From the bottom up, the states ranking lowest in the analysis are Rhode Island, New Hampshire, Maine, Connecticut, Maryland and West Virginia (tie), New York, New Jersey, Massachusetts and Mississippi.

The CNBC report said of Connecticut:  “The infrastructure situation in the Nutmeg State is so bad, you could say Connecticut is moving backward. With the state facing a fiscal crisis, Gov. Dannel Malloy had to cancel $4.5 billion in transportation projects last year, proposing instead to restore tolls to the state’s highways for the first time in more than 30 years. That idea, so far, has gone nowhere. As politicians continue to debate, Connecticut roads continue to deteriorate.”

According to data published by ARTBA, Connecticut’s most traveled structurally deficient bridge – and the 60th most traveled structurally deficient bridge in the nation – is on I-95 in Norwalk, over the Norwalk River at Hendricks Avenue, between exits 15 and 16.  Additionally, highway bridges in New Haven, Fairfield and Hartford are also among the 110 most highly travelled and structurally deficient in the United States, the ARTBA indicates. 

The Connecticut Business and Industry Association has noted that the state's Special Transportation Fund faces insolvency by 2020—despite Connecticut having the seventh highest gas taxes in the nation, adding that this fall, voters will consider a constitutional amendment creating a lock box to protect dedicated transportation funding from being diverted to other uses.

According to Ballotpedia, the measure would require that all revenue placed in the state's Special Transportation Fund (STF) be used for transportation purposes, including the payment of transportation-related debts. The state legislature would be prohibited from spending the fund on non-transportation purposes.

The STF is funded by the motor fuels tax, motor carrier road tax, petroleum products gross earnings tax, certain motor vehicle receipts and fees, motor vehicle-related fines, and a portion of state sales tax.

The top five states with the best transportation infrastructure, according to the CNBC analysis, are Texas, Indiana, Georgia, Ohio, and Tennessee.


Toll Technology, Revenue Considered in Indiana, Minnesota and (Possibly) Connecticut

“Toll technology advancements significantly altered the tolling landscape, expanded the types of toll facilities being operated and improved customer experience,” a report on tolling feasibility developed for the Minnesota Department of Transportation explained.  “New toll facilities using all-electronic tolling are being implemented in several places across the country to add new roadway capacity, manage congestion and provide a sustainable revenue source for asset lifecycle costs.” The 106-page report, issued in January, concluded that more study is needed — if that’s the direction the state wants to take, the Minneapolis StarTribune reported.  The StarTribune noted that “Minnesota doesn’t have the kind of toll-road system that is common on the East Coast and other regions of the country. The E-ZPass electronic toll system, for example, was first deployed in New York 25 years ago and now serves 17 states, stretching from Maine to Illinois to North Carolina.”

The MnDOT study, initiated at the legislature’s behest, cost $175,000 and recommended a follow-on in-depth study, anticipated to have a considerably larger price tag.  The report stated that “results of the feasibility analysis are a high-level revenue assessment based on numerous assumptions and a more detailed study would be required before any decision is made to implement a specific toll project.” The report was prepared by four consultants – the Minneapolis offices of WSB and HNTV Corporation, and Prime Strategies, Inc. and Lock Lord LLP, both of Austin.

Indiana is also giving tolls a careful look, with the type of in-depth study recommended in Minnesota, and proposed by Connecticut Governor Dan Malloy, who signed an Executive Order authorizing a $10 million study.  Malloy’s proposal is to be considered by the State Bond Commission later this week.  “Without transforming the way the state funds its highways,” Malloy said recently, “we will be unable to pay for the large-scale construction and rehabilitation projects that our state needs to ensure continued safe travel while attracting businesses and growing our economy.”

In Indiana, a strategic plan that could clear the way for that state to add tolls to its interstate highways, including inside the I-465 loop in Indianapolis, is currently being developed by one of the companies utilized by Minnesota.

The Indianapolis Star reported earlier this summer that the state signed a $9.6 million contract with HNTB Indiana Inc. to study the impact of tolling and provide project planning if the state chooses to move forward with tolling.  The administration of Gov. Eric Holcomb is required to study tolling under a road-funding plan lawmakers passed in 2017, but a decision has not been made on whether the state will go forward with authorizing a tolling plan, according to published reports.

Under the law, Indiana’s Governor is permitted to draft a strategic plan "if the governor determines that tolling is the best means of achieving major interstate system improvements in Indiana."   That decision has yet to be made.

"He wanted more information to make an informed decision and will use the strategic plan due Dec. 1 as a basis for that," a spokesman for the Governor told the Star. "If after reviewing the plan the governor determines that tolling is not the best option, the state won’t move forward with the remainder of the contract."

The contract with HNTB lays out specific requirements for the consultant if the state chooses to add tolling. For example, the Star reported, HNTB would be required to assist with project start-up for tolls in the Indianapolis Metropolitan Planning Area, which includes Indianapolis and portions of nearly all of the bordering counties.

In Iowa earlier this year, a state DOT report on tolls was received by political leaders with distain.  In an editorial, The Gazette noted the possibility of tolls “is worthy of much more careful consideration than the political class is willing to grant.”  The publication added “Political fecklessness will not solve Iowa’s mounting transportation funding problems. Iowans love driving, we have a lot of roads and somebody has to pay for them.”

“Many Iowans have noticed a pattern in state government, a repetitive cycle of studies, recommendations and inaction. That may serve politicians fixated on their next election, but it does little to solve the very real problems Iowans face.”


https://youtu.be/kQxCVcMUq1s

Video: Connecticut House Democrats

Graphics:  2018 Minnesota DOT Toll Study Report

Bridgeport, New Haven Among Nation's 50 Most Stressful Cities, Analysis Says

Stress?  Look no further than Bridgeport and New Haven.  Both cities were ranked in the top 50 Most Stressed Cities in America, a new ranking produced by the financial website WalletHub. Bridgeport ranked 33rd and New Haven 41st, based on analysis that considered stress in four areas:  the workplace, finances, family, and health and safety as contributing factors.

The most stressed cities in America, according to the analysis, were Detroit, Newark, Cleveland, Birmingham, Toledo, Baltimore, Wilmington, Milwaukee Gulfport and St. Louis.  Among New England cities, Bridgeport led the list, followed by Worcester (37), New Haven, Boston (52), and Providence (57). 

Bridgeport ranked 17th in the workplace stress category and 23rd in financial stress; 103rd in family-related stress. Bridgeport also had among the lowest average weekly work hours, tied for 176th among the 182 cities included in the rankings.  New Haven ranked 168th in that category.

New Haven was 37th in health and safety related stress; in the mid-50’s in the other categories.

WalletHub evaluated the 150 most populated U.S. cities, plus at least two of the most populated cities in each state, using the four dimensions including 37 relevant metrics.  Those metrics included job security, traffic congestion, unemployment rate, average commute time and income growth in the work stress category.  Financial stress included evaluation of annual household income, foreclosure rate, food insecurity, housing affordability and debt per median earnings.

The family stress category included the separation and divorce rate, number of single parent households, child care costs and other factors.  The ten factors considered as part of the Health & Safety stress category included mental health, smoking, obesity, inadequate sleep, crime rate and hate-crime incidents.

Greensboro, North Carolina, residents spend the fewest annual hours in traffic congestion per auto commuter, 4, which is 25.5 times fewer than in Los Angeles, the city where residents spend the most at 102, according to the data.  Bridgeport and New Haven tied for 36th in the traffic congestion rankings.

Data used to create this ranking were collected from the U.S. Census Bureau, Bureau of Labor Statistics, INRIX, Chmura Economics & Analytics, Indeed, Federal Deposit Insurance Corporation, Renwood RealtyTrac, County Health Ranking, Zillow, Administrative Office of the United States Courts, TransUnion, Department of Housing and Urban Development, Council for Community and Economic Research, Gallup-Healthways, Numbeo, Centers for Disease Control and Prevention, Federal Bureau of Investigation and Sharecare.

New Haven is Among Safest Cities in U.S. for Cycling, Analysis Shows

New Haven is one of the nation’s ten safest cities for cyclists, according to a new analysis.  In a ranking dominated by communities in California, with six of the top ten, New Haven was not only the lone Connecticut city to earn a spot among the top ten, it was the only city in the Northeast to do so.  
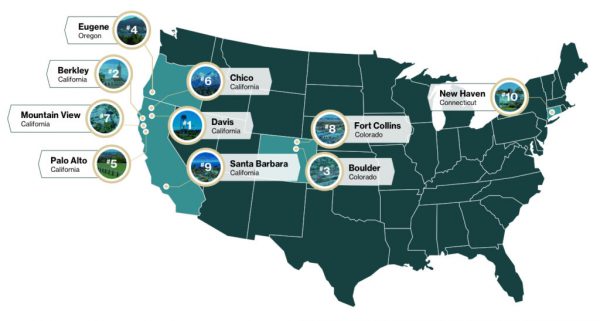
The ranking saw Davis and Berkeley California named the safest cities for bicyclists, followed by Boulder, Colorado; Eugene, Oregon; Palo Alto, Chico, and Mountain View, California; Fort Collins, Colorado; Santa Barbara, California, and New Haven.  Minneapolis ranked number 12.

Five other Connecticut cities made their way into the top 100 nationally:  Hartford at number 55; Norwalk at number 82; Bridgeport at number 85; New Britain at number 91 and Waterbury, which was ranked at number 92.  Lower down the list were Stamford, ranked number 221 and Danbury,  which came in at number 229.

New Haven debuted Connecticut’s first protected bike lanes a year ago, according to published reports, from City Hall to Long Wharf, and city officials have said  “New Haven encourages alternative transportation options in the city so there is a variety of existing supported infrastructure available, including off-street shared use paths, on-street bicycle lanes, a contra-flow bike lane, bike boxes at intersections, on-street bike corrals, bike racks on sidewalks, bike racks on parking meters and bike racks on buses.”

"New Haven likely fared well due to their bike laws, a high percentage of spending per capita on bike lanes and their low percentage of fatal crashes," said Laura Schmitz, Safety Writer with Your Local Security. "The city of New Haven should be proud of their efforts to make their city safer for cyclists!"

The city also launched a bike sharing program this year, in February, and celebrated National Bike to Work Day in May with a program encouraging bike riding.  In addition, Yale University is a Gold-level Bicycle Friendly University, as awarded by the League of American Bicyclists, and the city has developed on-line bike route maps.

The safest city in Massachusetts, Somerville, ranked number 58.  Providence was the safest in Rhode Island, but ranked number 482 on the national list.  Syracuse was determined to be the safest in New York State, ranking number 537.

The rankings were issued by yourlocalsecurity.com, an ADT Authorized Premier Provider.  To determine the safest and least safe US cities for bikers, metrics and data were used from Census.gov, the National Highway Traffic Safety Administration, People for Bikes, and The League of American Bicyclists to find the percentage of bike commuters, number of fatal crashes, amount of bike lanes, and what bike laws are in place or in the works in each city.

At the bottom of the list, the ten most dangerous cities included Los Angeles, New York, Houston, and five cities in Iowa.  Cities were included if these sources had data for them. Cities included had populations of 20,000 or more.