Traffic Deaths at 4-Year High in Connecticut

The Connecticut Crash Data Repository (CTCDR) reports that the number of traffic deaths in Connecticut through December 22 in 2016 is the highest in the past four years.crash-logo The CTCDR is a web tool designed to provide access to select crash information collected by state and local police. This data repository enables users to query, analyze and print/export the data for research and informational purposes. The CTCDR is comprised of crash data from two separate sources; the Department of Public Safety (DPS) and the Connecticut Department of Transportation (CTDOT).

The latest data reports a total of 301 traffic deaths in the state this year, compared with 273 through the same date in 2015; 245 in 2014 and 278 in 2013, all through December 22. It is the second consecutive annual increase in the number of traffic fatalities.

stats2The purpose of the CTCDR is to provide members of the traffic-safety community with timely, accurate, complete and uniform crash data. The CTCDR allows for complex queries of both datasets such as, by date, route, route class, collision type, injury severity, etc.

For further analysis, this data can be summarized by user-defined categories to help identify trends or patterns in the crash data. The site is maintained by the University of Connecticut.

Lead Poisoning Is A Problem for Connecticut Children, National Study Reveals

A Reuters news service examination of lead testing results across the country found almost 3,000 areas with poisoning rates far higher than in Flint, Michigan, which was the focus of national attention this year for its dangerously tainted water supply. reuters-investigates-logoThe review and analysis found at least seven areas in Connecticut, based on zip code geography, where the percentage of children found to have elevated lead levels exceeded – more than doubled – the percentage in Flint.

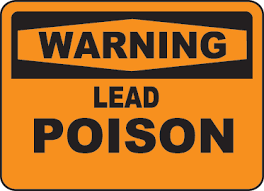
The Centers for Disease Control and Prevention (CDC) estimates that nationwide, around 2.5 percent of children ages 0-6 have an elevated lead level, defined as 5 micrograms/deciliter or higher. Among small children tested in Flint, Michigan during the peak of that city’s lead contamination crisis, 5 percent had elevated levels, or double the average.sign
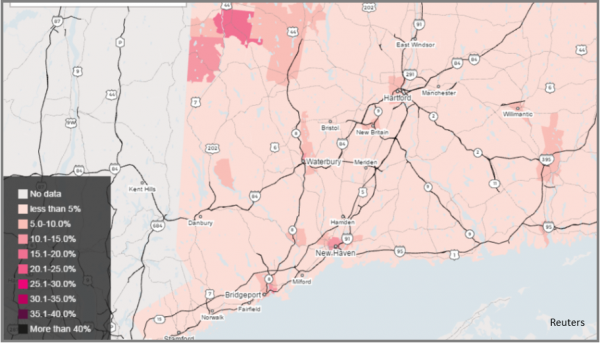
In many neighborhoods – census tracts or zip code areas – across the country, a far higher rate of children have tested high in recent years.  The zip codes in Connecticut with elevated lead levels in more than 5 percent of children tested include more than a dozen neighborhoods and communities scattered across the state, with the highest levels  in the towns of Canaan and Sharon, and the cities of Bridgeport, New Haven, and Waterbury.
mapThe State Department of Public Health website indicates that “childhood lead poisoning is the most common pediatric public health problem, yet it is entirely preventable. Once a child has been poisoned, the impairment it may cause is irreversible. Lead harms children’s nervous systems and is associated with reduced IQ, behavioral problems, and learning disabilities.”

Since the 1970s, U.S. efforts to eradicate childhood lead poisoning have made what Reuters describes as “remarkable progress,” while pointing out that “the advances have been uneven.”  Legacy lead – in paint, plumbing, yards, well-water or even playgrounds – means that kids in many neighborhoods remain at a disproportionately high risk of poisoning, the news service report explained.

The news service conducted a nationwide analysis of childhood blood lead testing data at the neighborhood level. Census tract or zip code level data reflecting the local prevalence of elevated lead tests was obtained from 21 states, including Connecticut.  The highest prevalence was found in:

Zip Code                              Tested Children /Elevated Results

06031 Canaan                    107 / 15.89%

06608 Bridgeport            8,602 / 13.32%

06511 New Haven            15,731/12.88%

06519 New Haven            8,318 / 11.95%

06607 Bridgeport             4,079/10.9%

06710 Waterbury             6,133/ 10.48%

06069    Sharon                  137 /10.22%

Across the country, Reuters found nearly 3,000 areas with recently recorded lead poisoning rates at least double those in Flint during the peak of that city’s contamination crisis. And more than 1,100 of these communities had a rate of elevated blood tests at least four times higher.

Reuters reports that zip codes have average populations of 7,500. In each area, a relatively small number of children are screened for lead poisoninglead_free_kids_logo_web each year, the report indicated.

The poisoned places stretch from Warren, Pennsylvania, a town on the Allegheny River where 36 percent of children tested had high lead levels, to a zip code on Goat Island, Texas, where a quarter of tests showed poisoning, the Reuters analysis indicated. In some pockets of Baltimore, Cleveland and Philadelphia, where lead poisoning has spanned generations, the rate of elevated tests over the last decade was 40 to 50 percent.

“I hope this data spurs questions from the public to community leaders who can make changes,” said epidemiologist Robert Walker, co-chair of the CDC’s Lead Content Work Group, which analyzes lead poisoning nationwide. “I would think that it would turn some heads.”

The findings, Walker told Reuters, will help inform the public about risks in their own neighborhoods and allow health officials to seek lead abatement grants in the most dangerous spots.

Congress recently directed $170 million in aid to Flint - 10 times the CDC’s budget for assisting states with lead poisoning this year, Reuters reported.
Efforts Forge Awareness From Tragedy, As CT Nonprofit Stresses Fire Safety

Jeff Block founded One Innocent Life, a Connecticut-based nonprofit organization, 18 months ago while battling for a new state law to improve Connecticut fire safety standards. He has been campaigning for fire safety in Connecticut homes since 2012, when his daughter, Eva, of Woodbridge, and two friends, died in a fire in their off-campus housing at Marist College in upstate New York on January 21st.  Approximately 66 percent of students attending college in the U.S. live in off-campus housing, according to the Center for Campus Fire Safety Student Committee.

His efforts led to legislation in Connecticut, but One Innocent Life is continuing to advocate for greater awareness, in Connecticut and beyond, on campuses and in local communities.bd76ed_cc7948303b504bd8830d8774cae99184

According to the National Fire Protection Association, U.S. fire departments responded to an estimated annual average of 3,870 structure fires in dormitories, fraternities, sororities, and barracks between 2009 and 2013.  From 2000 - 2015, 89 fires that killed 126 people have occurred on a college campus, in Greek housing or in off-campus housing within three miles of the campus. Of these, 76 off-campus fires caused 107 deaths, while 7 on-campus building or residence hall fires claimed 9 victims and 6 fires in Greek housing took the lives of 10 people.

Public Act 15-5, approved by the Connecticut legislature in the June 2015 Special Session, took effect on October 1, 2015.  The law requires landlords to include a notice in each dwelling unit's lease disclosing whether the unit has a working fire sprinkler system. If a unit has a working system, the lease must also include a notice indicating the date of its last maintenance and inspection. Both notices must be printed in a uniform font of at least 12-point, boldface type.

Under the state law, a “fire sprinkler system” is a system of piping and appurtenances designed and installed according to generally accepted standards so that heat from a fire automatically causes water to discharge over the area, extinguishing the fire or preventing it from spreading.

There were seven college students in the rental house that night in Poughkeepsie. Four made it out. New Canaan resident Kevin Johnson, a student at Duchess Community College at the time, Kerry Fitzsimmons, a Marist senior from Long Island, and Eva Block, a Marist senior, did not. “One Innocent Life is dedicated to raising awareness about the living conditions of college students, involving fire safety,” the organization’s website explains.

“The annual number of fires in dormitories, fraternities, sororities and barracks reported to U.S. fire departments has been substantially higher in recent years than any time prior to 2000,” the NFPA’s Richard Campbell said in August 2016.

The National Fire Prevention Association suggests that students renting off campus housing – and other renters – ask the following of landlords:

  • Does every room have a smoke alarm?
  • What is the power supply to the detector (hardwire/battery/both)?
  • Who provides the battery replacement?
  • Does the off-campus housing have sprinklers and fire extinguishers?
  • What is your disciplinary policy toward tenants who cause false alarms or fail to evacuate during an alarm?
  • Do the rooms have enough outlets with enough power to feed energy needs?
  • Can the exit doors be opened from the inside without a key?
  • What fire safety training does your building staff receive?

One Innocent Life's video to extend awareness, made with the help of Wesleyan University, the City of Middletown Professional Firefighters Local 1073, includes more than a dozen volunteers from Connecticut.

https://youtu.be/9tVQGDyzUHQ

State Steps Up to Help Residents Locate What’s Lost

Connecticut’s Office of State Treasurer has long been responsible for what is described as “unclaimed property” – assets that rightful owners have lost track of – as well as efforts to reunite people with their money.  Now, the State Department of Insurance is getting into the “lost and found” business, too. Insurance Commissioner Katharine L. Wade has announced that the Department is offering a free online service to help consumers search for a deceased family member’s lost life insurance policies and annuities.connecticut-insurance-department-logo-2

“It can be a frustrating and overwhelming process at times to locate a missing policy. Whether you are settling the estate of a deceased loved one or trying to help an elderly relative sort out his or her affairs, the Department has resources to help,” Commissioner Wade said. “We are pleased to offer this latest tool that will streamline and simplify the process while protecting confidentiality.”

The Department’s  Frequently Asked Questions    will help consumers through the process. Consumer requests to find a lost policy are encrypted and secured to maintain confidentiality. Participating insurers will compare submitted requests with available policyholder information and report all matches to state insurance departments through the locator. Companies will then contact beneficiaries or their authorized representatives within 90 days.

The Life Insurance Policy Locator, developed by the National Association of Insurance Commissioners (NAIC), provides free nationwide access for help in finding old policies and annuities. There are an estimated $1 billion in benefits and life insurance policies that are unclaimed in the U.S.

ct-big-list-logoAlso this month, the State Treasurer’s office is closing the year with a push urging consumers to check the agency’s CT Big List to determine if misplaced assets can be claimed.  State Treasurer Denise L. Nappier said the special online publication is one component of the Treasury’s efforts to reunite rightful owners with their unclaimed property and is available through its homepage, www.ott.ct.gov.

The mission of the Treasury’s Unclaimed Property Division is to safeguard assets until rightful owners step forward to claim them. Unclaimed property includes money from uncashed payroll checks, bank accounts and utility deposits, insurance proceeds, liquidated assets from safe deposit boxes, stocks, and bonds.

The electronic special edition at www.CTBigList.com has 49,729 names with property valued between $50 and $100; 36,467 names with property valued between $100 and $500; 4,941 names with property valued between $500 and $1,000; 3,538 names with property valued between $1,000 and $5,000; and 551 names with property valued greater than $5,000. Five owners have unclaimed property valued at more than $100,000, with two having property valued at more than $250,000.

The Treasury’s interactive website, www.CTBigList.com, contains the complete list of about 1.5 million names of individuals and entities that may be entitled to as much as $807 million in unclaimed property. The website features a searchable database -- updated with new names weekly -- that makes it easy for residents to find their names. Often, people are unaware that they have inherited money, and others may simply have forgotten an old savings account or payroll check that went uncashed, officials point out.

Treasurer Nappier emphasized, “Searching the Treasury’s unclaimed property website is free.” She said that state residents are regularly contacted by firms, often called “finders,” offering search services for fees that go as high as 10 percent of assets recovered – and that some individuals hire these firms, believing it is the only way to recover lost assets.

“But that’s not true. My advice is that before you send your hard earned money to strangers, check out the CT Big List first – there is no charge for this public service,” Treasurer Nappier said.

CT Residents See Regionalism as Viable Option for Local Services; Highway Improvement A Transportation Priority

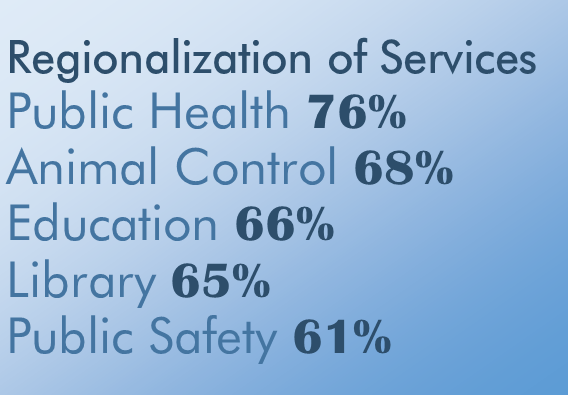
Connecticut residents believe that some services traditionally handled by individual municipalities  can be effectively delivered regionally.  A new statewide survey found that public health earns the most support for a regional approach and public safety the least.  More than 3 in 4 people (76%) say that public health services can be provided on a regional basis, followed by animal control (68 percent) and education (66 percent).  The survey found that 65 percent of state residents believe that library services can be delivered regionally, and 61 percent share that view regarding public safety services. The survey for InformCT, a public-private partnership that provides independent, non-partisan research, analysis, and public outreach, was administered by researchers from the Connecticut Economic Resource Center, Inc. (CERC) and Smith & Company.  The analysis is based on the responses of survey of 510 state residents, with a margin of error of 5 percent. logl

Survey respondents were asked about regionalization of services in surveys conducted in the first three quarters this year, and support was generally consistent – respondent’s views of regionalizing the various services did not vary more than four percentage points for any of the policy areas during that time.  Favorability of regionalization of public health services has increased each quarter, while regionalizing education has increased from Quarter 1.  While support for regional public safety services has also increased from Quarter 1, it received the least support among the services queried in each survey.  Only regionalizing libraries has seen a decline from the first quarter, and preferences for regionalizing animal control has held steady.

stats“Increasingly, towns will not be able to afford to sustain the level of services to which they have become accustomed, as budget pressures increase along with a reluctance to raise taxes. Residents showed concern, and a willingness to consider regionalism as a partial solution,” said Robert W. Santy, who serves as Board Chair of Inform CT and is President & CEO of the Connecticut Economic Resource Center (CERC) Inc.

The  also found that the most important factor when choosing a town in which to live, is property taxes, followed by the quality of the school system.  Those factors earned 53 percent and 51 percent of respondents, respectively, who describe the factor as “very important” - the only aspects  described as very important factor by a majority. Other factors deemed very important include recent appreciation of home values (30 percent), proximity to transportation and employment (29 percent) and proximity to entertainment ad amenities (24 percent).

The survey  also asked about transportation in Connecticut, finding that 74 percent said they use their car almost every day.  Other modes of transportation were not nearly as popular.   More than 80 percent indicated that they had used a local bus (86%), long distance bus (91%), commuter rail (87%), Amtrak (92%), an airplane (92%) or a bicycle (82%) only once, or not at all, in the past month.  Regarding state spending to improve transportation, respondents ranked highway improvements as the highest priority by a wide margin, with commuter rail, local bus, and bicycle lanes/pedestrian walkways, ranked next highest.  Highway improvements was described as the highest priority by more respondents than the other six options combined.


PERSPECTIVE: Municipality Prevails as Fire Department Takes Over Ambulance Services in Milford

by David Slossberg In a first-of-its kind decision in Connecticut, the state has granted a municipality’s petition to revoke the basic level transport license of its national ambulance provider and reassign that license to its superior municipal fire department.  This pioneering effort was championed by the City of Milford, which now benefits from complete municipal control over the operation of, and revenue from, the provision of emergency medical services within its boundaries.

The City of Milford filed a petition with the Connecticut Department of Public Health (”DPH”)  in December 2014 requesting that it assign the Milford Fire Department as the City’s primary service area (“PSA”) responder for basic level ambulance service, a change that meant ousting American Medical Response (AMR), which had held the PSA license for Milford since 1995.CT perspective

The City filed its petition pursuant to a newly enacted statute that gives municipalities the right to petition for removal and reassignment of its primary service area responders.  The City presented written briefs, testimony and oral arguments explaining why and how provision of ambulance service by its Fire Department would effectively maintain or improve patient care in the area.  Problems cited included AMR’s delayed response times, refusal to negotiate a service contract with improved standards, and failure to provide a bariatric ambulance (a specially-outfitted ambulance to accommodate the severely obese).

After nearly two years of proceedings before the DPH, the State agreed that the Milford Fire Department is better suited to meet community needs. The finding is based on Milford Fire Department’s plan for additional ambulances, considerably shorter response times, increased personnel training requirements, decreased costs, and more intense scrutiny of performance standards.

q2This decision is particularly important because it focuses emergency response on patient care, and makes clear that communities can have cost effective emergency services tailored to local needs that does not have to be compromised by the bottom line financial concerns of a large, national company.

I believe the decision is an effective first step towards breaking up AMR’s monopoly in the region. Over the last 15 years, AMR has compiled regional strongholds by buying smaller, local ambulance companies.  However, as it has become more regionally based, it has also become less responsive to the needs of local communities like Milford.  By controlling the primary service area, municipalities can either provide services themselves at standards suitable for their citizens, or place those services out to bid at standards set by the municipality.  That effectively prevents companies like AMR from citing, among other things, the costs to provide ambulance coverage on a regional basis and labor issues as reasons why they cannot agree to meet faster response times and more rigorous performance review and reporting requirements.  If they want the work, they must meet these higher standards.

The final decision of the Commissioner of the Department of Public Health transferred control of the basic level ambulance service in Milford to the Milford Fire Department in mid-October.  The City has now implemented its plan to the benefit of its residents.  Emergency responders currently serve the city’s population of some 55,000 in an area of approximately 26 square miles.

Milford Mayor Ben Blake lauded the decision, emphasizing that “it is a culmination of almost two years of hard work to develop a better response system for our residents and secures important advancements that will benefit patients and taxpayers.”

Of the victory, Milford’s Fire Chief, Douglas Edo said,” It was important for the City of Milford to have control over these services, which are so crucial to the public’s health and safety.  We are thrilled that the issue was decided in our favor to the great benefit of our community.”

_____________________________________

Atty. David Slossberg is a named partner in the Milford-based law firm Hurwitz, Sagarin, Slossberg and Knuff, LLC. He can be reached at 203-877-8000.


PERSPECTIVE commentaries by contributing writers appear each Sunday on Connecticut by the Numbers.

Seven CT Businesses Among 500 Fastest Growing Tech Companies in US

Where in Connecticut are the fastest growing technology companies?  New Haven, Branford, Trumbull, Madison, Norwalk, and Farmington. Seven Connecticut companies earned a ranking rank on the recently released 2016 Technology Fast 500 rankings of the fastest-growing tech companies in North America, compiled by professional-services firm Deloitte.  That’s the same number of Connecticut firms on last year’s list.

Four of the state’s representatives produce software, aligning with the dominance of that sector, with some 58 percent of this year’s Fast 500 companies in software. Two of the Connecticut companies work in biotechnology, which comprised the second-most represented segment on the list, covering 13 percent of firms.tech-list

New Haven-based Achillion Pharmaceuticals ranked highest among Connecticut companies, at No. 43, posting 2,436 percent growth. It was ranked #12 among biotechnology/Pharmaceutical companies. Achillion Pharmaceuticals, Inc. is a "science-driven, patient-focused company leveraging its strengths across the continuum from drug discovery to commercialization to provide better treatments for people with serious diseases," according to the company website.  achillion-color-logo

Following at No. 239, Farmington-based Evariant Software recorded a 303 percent increase. Next came HPOne, a Trumbull health-insurance solutions firm, which recorded 199 percent growth.  Madison's Clarity Software Solutions was No. 385, Norwalk-based software company etouches ranked No. 461, with 132 percent growth.  Rounding out the Connecticut tech firms earning a slot among the top 500 were Branford-based Core Infomatics at No. 469 and Alexion Pharmaceuticals, now headquartered in New Haven, at No. 473.

New York City and California firms accounted for nine of the top 10 companies on the list. By region, the San Franciso Bay area had 20 percent of the companies, New York 17 percent,  Los Angeles 8 percent,  Washington 6 percent and New England 5 percent.

Los Angeles-based Loot Crate, which delivers entertainment and pop culture-themed collectibles, ranked No. 1 overall, with 66,661 percent growtdeloitteh between 2012 and 2015. Founded in 2012, Loot Crate has more than 650,000 subscribers worldwide in 35 countries. The ranking summary points out that "Loot Crate’s position at the top of this year’s list showcases how innovation isn’t always about new technology and invention, but also about ingenuity, the recombining of existing assets, and know-how in new ways to maximize value."

Yieldbot, a New York City-based company focused on media, ranked No. 2.

"Amid a fierce business climate, there seems to be no shortage of new and established companies that are unlocking a seemingly unlimited potential for growth and advancement through technology’s continued disruption and proliferation across industries," said Sandra Shirai, principal, Deloitte Consulting LLP and US Technology, Media, & Telecommunications leader.

mapThe focus of the Connecticut firms that made this year’s list reflected the overall composition of the rankings, which were based on companies’ revenue growth between 2012 and 2015.  Software continues to have the greatest impact across technology sectors, representing 58 percent of the entire list and five of the top 10 winners overall.

"Combining technological innovation, entrepreneurship, and rapid growth, Fast 500 companies—large, small, public, and private—hail from cities far and wide across North America and are disrupting the technology industry," the introduction to the rankings emphasized.sector


Rate of Success Obtaining Venture Capital is High in Hartford, Study Finds

A look at the nation’s 50 largest metropolitan areas to see how entrepreneurs have fared in their quests to secure money from venture capitalists, angel investors, and online crowds brought a somewhat surprising result – among the cities mentioned as ranking high in venture funding success rates was Hartford. Connecticut’s Capitol was listed among a handful of cities with success rates for businesses seeking venture capital that “are about twice as high as the national average.” According to a new report issued this month by the Kauffman Foundation, roughly $68 billion was invested in venture capital (VC) deals in the United States in 2014 and 7,878 employer businesses reported receiving venture capital funds. Thirty percent of those recipients were located in just four metro areas: New York, Los Angeles, San Francisco, and Boston. The national average was 0.2%.vc

Among the metro areas that rank highly in terms of those venture funding success rates, according to the report “Trends in Venture Capital, Angel Investing and Crowdfunding,” include: San Francisco, CA (0.8%), San Jose, CA (0.8%), Boston, MA (0.5%), Hartford, CT (0.5%), Memphis, TN (0.4%), Minneapolis, MN (0.4%), Philadelphia, PA, (0.4%), Richmond, VA (0.4%), Washington, D.C. (0.4%). Among the lowest ranked of the 50 largest metropolitan regions in the nation, at 0.1 percent, were Baltimore, Denver, Jacksonville, Las Vegas, Orlando, Riverside, and Tampa.

The report noted that “Some perhaps unlikely metro areas rank highly in terms of those venture funding success rates: Hartford, Memphis, Richmond, and Buffalo. This doesn’t necessarily mean that there are higher quality firms there, and, of course, the volume of firms seeking VC is smaller…And, these data don’t mean that all the funding came from local sources: venture capital firms in New York could be investing in Hartford businesses. But these numbers lend credence to arguments…that high-quality deals can be found everywhere, and that firms in these regions can succeed in raising equity capital.”

While 10.3 percent of entrepreneurs report using personal credit cards when starting their business, nationally, only 0.6 percent initially received venture capital, the analysis found.

The metros with the highest percentage of firms receiving venture capital funding when starting include: San Jose (2.4%), San Francisco (1.5%), Salt Lake City (1.3%), Austreportin (1.2%), Baltimore (1.1%), Birmingham (1.1%), and Nashville (1.1%).

According to the report, based on the 2014 Annual Survey of Entrepreneurs (ASE), “the primary sources of initial financing for new businesses in the United States are: personal and family savings, bank business loans, and personal credit cards.”  The report notes, however, that “entrepreneurs also tap other sources of funding, including venture capital, which “can be disproportionately important for business growth.”

The ASE, conducted by the U.S. Census Bureau, is the largest annual survey of American entrepreneurs ever done, and is done in a public-private partnership between the Census Bureau, the Kauffman Foundation, and the Minority Business Development Agency. The ASE samples approximately 290,000 employer businesses across all U.S. geographies and demographics, the report explained.

The top metropolitan statistical area for crowdfunding success in 2014 was Charlotte; for angel investing, San Jose led the way.  The report concludes that the concentration of venture capital firms in California, Massachusetts, and New York, “is well-correlated with the relative concentration of firms that receive VC investments.” Crowdfunding campaigns in Minneapolis and Oklahoma City, the report indicates, “may not be entirely due to local funders.”

“The ASE data add quantitative confirmation to what we know from other sources: high-quality entrepreneurs can be found—and can get funding—in nearly every corner of the United States.”

Including Hartford.

CT is Among 24 States Seeing Weak Revenues, Highest Number Since Recession

Connecticut is not alone. According to the National Association of State Budget Officers’ (NASBO) annual state spending survey, half of all states saw revenues come in lower than budgeted in fiscal 2016 and 24 states – including Connecticut - are seeing those weak revenue conditions carry into fiscal 2017. the-chartThat is the highest number of states falling short of revenue projections since 36 states budgets missed their mark in 2010, according to the NASBO report and Governing.  As a result, 19 states made mid-year budget cuts in 2016, totaling $2.8 billion, Connecticut among them. That number of states “is historically high outside of a recessionary period,” according to the report.  The revenue slowdown is caused mainly by slow income tax growth, even slower sales tax growth and an outright decline in corporate tax revenue, the report explains, stating that “progress since the Great Recession has been uneven, and many states are seeing softening state tax collections.”fall-2016-fiscal-survey-cover

Overall, state spending totaled $786 billion last fiscal year, a 3.7 percent annual increase. Although it marks the seventh straight year of spending growth, it represents a slowdown from fiscal 2015 when spending increased by 4.4 percent.

“Weaker-than-anticipated revenue collections and resulting budget gaps in fiscal 2016 led some states to cut spending during the year,” the report indicated, with overall spending increasing just 1.8 percent to $781 billion in fiscal 2016, compared with the previous year’s growth of 5 percent. When accounting for inflation, 32 states are still spending less than they did before the Great Recession and total state spending also has yet to surpass pre-recession levels.  Across the states, cuts enacted by legislatures come most often in K-12 education, an “all other” category, followed by Medicaid, higher education and corrections, according to data compiled for the NASBO report.

The state has an estimated $1.3 billion or $1.5 billion budget deficit, according to reports from the governor’s Office of Policy and Management and the legislature’s nonpartisan Office of Fiscal Analysis, CTNewsJunkie reported recently.

“Certainly a recession is coming sometime soon,” said NASBO President-elect Michael Cohen, who is also California’s finance director, told Governing. “But I think economists in all of the state offices would tell you that’s a really hard economic forecasting [task] of predicting when that’s going to happen.”  NASBO had previously predicted that fiscal 2016 would mark the full recovery of state budgets from the recession, but the cutbacks and increased inflation has delayed that at least another year.

The report indicates that eight (including energy-producing states like Alaska, North Dakota and Oklahoma) planned to spend less in 2017, and 11 states planned to up their spending by 6 percent or more next year. In those states, sales tax increases have improved their revenue with Louisiana, for example, anticipating a 17 percent increase in revenue, driven by an expected $800 million increase in sales tax collections.

Most states have focused on strengthening their rainy day funds, according to the report, though some states – particularly energy-producing ones – have had to tap their reserves to help address budget shortfalls. Twenty-nine states increased their rainy day fund balances in fiscal 2016, and 25 states project increases in fiscal 2017. Since aggregate rainy day fund levels hit a recent low in fiscal 2010, 40 states had increased their amounts as of the end of fiscal 2016, at least in nominal terms, the report said.

“States will also have to contend with rising spending demands in areas such as health care and education, long-term pressures such as pensions and infrastructure, and increasing federal uncertainty,” the report predicted, “particularly concerning the prospects of tax reform and health care policy. In this environment, states are likely to be cautious in their spending and revenue forecasts, as they continue to focus on ensuring structurally balanced budgets.”

https://youtu.be/uAvz-zo9NQw

MA Overtakes CT, Jobs on Horizon for EB - Bad News, Good News for State Economy

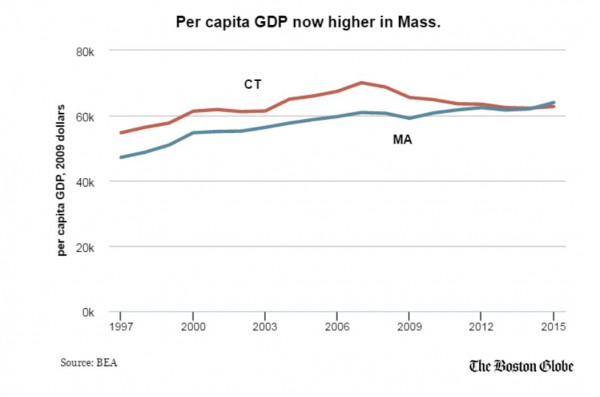
Connecticut is “in a rut”according to one regional newspaper, while another is reporting on plans by a local company to hire 14,000 workers during the next decade.  Bad news and good news, simultaneously. “Ten years ago, it was the undisputed economic king of New England, with average incomes 13 percent higher than Massachusetts and 40 percent above third-ranked New Hampshire,” the Boston Globe's data reporter says of Connecticut.  “Throughout the 1990s and 2000s, low- and middle-wage workers in Connecticut consistently took home bigger paychecks than their Massachusetts peers.  In the past few years all these economic advantages have disappeared. Unemployment is now far lower in Massachusetts. And Bay State employees get the best wages — whether you look at low-earners, top-earners, or those in the middle.”

The Globe cites recent housing data to underscore the point.

“Of all the cities tracked by the National Association of Realtors, 90 percent have seen their housing prices rise since 2010. That leaves just 17 metropolitan areas still trying to claw back from the recession. Four of those underwater markets are in Connecticut — and they extend to virtually every corner of the state, from Stamford in the southwest to New London in the east and as far north as Hartford.”economy

“Among the biggest changes in the Massachusetts economy,” the Globe column points out, “has been the explosion of professional, scientific, and technical services — think architects, engineers, software designers, consultants, and scientific researchers. Since 2000, this sector has grown by nearly 50 percent in Massachusetts, which is a key reason the state as a whole has performed so well. In Connecticut, these same fields have expanded by just 6 percent.”

Globe reporter Evan Horowitz, who writes the paper’s Quick Study column using data to discuss policy,  notes that “without a hub like Boston, Connecticut can’t simply pull pages from the Massachusetts playbook.”  He suggests that “a Trump-fueled surge in corporate profits and stock valuations could provide a much-needed boost to the state’s fortunes. But if there’s one lesson of recent years, it’s that counting on Wall Street excess to compensate for other economic ills is a dangerous strategy; bubbles burst, recessions happen, and in the absence of a long-term economic strategy, Connecticut could once again find itself floundering.”

A brighter ray of potential economic sunshine is reported by the Day of New London, outlining plans by General Dynamics Electric Boat in Groton for a massive decade-long hiring spree resulting from an increase in submarine orders by the U.S. Navy, spurred by “strong Congressional support.”

chart“The company will hire 14,000 new employees over the next 13 years,” the Day reports.  “Those employees will fill new positions and those being vacated by retirees and those who leave for other reasons. The burst in new hires will take EB from its workforce of 14,500 today to 18,000 in 2030.  This year alone, the company hired 1,600 new full-time employees. Another 800 received conditional job offers and are in the process of applying for a security clearance or awaiting that clearance.”

Reporter Julia Bergman indicates that “six different submarines are currently under construction there. Another is in for its ‘50,000 mile checkup.’ And an eighth is undergoing a major overhaul.”

The work – and the jobs – extend beyond EB.sub

“While the engineering workforce has neared its peak, EB will continue to hire a larger number of shipyard personnel such as welders, machinists, and electricians,” the Day reports. “About 40 percent of this year’s new hires were tradespeople.”  Training programs and local colleges are straining to meet the demand, the newspaper reports.

Underscoring the importance of healthcare to Connecticut’s economy, there is a new number one employer (by number of employees) in the state, according to published reports.  A year ago, United Technologies was the largest employer in Connecticut, according to 24/7 Wall Street.  After selling its helicopter division, Sikorsky, UTC’s employee headcount dropped from around 24,500 to an estimated 16,000. With 20,396 total employees, Yale New Haven Health is now the largest employer in Connecticut, the publication notes.  Yale New Haven Health includes Bridgeport Hospital, Greenwich Hospital, Yale New Haven Hospital, Yale New Haven Children's Hospital, Smilow Cancer Hospital at Yale New Haven and Yale New Haven Psychiatric Hospital.  The Hartford Business Journal last year ranked Hartford Healthcare, with 18,000 employees, just behind Yale New Haven Health.  Hartford Healthcare acute care facilities include Backus Hospital, Hartford Hospital, The Hospital of Central Connecticut, MidState Medical Center and Windham Hospital.