CT Residents Have Among the Highest State & Local Tax Burdens in US

Two separate analyses of tax burdens across the nation’s 50 states have placed Connecticut in the top ten – among those with the highest state and local tax burden.  The state-by-state reviews, by the financial websites 24/7 Wall Street and WalletHub, rank Connecticut second and sixth respectively. “With some of the wealthiest neighborhoods in the country, Connecticut residents pay more in property taxes than in nearly any other state,” says 24/7 Wall St. in its review. “Residents pay $2,774 per capita in property taxes, almost twice the national average. The state’s effective property tax rate of 1.7% of the value of a typical Connecticut home is the sixth highest of any state. Despite the high tax burden overall, the state’s pension system is relatively underfunded. Connecticut has just 51% of the funding for its pension obligations, the fourth smallest share nationwide.”

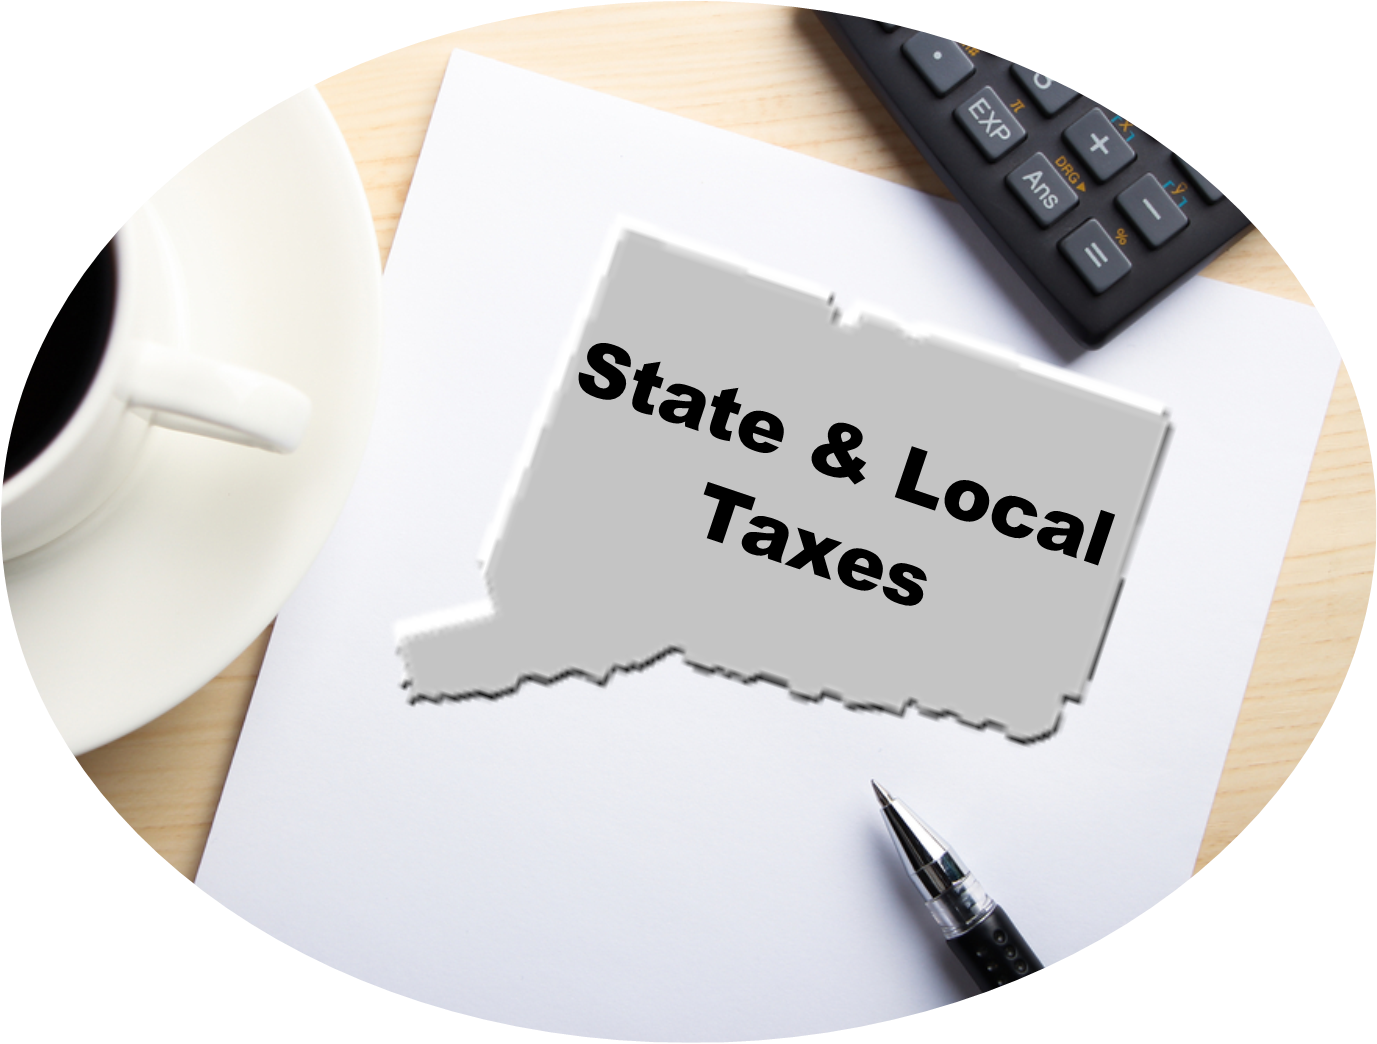
The Connecticut financial highlights include:

  • Taxes paid as pct. of income: 12.6%
  • Income per capita: $68,704 (the highest)
  • State income tax collections per capita: $2,279 (the highest)
  • Property tax collections per capita: $2,774 (3rd highest)
  • General sales tax collections per capita: $1,137 (8th highest)

In the 24/7 Wall Street report, the highest tax burden was attributed to New York.  Rounding out the top ten after Connecticut were New Jersey, Wisconsin, Illinois, California, Maryland, Minnesota, Rhode Island and Oregon.

The WalletHub rankings, using a somewhat different methodology, ranked Connecticut has having the 6th highest tax burden among the states.  Include were these snapshots of Connecticut (the higher the ranking the lower the rate):

  • 46th – Overall Effective State & Local Tax Rate
  • 33rd – Income Tax
  • 34th – Sales & Excise Taxes

The highest tax burdens were in Illinois, Nebraska, Wisconsin, New York, Rhode Island, Connecticut, Ohio, Michigan, Iowa and New Jersey.  In order to identify the states with the highest and lowest tax rates, WalletHub’s analysts compared the 50 states and the District of Columbia across four types of taxation, real estate tax, vehicle property tax, income tax and sales & excise tax.

Schools of Distinction in Connecticut; 116 Earn Designation

Over 100 schools statewide across Connecticut have been recognized by the Connecticut State Department of Education (CSDE) as 'Schools of Distinction' for the 2015-2016 school year. The state recognized 116 schools for high academic achievement and high growth, including 15 schools within the state's Alliance District program. The state's alliance district program is a targeted investment in Connecticut's 30 lowest-performing districts.

To qualify for the distinction designation, schools cannot have high achievement gaps or high graduation rate gaps, and must also meet participation rate requirements.  'Schools of Distinction' are schools that meet the following criteria, according to the CSDE.

  • the top ten percent of schools using the Accountability Index score;
  • the top ten percent of schools with the highest growth for all students or for the high-needs group (free or reduced price lunch, English language learners, and students in special education); or
  • the top ten percent of schools (among those without growth) with improvement in Accountability Index.

Danbury, Greenwich and Ridgefield have six schools each on the list, the most of any district in the state.

Shelton, Stratford and Trumbull had four schools among those designated, and Glastonbury and Regional School District 12 each had three schools earn a slot on the list.  West Hartford had three schools named, Braeburn, Bugbbee and Whiting Lane..

Two Capital Region Education Council (CREC) schools made the list, The Ana Grace Academy of the Arts Elementary School and the University of Hartford Magnet School.  CREC renamed one of its magnet schools in 2014 in honor of Ana Grace Marquez-Greene, a former Hartford resident who was among the young victims of the Sandy Hook school shooting.


2015-2016 Schools of Distinction

  • Anna H. Rockwell School, Bethel
  • Frank A. Berry School, Bethel
  • Bolton High School, Bolton
  • Mary R. Tisko School, Branford
  • Brass City Charter School, Waterbury
  • Ana Grace Academy of the Arts Elementary School, Avon
  • University of Hartford Magnet School, West Hartford
  • Chapman School, Cheshire
  • Norton School, Cheshire
  • Lewin G. Joel Jr. School, Clinton
  • M. Wright Technical High School, Stamford
  • Ellsworth Avenue School, Danbury
  • Hayestown Avenue School, Danbury
  • Mill Ridge Primary School, Danbury
  • Morris Street School, Danbury
  • Park Avenue School, Danbury
  • South Street School, Danbury
  • Ox Ridge Elementary School, Darien
  • Royle Elementary School, Darien
  • Tokeneke Elementary School, Darien
  • East Haddam Elementary School, East Haddam
  • Dominick H. Ferrara School, East Haven
  • East Lyme High School, East Lyme
  • Lillie B. Haynes School, East Lyme
  • Niantic Center School, East Lyme
  • Windermere School, Ellington
  • Burr Elementary School, Fairfield
  • Timothy Dwight Elementary School, Fairfield
  • Jennings School, Fairfield
  • Riverfield School, Fairfield
  • East Farms School, Farmington
  • Noah Wallace School, Farmington
  • Union School, Farmington
  • West District School, Farmington
  • Eastbury School, Glastonbury
  • Hopewell School, Glastonbury
  • Nayaug Elementary School, Glastonbury
  • Wells Road Intermediate School, Granby
  • International School at Dundee, Greenwich
  • North Mianus School, Greenwich
  • North Street School, Greenwich
  • Old Greenwich School, Greenwich
  • Parkway School, Greenwich
  • Riverside School, Greenwich
  • Northeast Academy Elementary School, Groton
  • B. Butler School, Groton
  • Guilford Lakes School, Guilford
  • Regional Multicultural Magnet School, New London
  • Litchfield Intermediate School, Litchfield
  • Southeast Elementary School, Mansfield
  • Casimir Pulaski School, Meriden
  • Thomas Hooker School, Meriden
  • Orange Avenue School, Milford
  • Pumpkin Delight School, Milford
  • Oakdale School, Montville
  • Western School, Naugatuck
  • East School, New Canaan
  • New Canaan High School, New Canaan
  • West School, New Canaan
  • Conte/West Hills Magnet School, New Haven
  • Anna Reynolds School, Newington
  • Hawley Elementary School, Newtown
  • Green Acres Elementary School, North Haven
  • Ridge Road Elementary School, North Haven
  • North Stonington Elementary School, North Stonington
  • Wheeler High School, North Stonington
  • Samuel Huntington School, Norwich
  • Thomas W. Mahan School, Norwich
  • Kathleen E. Goodwin School, Old Saybrook
  • Moosup Elementary School, Plainfield
  • Plainfield Central School, Plainfield
  • Plymouth Center School, Plymouth
  • Brownstone Intermediate School, Portland
  • Redding Elementary School, Redding
  • Harwinton Consolidated School, Harwinton
  • Booth Free School, Roxbury
  • The Burnham School, Bridgewater
  • Washington Primary School, Washington Depot
  • Burr District Elementary School, Higganum
  • Haddam Elementary School, Higganum
  • Lyme Consolidated School, Lyme
  • Mile Creek School, Old Lyme
  • Barlow Mountain Elementary School, Ridgefield
  • Branchville Elementary School, Ridgefield
  • Farmingville Elementary School, Ridgefield
  • Ridgebury Elementary School, Ridgefield


  • Scotland Elementary School, Ridgefield
  • Veterans Park Elementary School, Ridgefield
  • West Hill School, Rocky Hill
  • Chatfield-LoPresti School, Seymour
  • Booth Hill School, Shelton
  • Elizabeth Shelton School, Shelton
  • Long Hill School, Shelton
  • Sunnyside School, Shelton
  • South Windsor School District, Pleasant Valley School
  • Eli Whitney School, Stratford
  • Nichols School, Stratford
  • Second Hill Lane School, Stratford
  • Stratford Academy - Johnson House, Stratford
  • Booth Hill School, Trumbull
  • Jane Ryan School, Trumbull
  • Middlebrook School, Trumbull
  • Tashua School, Trumbull
  • Yalesville School, Wallingford
  • Braeburn School, West Hartford
  • Bugbee School, West Hartford
  • Whiting Lane School, West Hartford
  • Edith E. Mackrille School, West Haven
  • Seth G. Haley School, West Haven
  • Daisy Ingraham School, Westbrook
  • Coleytown Elementary School, Westport
  • Green's Farms School, Westport
  • Alfred W. Hammer School, Wethersfield
  • Wilton High School, Wilton
  • B. Sweeney School, Windham
  • Frisbie School, Wolcott


PERSPECTIVE: Is Your School Fresh Check Day Cool?

by Rachel Papke Most people are surprised to learn that suicide is the second leading cause of death for individuals between the ages of 15-24.

The Jordan Porco Foundation’s mission is to prevent suicide, promote mental health, and create a message of hope for young adults. They accomplish this by providing engaging and uplifting peer-run programs on college campuses. Their signature program is Fresh Check Day.

Fresh Check Day is an uplifting mental health promotion and suicide prevention event that includes interactive expo booths, peer-to-peer messaging, support of multiple campus departments and groups, free food, entertainment, and exciting prizes and giveaways.

Fresh Check Day aims to create an approachable and hopeful atmosphere where students are encouraged to engage in dialogue about mental health and helps to build a bridge between students and the mental health resources available.

The program’s primary goals are to:

  • Increase awareness of mental health resources and services available to students
  • Reduce stigma and misconceptions around mental health and suicide that often deter individuals from seeking help
  • Empower peers to be gatekeepers by understanding warning signs and knowing what to do if a friend is exhibiting signs of suicide or a mental health concern
  • Increase willingness to ask for help if experiencing emotional distress

The Jordan Porco Foundation does not charge a fee for service for Fresh Check Day in consideration of varying capacities to fund large-scale mental health programming. Instead, they provide significant support and ask participating schools to provide the remaining essential components within their budgetary means.

This year they experienced incredible growth. They expanded Fresh Check Day to a national reach that includes 14 states, with 58 events this year alone. Currently, they have signed-on 90 schools in 28 states, plus the District of Columbia, and counting.

In Connecticut, 22 institutions are participating, including:  Gateway Community College on April 11, the University of Hartford on April 12, Norwalk Community College on April 19, University of Saint Joseph on April 19, University of Connecticut on April 22, Sacred Heart University on April 28, Three Rivers Community College on September 20, Connecticut College on September 22, Quinnipiac University on October 6, and Central Connecticut State University on October 17.

What can you do?  Bring Fresh Check Day to your school. You can connect with Student Activities, Residential Life, Health Services, your school’s counseling services, or anyone you can think of on campus, and have them get in touch with the Jordan Porco Foundation. Or, you can e-mail the Jordan Porco Foundation at info@jordanporcofoundation.org to introduce yourself, and the programming staff will help you.

“This was an eye opening experience,” said one college participant.  “It helped me feel like I wasn’t alone.”  Added another: “As someone whose mental health had limited my life for some time, I want you to know that these things change lives.  Your event made people feel valued and important and cared about.  You may never hear thank you from everyone that today changed their life but I can promise you our campus is a safe place because of Fresh Check Day.”

_________________________________

Rachel Papke is Communications Coordinator at the Jordan Porco Foundation

The Jordan Porco Foundation is a 501(c) (3) public charity. Their programs strive to start a conversation about mental health that reduces stigma while encouraging help-seeking and supportive behaviors.  Tickets to Jordan’s Journey Gala, their annual event in support of the Jordan Porco Foundation’s lifesaving programs are now available.  The event is on March 25.  Learn more at jordanporcofoundation.org or (860) 904-6041.


Get Ready for April Showers – and More, UConn Researcher Says

A University of Connecticut climate scientist confirms that more intense and more frequent severe rainstorms will likely continue as temperatures rise due to global warming, despite some observations that seem to suggest otherwise. In a research paper appearing this week in the journal Nature Climate Change, UConn civil and environmental engineering professor Guiling Wang explains that data showing the intensity of severe rainstorms declining after temperatures reach a certain threshold are merely a reflection of climate variability. It is not proof that there is a fixed upper temperature limit for future increases in severe rains, after which they would begin to drop off.

"We hope this information puts things in better perspective and clarifies the confusion around this issue," Wang told UConn Today.  "We also hope this will lead to a more accurate way of analyzing and describing climate change," said Wang, who led an international team of climate experts in conducting the study, funded by the National Science Foundation’s Division of Atmospheric and Geospace Sciences.

Climate scientists and policymakers closely monitor severe and prolonged rainstorms as they can have a devastating impact on local environments and economies. These damaging storms can cause catastrophic flooding; overwhelm sewage treatment plants; increase the risk of waterborne disease; and wipe out valuable crops.

Wang says the peaks seen in the observational data and climate models simply reflect the natural variability of the climate. As Earth warms, her team found, the entire curve representing the relationship between extreme precipitation and rising temperatures is moving to the right. This is because the threshold temperature at which rain intensity peaks also goes up as temperature rises. Therefore, extreme rainfall will continue to increase, she says.

"In general, extreme precipitation increases with higher temperatures because the air can hold more moisture -- although that depends on moisture availability. But beyond a certain point, it is the other way round: the temperature responds to the precipitation, or more strictly speaking, the conditions leading to the precipitation, [such as extensive cloud cover or surface moisture],” explained Kevin Trenberth, an expert on global warming and the lead author of several reports prepared by the Intergovernmental Panel on Climate Change (IPCC), who joined Wang in the study.

Trenberth is currently a Distinguished Senior Scientist in the Climate Analysis Section at the National Center for Atmospheric Research. He shared the 2007 Nobel Peace Prize with former Vice President Al Gore as a member of the IPCC.

“The most obvious example of this is in a drought where there is no precipitation. Another example is in cloudy, stormy conditions, when it is wet and cool. By relating the changes in precipitation to the temperature where the relationship reverses -- instead of the mean temperature as in previous studies -- we can make sense of the differences and the changes. Moreover, it means there is no limit to the changes that can occur, as otherwise might be suspected if there were a fixed relationship."

All of which adds up to a soggy future, as climate change continues.

The mission of Dr. Guiling Wang's Hydroclimatology and Biosphere-Atmosphere Interactions Lab at UConn is to understand and quantify the terrestrial hydrological cycle, its variability, changes, and interactions with the society. With a special focus on water, the lab’s research spans the disciplines of climate and atmospheric sciences, hydrology, and plant ecology. They take “an earth system approach, viewing the Earth’s biosphere, atmosphere, and hydrosphere as dynamically coupled components linked through water, energy, and CO2 exchanges,” according to the website summary.

Disparities Evident As Fairfield County Considers Its Community Wellbeing

Fairfield County’s sizeable immigrant population - twenty percent of Connecticut’s most populous county - grew 89 percent from 1990 to 2014. In some municipalities, foreign-born residents make up as much as a third of the population. That is among the findings in the Fairfield County Community Wellbeing Index 2016, which examined regional demographics, economic opportunity, education, health, quality of life, and happiness.  The report includes analysis of the communities, populations, and neighborhoods of Fairfield County, as well as opportunities available and issues facing the area.

Since 1980, the size of the population living in neighborhoods that are considered most affluent – defined as those with an average family income more than 2.5 times higher than the state level - has tripled within Fairfield County. Meanwhile, the number of people living in poor neighborhoods is 3.5 times its 1980 size. The number of people in middle-income neighborhoods has decreased by sixteen percent.

Fairfield County’s Community Foundation, a major funder of the report, partnered with DataHaven, area hospitals, and government agencies to help launch a more robust and comprehensive resource that could serve as a part of the hospitals’ and health departments’ Community Health Needs Assessments as well as a broader county-wide indicators program.

“Fairfield County’s Community Foundation is committed to addressing the most pressing issues facing Fairfield County, but to do that we first need to be able to identify and understand those issues,” stated Nancy M. von Euler, Vice President, Programs, Fairfield County’s Community Foundation. “The data in the Fairfield County Community Wellbeing Index 2016 will help us to develop priorities for collective action to build a stronger, healthier Fairfield County where everyone has the opportunity to thrive, regardless of their zip code.”

The report states that "Despite its overall affluence, Fairfield County is among the nation’s most unequal metropolitan areas. Inequities in well-being appear when evidence is stratified by income, age, race, gender, and zip code. These differences are often most apparent after considering data that were collected specifically for the age groups and neighborhoods that are most impacted."

Among the findings, between 2014 and 2025, adults ages 65 and over are Fairfield County’s only age group projected to grow significantly, with a thirty-seven percent increase. Disparities in the County were also evident:

  • High and rising childcare costs are often prohibitively expensive for low and middle-income families. While Fairfield County has nearly enough spaces for all 3- to 4-year-olds to attend preschool, there are only enough regulated childcare slots for fifteen percent of the county’s children ages 0 to 2, and enough subsidized slots to cover only twenty-two percent of these youngest children in low-income households.
  • The issue of dental care arose as an indicator of well-being, particularly among younger adults and families. The Index shows that for every 10,000 residents living in Fairfield County, 12 residents visit an emergency room to receive treatment for preventable dental conditions in any given year, whereas on the East Side of Bridgeport, 178 residents do.
  • Fairfield County residents are healthy when compared to national benchmarks. However, many conditions and risk factors—such as asthma, food insecurity, exposure to community violence, and the early onset of diabetes—are disproportionately prevalent in lower-income neighborhoods and communities of color. Sections of Bridgeport in particular fall very far behind the surrounding area in many of these measures.
  • Disparities in access to reliable transportation persist between racial and income groups. A majority of Fairfield County workers, regardless of income, commute to another town for work. Many low-income (annual wages under $40,000) workers leave Bridgeport for work, while large shares of high-income workers commute to New York City.

“The process of developing this report allowed local partners and community members to identify links between the well-being of residents and the places where they live. Looking beyond typical measures like income levels or unemployment rates, the Community Wellbeing Index reveals a much more uneven distribution of opportunities in areas such as neighborhood walkability, economic development, public health, and education,” said Mark Abraham, Executive Director of DataHaven and a lead author of the report. “The impact that these barriers to opportunity have on overall well-being and happiness will serve as a call to action for many groups working to improve Fairfield County’s diverse neighborhoods and towns.”

The Fairfield County Community Wellbeing Index 2016 was based on a variety of federal and statewide data sources. Partners of DataHaven’s Fairfield County Community Wellbeing Index 2016 include Fairfield County’s Community Foundation; Bridgeport Hospital; Danbury Hospital; Greenwich Hospital; Norwalk Hospital; St. Vincent’s Medical Center; and Stamford Hospital.

Healthy Eating Not So Great Among Children, Community Can Help

Only one-third of parents of children ages 4-18 feel they’re succeeding at fostering healthy eating habits in their kids, according to a recent national survey.  The University of Michigan C.S. Mott Children’s Hospital National Poll on Children’s Health found that just over half of parents believe their children eat mostly healthy, and only one in six parents rate their children’s diets as “very nutritious,” according to a press release. A fourth of parents polled said their child’s diet is “somewhat or not healthy at all.” Common challenges – not surprisingly - get in the way, according to experts: price, picky eaters and convenience.

“Most parents understand that they should provide healthy food for their children, but the reality of work schedules, children’s activities and different food preferences can make meal preparation a hectic and frustrating experience,” poll co-director Sarah Clark explained. “The tension between buying foods children like, and buying foods that are healthy, can be an ongoing struggle. Many of us know the feeling of spending time and money on a healthy meal only to have our children grimace at the sight of it and not take a single bite.”

Other data from the poll – which involved 1,767 parents – include that one in five parents don’t think limiting their child’s intake of fast food or junk food is important, and that 16 percent said limiting sugary drinks is “somewhat or not important.”

In general, parents of teens were less worried about unhealthy eating habits compared to parents of younger children.

The C.S. Mott Children's Hospital National Poll on Children's Health measures current national public opinion, perceptions and priorities regarding major health care issues and trends for U.S. children and people in their communities.

Also this month, the Rudd Center for Food Policy and Obesity at the University of Connecticut found that residents of one Maryland county bought fewer sugary drinks after a campaign to reduce the consumption of sugar-sweetened beverages that included policy changes and public health outreach efforts.

The Rudd Center study, published in JAMA Internal Medicine, is the first to use objective retail sales data to measure the effectiveness of a community-led campaign to reduce consumption of sugary drinks.

“This study demonstrates the power of a community-based public health campaign that combines health-supporting policy changes with extensive outreach. The residents of Howard County have been engaged in every phase of this effort and their commitment to switching their drinks showed up in the supermarket sales data,” said Marlene Schwartz, Director of the UConn Rudd Center for Food Policy and Obesity, and the study’s lead author.

Beverages with added sugars are among the leading sources of empty calories—calories that supply little or no nutrients—for both children and adults, and overconsumption of sugar is associated with obesity and increased risk of heart disease.

The study’s key findings show that based on sales data from Howard County supermarkets:

  • Sales of sugar-sweetened soda declined nearly 20 percent.
  • Sales of 100 percent juice fell 15 percent.
  • Sales of fruit drinks with added sugars fell a little more than 15 percent.

Comparing sales data in 2012, before the Howard County Unsweetened campaign, to sales data in 2015, researchers found notable declines in purchases over the three-year period.

In determining the campaign’s impact, researchers compared weekly beverage sales of top-selling brands in 15 Howard County supermarkets with a matched group of 17 supermarkets in southeastern Pennsylvania. The study did not include sales data from non-supermarket vendors such as convenience stores.

The Rudd Center for Food Policy & Obesity at the University of Connecticut is a distinguished multi-disciplinary policy research center dedicated to promoting solutions to childhood obesity, poor diet, and weight bias through research and policy.  The study was funded primarily by the Horizon Foundation, with additional funding from the Robert Wood Johnson Foundation, and from the Rudd Foundation to support data collection. Voices for Healthy Kids, a joint initiative of the Robert Wood Johnson Foundation and the American Heart Association, is a strategic partner of both Howard County Unsweetened and Sugar Free Kids Maryland.

CT Ranks 5th in U.S. in Dental Health, Best in New England

The neighboring states of Minnesota, Wisconsin, Illinois and North Dakota have the best dental health in the nation, but Connecticut and Massachusetts break the mid-west logjam, ranking fifth and sixth in a new survey of nearly two dozen dental-health related categories by the financial website WalletHub. Connecticut ranked second in a series of oral health categories and 17th in a group of dental habits and care categories, according to the survey, resulting in the 5th place finish overall.  Connecticut and Massachusetts ranked one-two in the highest percentage of adults who visited a dentist in the past year, and Connecticut placed third, after New Hampshire and Pennsylvania, in the highest percentage of adolescents who visited a dentist in the past year.

Connecticut also topped the list in two additional categories:  Lowest Percentage of Adults Who Experienced Pain in the Past Year Due to Oral Condition and Lowest Sugar-Sweetened Beverage Consumption Among Adolescents.  The state also ranked in a tie for third for having the lowest percentage of elderly population with no natural teeth.

Data used to create the ranking were collected from U.S. Census Bureau, Bureau of Labor Statistics, Centers for Disease Control and Prevention, Healthy Grid, American Dental Association, Health Resources & Services Administration, Medicaid and CHIP Payment and Access Commission, American Academy of Pediatric Dentistry and Oral Health America, according to WalletHub.

With the state’s ranking in the background, the Connecticut Oral Health Initiative (COHI) will host a session on health equity during Oral Health Day at the State Capitol on Wednesday, March 8, from 10 am to 3 pm in the Legislative Office Building.

Connecticut oral health-related organizations will on hand throughout the day to raise awareness and educate decision-makers and the public about policies to improve the oral health of Connecticut residents. The organization’s focus this year is on preserving Medicaid coverage for adults and children, allowing children to remain on their parents' dental insurance until age 26, and integrating oral health into health systems.

Other legislative initiatives include a proposal to increase the number of adults aged 19 to 26 years covered by dental insurance to provide continuity of dental care into adulthood, and another to decrease the incidence of oral and other cancers by decreasing tobacco use by Connecticut residents. By raising the Legal Age For Purchase and Use of Tobacco Products.

COHI leads and collaborates in statewide oral health advocacy efforts; promotes the necessity of oral health to overall health; serves as an expert resource on oral health policy; and publicizes oral health policy analysis and recommendations.

Also at the Capitol, the Department of Public Health is proposing a mandate for dental hygienists to have at least one contact hour in cultural competency prior to the renewal of their license, as part of the commitment to health equity.

PERSPECTIVE: Fighting Fake News in the Classroom

by Lorenzo Burgio The struggle to tell fact from fiction in the digital age is the battle being fought recently by teachers and professors.

A Stanford study recently found that students in middle school, high school and college, are bad at verifying the news read online — which is worrisome.

The ability to verify news is something that has to be practiced in the nation’s classrooms, said Professor Sam Wineburg, who produced research for the Stanford study, to NPR.

In the study, Wineburg explained that the concept becomes even more worrisome because “many people assume that because young people are fluent in social media, they are equally perceptive about what they find there.” This makes young people a major factor, because they are susceptible to believing fake news and more prone to spreading it.

“How do they become prepared to make the choices about what to believe, what to forward, what to post to their friends, when they’ve been given no practice in school?” said Wineburg to NPR.

This idea is becoming even more prominent as the media is constantly being attacked or used for personal agendas, and this is something educators are aware of.

This is also a responsibility that is falling more and more into the hands of teachers and professors, because “fewer schools now have librarians, who traditionally taught research skills,” explained The Wall Street Journal.

As Facebook works with the Associated Press and other organizations to ensure fake news is not spread throughout the social media platform, efforts in the classroom can also help tame the spread of fallacies on the Internet.

“Teachers from elementary school through college are telling students how to distinguish between factual and fictional news — and why they should care that there’s a difference,” wrote USA Today.

Encouraging and teaching the ability to sift out fake news in the nation’s classrooms is necessary. This ability is vital to becoming a functioning and involved member of society and can only benefit future voters.

California lawmakers passed a bill in January that requires the state to teach courses that help students between grades seven and 12 distinguish fact from fiction and understand the repercussions of spreading fake news.

The dynamics of these courses are specifically designed to have students combat fake news by knowing proper reporting techniques. They teach students to ask questions such as, “Are other news sites reporting on it? How is the writing? Can I find the people in the story elsewhere online?”

There is also be a special emphasis on using tools such as Snope.com and FactCheck.org to validate all information and to always think twice before sharing something on social media.

These courses should be taught nationwide. In a digital world that is only becoming increasingly technologically based, these are necessary skills that students should be properly educated in and to combat the spread and influence of fake news. It is particularly significant because the young social media users play such a large role in spreading fallacies due to their familiarity and expertise with social media, and the perceived notion that news shared by them is of the same stature.

Lorenzo Burgio is editor of Central Recorder, the student newspaper of Central Connecticut State University, where this column first appeared.  Published with permission.

Health Reform Efforts Earn CT a C+, Survey Says

Connecticut health care thought leaders have again given the state a C+ grade for health reform, as the state’s GPA dropped slightly  from 2.4 to 2.2. Connecticut’s grade for effort didn’t change from last year – holding steady at a B-/C+ (GPA 2.5) in the annual survey by the Connecticut Health Policy Project, as part of their efforts to increase public awareness of health care issues among state residents. Connecticut continues to earn higher marks for Medicaid and the health insurance exchange, according to the survey. Grades for patient-centered medical homes were down from recent years. Lowest marks went to efforts to address the health care workforce, the only area that received a D grade overall.

Unlike past years, thought leaders gave more C’s across the majority of issue areas, mirroring the overall grade for the first time. A new question assessing the level of trust between stakeholders in Connecticut health policymaking elicited low responses, averaging only 26 out of 100 possible points, with zero to ten being the most common response. Low trust scores were found in every stakeholder group.

The Connecticut Health Policy Project is a non-profit, non-partisan research and educational organization dedicated to improving access to affordable, quality health care for all Connecticut residents.

Sixty-one thought leaders across Connecticut’s health fields and sectors were surveyed online between December 20, 2016 and February 9, 2017. Forty-one (67%) responded. The invitation list was collected from membership of health-related state councils, board and committees, and leadership of health-related organizations.

Respondents represented community organizations, foundations, providers, payers, consumer advocates, labor, media, business people, insurance brokers, and academics. To ensure independent responses, state officials responsible for reform were not surveyed, officials said.

Collegiate Greek Life Leaders Descend on Hartford, Again

Hotel rooms were relatively scarce in downtown Hartford this past weekend as the Northeast Greek Leadership Association attracted about 1,000 college students involved in leading their campus fraternities and sororities to the Capitol City for the regional organization’s annual conference. The NGLA filled rooms at the Marriot and Hilton downtown, with overflow rooms at the Holiday Inn for the conference held at the Connecticut Convention Center, February 23 – 26.  The conference has become somewhat of a tradition in Hartford, held in the city in alternate years.

NGLA provides educational training and leadership development for collegiate fraternity and sorority members from college campuses across the northeast, and “builds community among students from a variety of fraternal experiences, challenges members to align their actions with fraternal values, and empowers advocates to transform and improve their communities,” the organization’s website points out.

“Hartford has always graciously welcomed our conference and its 1000+ conference attendees from across the northeast. We are thrilled to be back at the Convention Center,” said Emily Perlow, Chairman of the association’s Board of Directors. 

This year’s program highlights included education on motivating members, values based decision making, diversity and inclusion, and sexual assault prevention. Students, campus based professionals, national fraternity and sorority professionals and volunteers, as well as vendors and speakers attend the event, which offers a range of educational opportunities for participants.

The program also includes an Advisors Academy, which was recognized as an Outstanding Educational Program by the Association of Fraternity/Sorority Advisors. There also is programming specifically for culturally based fraternities and sororities and local fraternities and sororities. In addition, opportunities to “sit with brothers and sisters from the region at the affiliation luncheon.”  The weekend culminates with a closing banquet during which NGLA Awards are presented, recognizing outstanding achievement.

Among the sessions held during the conference: Curiosity, Courage and Cake: Surviving Mental Illness Through Sisterhood; Know Better/Do Better: A Frank Talk About Campus Racism; and Retaking Our Story: Reframing the Sexual Assault Conversation.  Speakers providing insight for the student leaders address topics including: Be An Action Hero: The 4 Traits of High Impact Leaders; Why We Need to Talk with Our Members About Race and Every Student Needs to Know About Alcohol.

NGLA, which formed in 2011 with the merger of two fraternal organizations in the region, states as its vision:

  • Fraternities and sororities in the northeast provide co-curricular learning experiences that prove to be essential in furthering the mission of their host institution
  • Fraternities and sororities in the northeast are high performing and are looked to as a model of best practices
  • Fraternities and sororities members in the northeast can articulate their founding principles, strive to live these principles, and challenge peers whose behavior is inconsistent with these principles.
  • NGLA is known to members on every campus as a valuable resource that provides a demonstrated return on investment.

There were just over one thousand attendees at last year’s conference in Pittsburgh, PA.  The conference returns to Pittsburgh next year, and then will be back in Hartford in 2019.