Raising Revenue Getting Tougher for Towns, Cities in Connecticut; Property Tax Drives Disparities
/The Connecticut Data Collaborative has launched a series of reports that will examine the fiscal situation of Connecticut’s 169 municipalities making the data compiled in several recent statewide initiatives that examined fiscal challenges facing the state and its towns more readily accessible to the public. The goal is to “highlight the major findings from these initiatives and reports; expand on the research that was done; present it through a new medium; and inform a broader audience on the work being done in the state.”
The first data story, published this month, highlights the findings from a report to the General Assembly’s Program Review and Investigations Committee prepared by the Federal Reserve Bank of Boston’s New England Public Policy Center (NEPPC), “Measuring Municipal Fiscal Disparities in Connecticut.”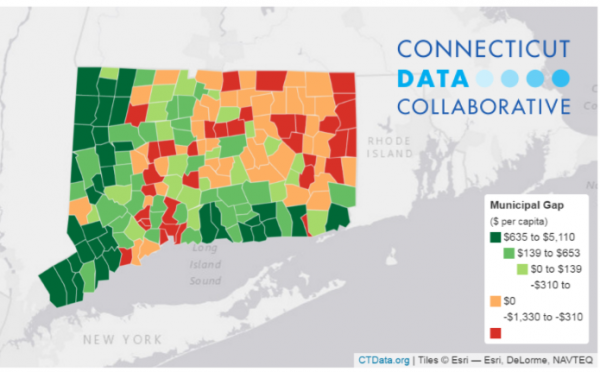
The conclusion: the capacity to raise revenue from property taxes is the main driver of fiscal disparities in Connecticut.
- 78 of 169 towns have a deficit, with revenue capacity below the cost of providing services. These 78 towns represent almost 60 percent of state’s population.
- 91 of 169 towns have sufficient capacity to raise revenue capacity to cover the cost of services.
- Municipal cost differences exist but are not as dramatic as the differences in the ability to raise revenue
- Current state non-school grants made to towns have a limited effect in reducing non-school fiscal disparities in Connecticut.
- Five cost factors were identified as driving non-school municipal costs: unemployment, population density, private sector wages, town road maintenance, and jobs per capita.
- Statistical analysis shows that the following factors do not impact costs: poverty, population, the share of foreign-born population, and the share of older rental housing units
The website points out that “a municipal gap exists when the costs are higher than the revenue raising capacity,” and provides an interactive town-by-town listing of the “gaps.” The highlighted findings:
- The largest gaps are in Hartford (-$1,330), Bridgeport (-$1,168), New Haven (-$1,101), New Britain (-$1,056) and New London (-$896). The largest surpluses are in Westport, New Canaan, Darien, and Greenwich. The data is FY 2007-2011, averaged.
- 78 towns in the state have a deficit - the capacity is below the cost of providing services. These towns cover almost 60 percent of state’s population.
- 91 towns have sufficient capacity to raise revenue greater than the cost of services. These towns cover 40 percent of the state’s population, primarily in Fairfield County, Litchfield and the shoreline.
Since property taxes are the primary way that municipalities raise revenue, the website examined the trends in the Equalized Net Grand List (ENGL) since 2011. Overall, property tax revenue has been on the decline, the data indicated. An interactive table on the site shows - by town- the average annual growth rate (or decline) in the grand list from 2011 to 2014, and also shows the Municipal Gap calculated by the report. In total, ENGL has declined for 145 of the 169 towns since 2011 – “thus the revenue raising capacity for towns has only become more difficult.”