CT Ranks 15th Among Best States for Millennials, Analysis Reveals
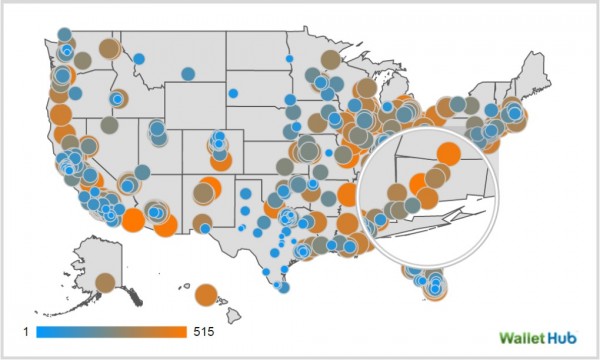
/The only state in the nation with a higher percentage of millennials living with their parents than Connecticut is New Jersey. That is just one finding in a study of the best and worst states for millennials, in which Connecticut ranked fifteenth overall. Why do so many millennials in Connecticut live with mom and dad in Connecticut? Analysts say that high housing costs are to blame. Pushing Connecticut toward the top is the state’s third place ranking in the Education & Health category. Pulling the state down are rankings of 41st in Affordability, 29th in Economic Health and 23rd in Quality of Life. The state ranked 17th in Civic Engagement among the 50 states and the District of Columbia.
The best states for millennials, according to the analysis by the website WalletHub, are the District of Columbia, North Dakota, Minnesota, Massachusetts, Iowa, Wisconsin, Utah, Nebraska and Colorado. Among the other New England states, New Hampshire came in at #12, Vermont at #14, Rhode Island at #26 and Maine at #28.
Connecticut's #15 ranking is filled with plusses and minuses in the component elements of the study. The state, for example, has the 7th highest average annual cost of early childcare as a share of average earnings for millennials, at 23.85 percent. In housing cost for millennials, Connecticut ranks 38th, the average two-bedroom rent being 36.99 percent of this age group's average earnings, WalletHub analyst Jill Gonzalez points out.
The state has the second highest percentage of millennials who visited a dentist in the past year at 74.60 percent; the 8th highest percentage of millennials who had a routine checkup in the past year at 66.37 percent; and the 7th smallest percentage of millennials with no doctor visits in the past year due to cost, at 11.70 percent.

According to the Pew Research Center, millennials are expected to overtake Boomers in population in 2019 as their numbers swell to 73 million and Boomers decline to 72 million. Generation X (ages 36 to 51 in 2016) is projected to pass the Boomers in population by 2028.
 The five dimensions, mentioned above, were weighted to determine an overall score on a 100 point scale using thirty relevant metrics including the cost of living, rate of home ownership and insurance, average student loan debt, voter turnout rate, unemployment rate, percentage diagnosed with depression and the average price of a latte at Starbucks.
Data used to create the rankings were collected from the U.S. Census Bureau, Department of Housing and Urban Development, Council for Community and Economic Research, Centers for Disease Control and Prevention, United Health Foundation, TransUnion, Corporation for National and Community Service, Indeed, Child Care Aware of America and WalletHub research.


 Joan Fitzgerald, Professor of Public Policy and Urban Affairs at Northeastern University, told WalletHub: “It is not an accident that many of the fastest growing cities have thriving high tech and biotech sectors along with financial services and usually a strong health care sector. But another priority has to be balance. In many cities, manufacturing loses out over other uses.”
 tates according to their tendency to produce the highest or lowest monthly energy bills.
The analysis points out that “lower prices don’t always equate with lower costs, as consumption is a key determinant in the total amount of an energy bill.” Connecticut’s monthly energy cost for consumers, according to the analysis, is $404, ranking the state 49th out of 51 (the 50 states plus the District of Columbia). Mississippi’s total monthly cost paid by consumers averages $414, while Hawaii’s is $451.
 the highest in the nation. (see breakdown below)


