Income Inequality Around Bridgeport Has Grown, Among Nation’s Largest Gaps, Research Shows

Commuting zones surrounding Bridgeport are among the commuting regions in the United States where neighborhood income inequality has grown notably most severe over the past 20 years, according to a new analysis developed by the Urban Institute and published in Governing magazine. From 1990 to 2010, inequality in the United States increased in many ways, the report explains, highlighting that the income, wealth, and educational attainment of residents in the most privileged neighborhoods in the U.S. escalated rapidly over these two decades. Meanwhile, “residents of the most disadvantaged neighborhoods gained little; many of these neighborhoods grew poorer,” the report indicated.

WOrlds ApartAs a result, the study found that inequality between “top and bottom income” neighborhoods intensified in the great majority of commuting zones. Even where inequality dropped, the story was not always positive: it often occurred because top-neighborhood incomes fell in the wake of economic stagnation.

The research report, “World Apart:  Inequality between America’s Most and Least Affluent Neighborhoods,” found that “the national trend toward rising incomes among top-earning households” was reflected in the nation’s top tracts show growth from $123,000 to $138,300, over 12 percent” during the period 1990-2010.  Some top neighborhoods, including those surrounding Bridgeport, “had increases of over $30,000 at the top.”

Annual income in bottom tracts, meanwhile, grew from $36,800 to $37,150 – less than 1 percent over the twenty year period.  The average income of bottom tracts declined in 209 of the 570 commuting zones studied, the report indicated.  The most severe losses at the bottom among large commuting zones, the report found, occurred in Bridgeport, Newark and Dallas. Bridgeport is one of the ten cities with the largest “neighborhood inequality index.”

The report flatly stated that “Bridgeport, which includes the entirety of Connecticut, already was one of the most unequal commuting zones in 1990.  Its top and bottom neighborhoods pulled further apart in income between 1990 and 2010; practically all its top neighborhoods are still in the suburbs and practically all its bottom neighborhoods are in central cities.”bgpt NH

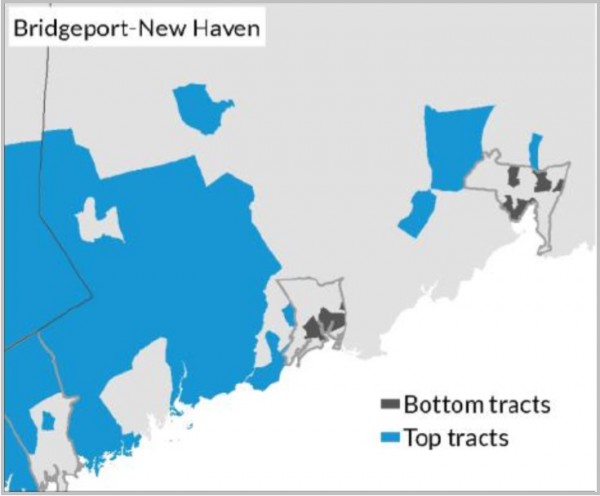
The only cities with commuting zones of over 250,000 people with a higher “neighborhood inequality index” than Bridgeport, as of 2010, are Austin, Baltimore, Birmingham, Columbus, Houston, Nashville, Richmond, and St. Louis.

As a result of changes at the top and bottom, the report noted, income inequality between top and bottom tracts grew from 1990 to 2010 in 433 of the 570 commuting zones. In 237 CZs, income inequality grew because of rapid increases at the top coupled with modest increases at the bottom.

To understand the differences between neighborhoods that share the same housing and labor markets, the Urban Institute analysis used commuting zones (CZs), county-based regions defined in the 1990s. Unlike metropolitan areas, commuting zones cover the entirety of the United States, and their definitions are constant over time.

The study ranked every CZ’s tracts from lowest to highest neighborhood advantage score. Then they identified the top 10 percent and the bottom 10 percent of tracts—the most advantaged and least advantaged neighborhoods in each CZ—for further exploration. There are described as top and bottom tracts. The study analyzed the 570 CZs that had at least 10 census tracts in 2010.

The nonprofit Urban Institute is dedicated to elevating the debate on social and economic policy. The organization’s website explains that “For nearly five decades, urban scholars have conducted research and offered evidence-based solutions that improve lives and strengthen communities across a rapidly urbanizing world. Their objective research helps expand opportunities for all, reduce hardship among the most vulnerable, and strengthen the effectiveness of the public sector.”

CT’s 4th Congressional District Ranks #5 in US for Income Inequality

Connecticut’s 4th Congressional district, centered in Fairfield Country, has been ranked as the district with the 5th highest level income inequity in the nation. A ranking of congressional districts of by their level of income inequality, conducted by Bloomberg, uses the Gini coefficient, a formula that measures the distribution of income across a population. The closer a Gini number is to 1, the greater the level of inequality; the closer to zero, the closer to perfect equality.

Generally, the Bloomberg Businessweek website points out, the U.S. congressional districts with the most inequality share certain traits: “they contain a small, enormously wealthy elite surrounded by impoverished neighbors.” Most of the districts with the greatest disparity are located in or near major urban metropolitan aRich-vs-poor-directionsreas such as New York, Philadelphia, Chicago, Boston, Atlanta, and Washington.

The congressional district where inequality is highest turns out to be New York’s 10th, with a Gini coefficient of .587; followed by Pennsylvania’s 2nd District, at .583; Illinois’ 7th District, at .574, and Florida’s 27th District at .562. Connecticut’s 4th District is next, at .561, followed by New York’s 12th District, Ohio’s 11th District, Georgia’s 8th District and New York’s 16th District. The most equal district is Virginia’s 11th, at .385.

"The big take-away," according to Bloomberg Businessweek: “A strikingly high level of inequality exists throughout the United States.” Also of note, 9 of the top 10 districts with the greatest income inequality are currently represented in Congress by Democrats, including Connecticut’s Jim Himes, Georgia’s John Lewis, Washington D.C.’s Eleanor Holmes Norton, and New York’s Jerrold Nadler, Carolyn Maloney and Eliot Engel.

Breaking down the state’s population into five segments, by income, Connecticut ranked 10th in the share of household income among the lowest income quintile, 5th in the second quintile, 4th in the third quintile, 5th in the fourth quintile at and 4th in the highest-income quintile.

The website takes the state-by-state comparison one step further, providing context by comparing the state data with data compiled by the Central Intelligence Agency, which tracks the Gini coefficient of 139 countries.

“What jumps out,” according to the website report on the data analysis, “is how lousy the United States looks. Our best district in terms of equality (VA-11) is only as good as Portugal, which sits at a pedestrian 71st on the CIA’s list, right in the middle of the pack. That means that the level of equality in every congressional district in America falls below the midpoint of the CIA’s 139-country ranking.”

“Even the best U.S. district has higher inequality than any number of countries you probably don’t associate with economic egalitarianism: Greece, Niger, Ethiopia, Egypt, Pakistan, Kosovo, Mongolia, Ukraine, Bangladesh. The most equal U.S. congressional district can’t compare with the national averages of New Zealand, France, Canada, Netherlands, Australia, Switzerland, Belgium, Germany, and Austria. Most districts in the U.S. (those ranked 39th through 429th) fall in a narrow Gini band between .4 and .499, putting them between Zimbabwe (20th on the CIA list) and the United Kingdom (60th).”

In 2013, a person living alone making less than $11,490 was classified as in poverty. The threshold increased by $4,020 for each additional household member.

Hartford Ranked #35, New Haven #39 in Income Inequality Among US Cities; Bridgeport-Stamford-Norwalk Is Nation's Most Disparate Region

A new analysis ranking the cities with the greatest income inequality includes Hartford and New Haven in the top 50.– and the Bridgeport-Stamford-Norwalk metropolitan area is the metro region with the largest income disparity in the nation.

The major cities with the most dramatic income inequality in their population are, ranked in order:  Atlanta, New Orleans, Miami, Jackson (Mississippi), Gainesville (Florida), Tampa, Cincinnati, Athens (Georgia), Providence, Berkeley and Boston.  Seven of the top 11 are cities in the Southern U.S.

Among New England cities, Providence ranked #9, Boston at #11, Cambridge at #12, Hartford at #35, and New Haven at #39.  Among other major cities, New York ranked #13 and Washington, D.C. ranked #15.

Bloomberg ranked 300 U.S. cities with populations of at least 100,000income-inequality-shutterstock_146836310 based on their level of income inequality and identified the 50 with the greatest inequality. The media outlet also ranked the top 20 metropolitan areas with the greatest income disparity.

On that list, Bridgeport-Stamford-Norwalk ranked as the metro area with the most income inequality in the nation.  Among the 20 regions with the greatest disparity, one-quarter are in Florida – including Naples-Marco Island at #2 and Gainesville at #3.  College-Station-Bryan (Texas) was #5 and New York-Northern New Jersey was #5 on the list of metro areas. 

They methodology for the analysis was use of the “Gini coefficient,” which is calculated by the U.S. Census from household income share by quintiles, used to measure distribution of wealth. It ranges from zero, which reflects absolute equality, to one, complete inequality.

Hartford’s Gini coefficient was 0.5176, New Haven’s was 0.5144.  By comparison, Atlanta’s was 0.5882, and Providence 0.5445.  New Haven’s income inequality improved slightly, by 5.4 percent, since 2008, while Hartford’s disparity grew slightly, by just over 1 percent, according to the data.

The Bridgeport-Stamford-Norwalk region had a Gini coefficient of 0.5459.

It was reported that in New Haven, 26.1 percent of the population was living in poverty; in Hartford the figure was 38 percent.  In Hartford, 54 percent of household income was in the highest quintile, while 2 percent was in the lowest quintile.  In New Haven, 38 percent was in the highest quintile while 2.5 percent placed in the lowest.

In the ranking of the 50 cities with the most income inequality, Hartford was between Lafayette, Louisiana and Cleveland, OH.  New Haven ranked between Charleston, S.C. and Tulsa, OK on the list.

The average score for the United States was 0.4757. In 2013, a person living alone making less than $11,490 was classified as in poverty. The threshold increased by $4,020 for each additional household member, Bloomberg reported.