Asian Population Grows in CT and US, Becomes More Suburban As Challenges Persist
/Asians are the country’s fastest-growing racial group — their share of the U.S. population has increased from 4.2 percent in 2000 to 5.6 percent in 2010, and is expected to reach at least 8.6 percent by 2050, the website newgeography.com has reported. The White House has estimated that by 2050, Asian Americans and Pacific Islanders will make up 9.7 percent of the total United States population -- over 40 million people.
Between 2000 and 2010, the Asian Pacific American population in Connecticut increased by 65 percent. Connecticut's current Asian Pacific population is 147,830, four percent of the total Connecticut population, according to the state’s Asian Pacific American Affairs Commission, an agency created by the state legislature in 2008. 
Asia is now the largest source of legal immigrants to the United States, constituting 40 percent of new arrivals in 2013, according to newgeography.com. The state Commission indicates that Asian Pacific Americans can be broken down into four geographically-based groups:
- Pacific Islanders, mostly Native Hawaiians, Samoans, and Guamanians;
- Southeast Asians, largely comprised of Indochinese from Vietnam, Thailand, Cambodia, Laos, and Indonesians and Filipinos;
- East Asians, including Chinese, Japanese, and Koreans; and
- South Asians, including those from Bangladesh, Bhutan, India, Pakistan, Nepal, Sri Lanka, Tibet, and the Maldives
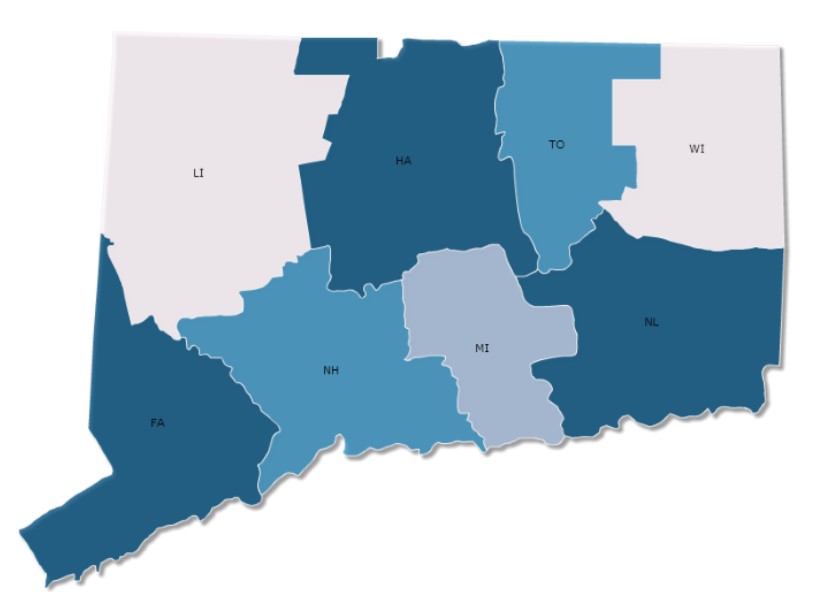
In Connecticut, the largest population of Asian Pacific Americans are in Fairfield and Hartford counties, and Asians represent the majority minority in 40 percent of Connecticut school districts, according to Commission data. Recent data compiled in New Haven indicated that the Elm City’s growth in recent years, and its status as the state’s fastest growing city, has been in large part due to immigrants, including Asians.
 In decades past, Asians, as other immigrants, tended to cluster in “gateway cities” and often in the densest urban neighborhoods, like New York’s Chinatown. Now the center of gravity has shifted to the suburbs, newgeography reported. Between 2000 and 2012, the Asian population in suburban areas of the nation’s 52 biggest metro areas grew 66.2 percent while those in the core cities expanded by 34.9 percent.
In a report issued last year, Connecticut’s Asian Pacific American Affairs Commission reported concerns related to education (especially English proficiency), healthcare, mental health services, job opportunities and legal services. Concerns have also been raised regarding the increasing costs of higher education in Connecticut.
For example, the Commission noted “the lack of culturally competent health care professionals, including hospital interpreters, is an overwhelming, ethnicity-specific obstacle to health care access resulting in low rates of health services utilization, high rates of emergency room use, and inadequacy of prenatal care.” The Commission also noted that “up to 53.3 percent of APAs lack English language proficiency due to the high proportion of immigrants (about 74 percent of APAs in Connecticut are foreign born).” In addition, a report by the Commission indicated that “in the last six years, there has been a 350 percent increase in need for court interpreters.”
California has long been is the most frequent location for Asian immigrants to settle, with 4.8 million currently residing in the state, according to data published by newgeography.com. New York, with 1.4 million Asians, ranks second while Texas, with 964,000, ranks third.
Asian populations are increasing quickly in the Sun Belt. Texas’ Asian population increased by 71.5 percent from 2000 through 2010, adding a net 402,277, second most in the country over that span behind California’s 1.1 million gain. Texas is home to the only city outside California and Hawaii in the top 20 of our list of the most heavily Asian U.S. cities: the Houston suburb of Sugar Land, where 37.1 percent of the 82,000 residents are Asian.
The newgeography website indicates that “One clear trend is that Asian populations are growing in areas that are on the cutting edge of the economy — in tech centers like Silicon Valley, and near New York’s global service firms (across the river from Manhattan, Jersey City is now 25 percent Asian.) Around the manufacturing and technology companies of the Detroit and Seattle areas, Asian communities are growing.


 zed Cities that were ranked, New Haven ranked #42 (up from #65 last year) and Bridgeport-Norwalk-Stamford
 ranked at #58 (up from #85 last year) and saw the 10th largest advance among the medium sized cities.


