Despite Drop in Summer Passengers, Bradley Continues Year-Over-Year Growth
/For the month of October, there was a 3.6 percent year-over-year increase in passengers at Bradley International Airport, the strongest month thi syear, resulting in an overall 1.1 percent increase over the first ten months of the year, compared with 2014. Save for a slight dip in July and August (and a minimal drop in February) – compared to record numbers in the summer months a year ago – Bradley continues to see steady year-over-year increases in passenger traffic.
The October uptick follows September’s 1.2 percent a percent increase, reflecting increases in passenger traffic in and out of Bradley during seven of the first ten months of the year, compared with a year ago. 
Bradley saw 17,000 fewer passengers in August 2015 compared with the previous August, after a drop of 5,142 passengers in July as compared with July a year ago. The numbers are included in the minutes of the Connecticut Airport Authority, which oversees Connecticut’s airports including Bradley, the region’s second largest airport after Boston’s Logan Airport.
Since then however, the steady growth has resumed. From January through March, the passenger numbers at Bradley reflected a slight increase of 1.4 percent over the same period in 2014. If the September and October growth continues in November and December, the airport’s passenger traffic is expected to once again exceed the previous year.
At New England’s other major airports, Logan Airport in Boston showed a passenger increase of 3.8 percent in the first quarter of 2015 above the same period the previous year. At T.F. Green Airport in Providence, RI, passenger traffic declined by 2.3 percent in the year-over-year comparison.
In April, passenger traffic was up 1.3 percent above 2014 levels. In May, Bradley again saw a slight uptick from May 2014, with passenger numbers increasing by 3.3 percent to 542,888. Boston’s Logan Airport was up 4.9 percent from the previous May, and Providence’s T.F. Green Airport was virtually unchanged, up by 63 passengers.
Another increase in June, 1.5 percent above the previous June, continued Bradley’s strong performance. The same was true of Logan Airport, where passenger numbers were up 5.7 percent in June 2015 as compared with the previous June.
Overall, from January to June, as compared with 2014, passenger numbers at Bradley were up 1.5 percent. Logan Airport passenger numbers were up 4.4 percent from the previous year, while T.F. Green saw a decline of 1.3 percent.
July saw a decline in passengers at Bradley in the year-over-year comparison. Bradley’s passenger numbers were down 1 percent for the month – 534,071 in July 2015 versus 539,213 the previous year. T.F. Green Airport was also down, by 1.7 percent, while Logan saw its passenger numbers higher this year than last, by a considerable 6.8 percent.
In August, passenger numbers at Bradley were down again in 2015 as compared with 2014. The decline was 3.2 percent, dropping by more than 17,000 passengers, from 538,442 to 521,000. Logan was up again, by 6 percent, while T.F. Green’s numbers were virtually identical.
Even with the decline in slight declines in February, August and July, however, Bradley still showed a narrow net gain in passengers this year when compared with the first ten months of 2014, just over one percent. Through September, the calendar year total was 4,435,206. Among the carriers at Bradley, Southwest (621.027), Delta (489,853), the merged US Air/American (356,209) and JetBlue (310,432) saw the largest number of passengers boarding flights.
Earlier this fall, CAA officials announced the return of trans-Atlantic flights from Bradley, beginning in September 2016. Bradley will be one of three new  locations in the United States to offer Aer Lingus flights to Ireland. The daily service will include one evening departure from Bradley and one afternoon departure from Dublin. Published reports indicate that the State offered a $4.5 million guarantee against losses in each of the first two years, plus $5 million in other inducements to establish the Bradley-Dublin route. The financial inducements to Aer Lingus could reach $14 million: up to $9 million in loss protection from the state Department of Economic and Community Development and $5 million from the CAA, including $3.8 million in marketing over three years and about $1.2 million in waivers of various fees at the airport over two years, reports have indicated.
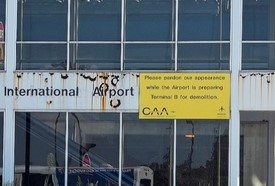 The demolition of the half-century old Terminal B is underway at Bradley, with plans for a transportation center, additional parking (for cars and planes), and free shuttle service from the airport to the train station in Windsor Locks in the planning stages.
The CAA also governs airports in Groton/New London, Danielson, Windham, Waterbury/Oxford, and Hartford/Brainard. The Authority’s November meeting was cancelled. It is next scheduled to meet on December 14. The CAA is led by a volunteer Board comprised of regional leaders in transportation, aviation, business, law, politics, economic development, and other areas of industry. The chair is Mary Ellen Jones of Glastonbury; the vice-chair is Michael T. Long of Simsbury.