Nationwide, Parents Seek Expanded Health Curriculum in Schools

In Connecticut, a planned, sequential PK-12 Coordinated School Health (CSH) education curriculum is a system designed to addresses the physical, mental, emotional and social dimensions of health.  CSH aims to improve students’ health and their capacity to learn through the support of families, communities and schools working together. A new nationwide survey indicates that the broader, comprehensive definition of health education is precisely what families are seeking in the health education of children.  Teaching kids about drugs, alcohol and sex appears to be less controversial than ever before with the majority of parents in a new poll saying schools should and do teach these subjects.school-health

Many parents want more — saying those topics are not enough — finds the University of Michigan C.S. Mott Children’s Hospital National Poll on Children’s Health. Researchers surveyed a nationally representative sample of parents with kids in middle or high school. Two-thirds of parents polled say schools should definitely cover emotional and mental health issues — which may include such subjects as dealing with depression, stress and bullying — yet only a third say these topics are currently covered by their child’s school.  Another 68 percent of parents want to see schools cover basic first aid, and 63 percent say kids should learn CPR.umh_c_mottpoll_healthed_supportvisual1x

A coordinated approach to school health aligns health and education efforts and leads to improved physical, mental and developmental outcomes for students, according to the State Department of Education (SDE) website. The department’s overview of the program indicates that “Students’ physical, social and emotional development requires the same level of ongoing assessment and support as their academic development.”

“Research has consistently concluded that student health and academic achievement are directly connected and, in fact, that student health is one of the most significant influences on learning and achievement,” SDE points out.

In the national survey, parents “clearly perceive a gap between what their children need and what they are receiving in the area of mental health education, as well as basic first aid and CPR,” says Sarah Clark, M.P.H., co-director of the C.S. Mott Children’s Hospital National Poll on Children’s Health.  “We are seeing increasing concerns for such issues as stress, depression and suicide among young people, and parents want schools to be a part of the solution. These results suggest that the stigma of mental health issues may have relaxed among today’s parents, in favor of using a broad array of resources to help children and adolescents with these critical areas.”

The Connecticut curriculum is designed to “motivate children and youth to maintain and improve their health, prevent disease, reduce health-related risk behaviors and develop and demonstrate health-related knowledge, attitudes, skills and practices.”

Nearly four in 10 parents (39 percent) in the Mott survey believe schools should educate students on how to use the health care system. But only one in 10 parents say the topic is covered in their child’s school. Low-income parents are more likely to say schools should teach students how to use the health care system—perhaps, Clark notes, because these parents face challenges themselves in accessing health care.  The survey does not include a state-by-state breakdown of the data.

Obesity Rate Climbs in Connecticut, Is Among the Nation's Lowest

Connecticut now has the 10th lowest adult obesity rate in the nation, according to The State of Obesity: Better Policies for a Healthier America. Connecticut's adult obesity rate is currently 25.3 percent, up from 16.0 percent in 2000 and from 10.4 percent in 1990.42

reportAccording to the most recent data, adult obesity rates now exceed 35 percent in four states, 30 percent in 25 states and are above 20 percent in all states. Louisiana has the highest adult obesity rate at 36.2 percent and Colorado has the lowest at 20.2 percent.

U.S. adult obesity rates decreased in four states (Minnesota, Montana, New York and Ohio), increased in two (Kansas and Kentucky) and remained stable in the rest, between 2014 and 2015. This marks the first time in the past decade that any states have experienced decreases — aside from a decline in Washington, D.C. in 2010.

The data, released in September 2016 by the Trust for America’s Health and the Robert Wood Johnson Foundation, reflects information compiled nationwide in 2015.

Connecticut’s childhood obesity rates are 15.8 percent for 2-to-4 year olds from low-income families, 15 percent of 10-17 year olds, and 12.3 percent of high school students.

Regarding obesity-related health issues, Connecticut ranked 31st among the states in the current adult diabetes rate, which is 9.3 percent, and 30th in hypertension at 30.4 percent of the population. rate

In 1985, no state had an adult obesity rate higher than 15 percent; in 1991, no state was over 20 percent; in 2000, no state was over 25 percent; and, in 2006, only Mississippi and West Virginia were above 31 percent.  Nationwide, obesity rates are higher among women (40.4 percent) compared to men (35.0 percent).


Efforts to Improve Math Education in CT Don't Yet Add Up, Report Finds

If Connecticut students are to excel in math, it will take a concerted effort at the state and district level, revised curriculum by state colleges preparing math teachers, and greater community involvement.  That overall effort, according to a new state report, still has a ways to go. The 30-member Commissioner’s Council on Mathematics report, issued last week, outlines recommendations for educators, policy leaders, and community members to improve K-12 mathematics education in the state.  The report stresses several recommendations that are grounded in the lessons learned regarding strong leadership, quality professional development, dedicated time, and effective collaboration within, among, and beyond school districts.report

The council outlines several specific actions for the State Department of Education, individual school districts, higher education, and the community in the report that are distilled into four broad recommendations. Each recommendation is evidence-based, actionable, inclusive of all stakeholders, and measurable.

The four broad recommendations are:

  • develop a clear and consistent understanding of the Connecticut Core Standards-Mathematics (CCS-M) at the classroom, school, district, and state levels;
  • provide the support and training necessary to effectively implement the mathematics standards with fidelity in all classrooms, schools, and districts;
  • implement appropriate interventions and acceleration to support the needs of a diverse group of learners; and
  • engage all stakeholders in the process of putting the Connecticut Core Standards-Mathematics into practice through effective communication that keeps teachers, parents and community members informed and participating in the process.

kids-in-class“Every student deserves the opportunity to receive a math education that is rich and rigorous, and equips them with the skills needed to graduate from high school prepared to be successful in both college and career,” said Commissioner Wentzell. “These recommendations by the Council on Mathematics have created a clear path that will help the State Department of Education take the steps needed to ensure that every student in our state receives a high-quality mathematics education.”

Next steps identified in the report include that “all stakeholders need to work and learn more in the area of mathematics education,” specifically as it relates to the following:

  • instructional support necessary for students with special needs to access the standards;
  • instructional support necessary for English learners to access the standards;
  • interconnectedness of curriculum, instruction, and assessment; and
  • teacher evaluation and certification requirements.

The framework for the recommendations was a logic model described as four buckets: Deep Knowledge of the CCS-M, Curriculum Development and Implementation, Intervention and Acceleration, Community and Family Engagement.

The Commissioner’s Council on Mathematics was initiated by Commissioner Wentzell in 2015 in response to the Smarter Balanced test results in mathematics. The council was convened to spearhead the state’s efforts to improve supports in mathematics by identifying best practices and exploring promising innovations in mathematics instruction.

Communities are urged, in some of the recommendations, to establish partnerships with local districts to create internships for high school students with businesses that require mathematics skills, use social media and distribution lists to promote the importance of the CCS-M, and urge community members to attend and participate in state- and district-provided workshops that deliver information about the standards.

Among a series of recommendations aimed at higher education, colleges are urged to:kids-computer

  • Increase mathematics coursework for elementary pre-service teachers.
  • Increase coursework that focuses on the mathematical practices at all levels.
  • Collaborate with district partners to ensure that pre-service teachers’ field experience is with a teacher who exhibits conceptual understanding, deep content knowledge, and effective use of the practices.
  • Mentor teachers and provide training specific to mathematics content and pedagogy to teachers who will be assigned a pre-service teacher.
  • Create professional learning workshops for in-service teachers to interact with professors at the university to make the connections of what is being taught at the K-12 level and how it is used in higher education.
  • Build relationships with high schools by promoting early college experiences in high schools
  • Require coursework in family engagement strategies for pre-service teachers.

math-quizCouncil members included parents, teachers, curriculum specialists, principals, superintendents, board of education members, higher education professors, business leaders, and State Department of Education staff members with the purpose of closely examining the current state of mathematics education in Connecticut.

The Commissioner selected the members through recommendations made by various stakeholder groups across the state, including the Connecticut Parent Teacher Association (CT-PTA), the American Federation of Teachers-Connecticut (AFT-CT), the Connecticut Education Association (CEA), the Connecticut Association of Schools (CAS), the Connecticut Business & Industry Association (CBIA), and the Connecticut State Department of Education (CSDE).  They met monthly from February 2016 to June 2016, and the recommendations were developed with the input of local school districts, higher education, and experts in family and community relations, according to the report.

CT Families Continue to Struggle Financially, United Way Report Reveals

More Connecticut households are struggling to pay for their most basic needs, according to a new report from United Way.  More than one out of four households - in one of the wealthiest states in the U.S. - are employed, yet still fall below what is needed to thrive financially.  That is an increase in both the number and percentage of such households in 2014 as compared with 2012, according to the updated ALICE report. Two years ago, United Ways introduced ALICE, which stands for - Asset Limited Income Constrained Employed - to place a spotlight on a large population of residents who are working, but have difficulty affording the basic necessities of housing, food, child care, health care and transportation.pie

In those two years, the problem has grown worse, even has the recession has given way to a slow economic recovery, in Connecticut and nationwide.  ALICE and poverty households combined account for 38 percent of households in the state that struggle to make ends meet.

A total of 361,521 Connecticut households fall into what the study describes as the ALICE population. These are households earning more than the official U.S. poverty level, but less than the basic cost of living. This is more than 2.5 times the number of households that fall below the federal poverty level. ALICE households make up 20% or more of all households in 114 (67%) of Connecticut’s 169 cities and towns.

The highest levels (ALICE and poverty households) were in Hartford (74%), New Haven (65%), Waterbury (63%), Bridgeport (63%) and New Britain (63%).  Also above 50 percent are Meriden, West Haven, East Hartford and New London.  From 2007 to 2014, two cities, Danbury and Waterbury, saw their total household population decrease, by 7 and 9 percent respectively, while the rest experienced an increase in households, with the largest increase of 8 percent in Stamford, according to the report. The number of household below the ALICE Threshold increased in every one of the nine largest cities and towns with Norwalk seeing the largest percent increase (38 percent).

2016-alice-report-update-coverWhile the prevalence of low-wage jobs still defines Connecticut’s economy for ALICE, for the first time in the past decade, the percent of jobs paying less than $20 per hour fell below 50 percent of all jobs.  The report also highlights a number of trends in Connecticut, including:

  • The population is aging, and many seniors do not have the resources they need to support themselves.
  • Differences by race and ethnicity persist and ethnicity persist, creating challenges for many ALICE families, as well as for immigrants in Connecticut.
  • Low-wage jobs are projected to grow faster than higher-wage jobs over the next decade.
  • Technology is changing the workplace, adding some jobs, replacing many others, while also changing where people work, the hours they work, and skills required. The report notes that technology creates opportunities as well as challenges for ALICE workers.

For the first time, an online simulator is also available to experience the financial challenges that ALICE households in Connecticut face at www.MakingToughChoices.org.  The updated Report uses data from a variety of sources, including the U.S. Census and the American Community Survey to provide tools that quantify the number of households in Connecticut's workforce that are struggling financially. The updated United Way ALICE Report reveals:

  • The composition of the ALICE population is men and women, young and old, of all races.
  • The breakdown of jobs in Connecticut by hourly wage (51% of jobs pay more than $20/hour) compared to what it costs to survive for a family of four (2 adults, 1 infant, 1 preschooler) - $70,788.
  • Every city and town in Connecticut has ALICE households. More than two-thirds of Connecticut's cities and towns have at least 1 in 5 households that fit the ALICE definition for financial hardship.cropped-alicemicrositelogo2

Poverty and ALICE households exist in every racial and ethnic group in Connecticut, but the largest numbers are among White non-Hispanic households. There were about one million White households in 2014, compared to 328,000 households of color (Figure 4 shows the populations of color for whom there is income data: Hispanic, Black and Asian). However, these groups made up a proportionally larger share of households both in poverty and ALICE: 64 percent of Hispanic households, 58 percent of Black households, and 30 percent of Asian households had income below the ALICE Threshold in 2014, compared to 31 percent of White households.

The largest population of color in Connecticut, Hispanics, has been growing since 2007, totaling 156,837 households in 2014, a 25 percent increase. As the number of Hispanic households increased, so did the number and proportion of Hispanics living below the ALICE threshold. The percentage of Hispanic ALICE households rose from 34 percent in 2007 to 39 percent in 2010 and then to 43 percent in 2014. Together Hispanic households in poverty and ALICE made up more than two-thirds of Hispanic households in 2014.

making-tough-choicesThere are some signs of improvement in the education gap among racial and ethnic groups, suggesting that some structural changes are occurring in Connecticut. In K-12 education, the Education Equality Index (EEI) shows that the achievement gap – the disparity in educational measures between socioeconomic and racial or ethnic groups – narrowed slightly between 2011 and 2014 in Connecticut.

Achievement gaps impact graduation rates and college performance. Among the Class of 2013, 64 percent of Black students and 59 percent of Hispanic students in the state went on to college within a year after graduating from high school, compared to 78 percent of White students. They also had lower 6-year college graduation rates: While 54 percent of White students got a college degree within 6 years, only 24 percent of Black students and 21 percent of Hispanic students did the same (Connecticut State Department of Education, 2015).

The updated ALICE Report recommends both short-term and long-term strategies to help ALICE families and strengthen our communities. United Ways work with many community partners to provide support to ALICE families to help them get through a crisis and avoid a downward spiral into even worse circumstances such as homelessness as well as assisting with financial literacy, education and workforce readiness.

Further, United Ways in Connecticut have invested more than $8.5 million in child care and early learning; $1.3 million in housing and homeless prevention work; $5 million in basic needs programs; and, have assisted working families in obtaining nearly $40 million in EITC and tax refunds and credits in 2016.

The updated Connecticut ALICE Report was funded by the 16 Connecticut United Ways. For more information or to find data about ALICE in local communities, visit http://alice.ctunitedway.org.  Connecticut United Ways are joining with United Ways in fifteen other states to provide statewide ALICE Reports. The updated Connecticut ALICE Report provides analysis of how many households are struggling in every town, and what it costs to pay for basic necessities in different parts of the state (Household Survival Budget).

https://youtu.be/u7gPJGu2psw

 [2014 ALICE introductory video]

Global Health and Innovation Conference, World's Largest, in New Haven in April

The Innovation Prize is a $10,000 and a $5,000 cash prize that is awarded to the two best social impact pitches that are presented at the 2017 Global Health & Innovation Conference, to be held in New Haven at Yale University on April 22-23, 2017. The Global Health & Innovation Conference (#GHIC) is the world's leading and largest global health conference as well as the largest social entrepreneurship conference, with 2,200 professionals and students from all 50 states and more than 55 countries, according to conference organizers.

The conference was developed by Unite for Site, a 501(c)(3) nonprofit global health delivery organization that is free of commercial interests and committed to promoting high-quality health care for all. GHIC 2017 will be Unite For Sight's 14th annual conference, having grown from a conference of about 100 participants in its first year.unite-for-sight-logo

Unite For Sight, headquartered on Church Street in New Haven, supports eye clinics worldwide by investing human and financial resources in their social ventures to eliminate patient barriers to eye care. Unite For Sight applies best practices in eye care, public health, volunteerism, and social entrepreneurship to achieve our goal of high-quality eye care for all. The programs are locally led and managed by ophthalmologists at Unite For Sight's partner eye clinics.

unite-2Unite For Sight's international eye care services with partner local eye clinics are provided year-round and are comprehensive, including examinations by local eye doctors, diagnosis and care for treatable conditions, education, and preventative care. The organization’s website indicates that Unite For Sight has provided eye care services to more than 2.1 million people worldwide, including more than 93,166 sight-restoring surgeries.

The conference is expected to include 300 speakers, including keynote addresses from:

  • Vanessa Kerry, Founder and CEO, Seed Global Health
  • Jeffrey Sachs, PhD, Director of Earth Institute, Columbia University; Quetelet Professor of Sustainable Development, Professor of Health Policy and Management, Columbia University; Special Advisor to Secretary-General of the United Nations Ban Ki-moon
  • Sonia Sachs, Director, Health Sector, Earth Institute, Columbia University; Health Coordinator, Millennium Village Project
  • Leana Wen, Baltimore City Health Commissioner

Unite for Sight was founded in 2000 by Jennifer Staple-Clark, then a sophomore at Yale University, in her dorm room. Unite For Sight is now a leader both in global health education and in providing cost-effective care to the world's poorest people. Staple-Clark, the organization’s Chief Executive Officer, is being honored in November by the Greater New Haven Chamber of Commerce as a Millennial Move Maker.unite

She is the recipient of the 2011 John F. Kennedy New Frontier Award, presented by the John F. Kennedy Library Foundation and the Institute of Politics at Harvard's Kennedy School of Government to "an individual whose contributions in the realm of community service, advocacy or grassroots activism have elevated the debate or changed the landscape with respect to a public issue or issues." In 2015, Middlebury College's Center for Social Entrepreneurship presented Jennifer with the Vision Award "to recognize leadership and vision in the world of social entrepreneurship."

Topics at the April conference will also include design thinking; education and school-based programs; environment health, energy, food and agriculture; healthcare delivery, university education initiatives; health policy, mental and neurological health; patient-centered initiatives; marketing communications; social entrepreneurship; surgery & global health; technology in global health; and non-communicable diseases.

unite-3The conference also includes Social Impact Labs, which provide an opportunity for selected speakers to present their new idea in the format of a 5-minute pitch. All of the presentations are ideas that are being developed, meaning that the ideas are in the brainstorming, early development, or early implementation stage.  Following each presenter’s 5-minute pitch, there is a 15-minute period for discussion and coaching with two expert speakers, questions, answers, and feedback from the audience.

For Innovation Prize at the 2017 GHIC, there are two categories: Early Stage (idea, program, or organization is less than 3 years old, and ideas in the brainstorming stage are also eligible) and Established Stage (program or organization is 3-6 years old). A newer program (0-6 years old) that is within an established (7+ year old) organization qualifies for the Social Impact Lab category as well.

https://youtu.be/Lt818tE5AUc

https://youtu.be/NtTtFAv-uTQ

Hate Words in School Setting Increasingly Target Race, Ethnicity and Sexual Orientation

It has been estimated that 160,000 teens nationwide skip school every day because of bullying.  Words of hate are a reason why. A recent report by the U.S. Department of Education indicates that among students ages 12 through 18 who reported being called a hate-related word at school, the percentage of students called a gender-based hate word decreased from 2001 to 2013, while the percentages of those students called race-, ethnically-, and sexual orientation-based hate words increased.

The report found that:

  • The percentage of students who were called hate words associated with race was greater in 2013 (50 percent), as compared to 2001 (34 percent).
  • The percentage of students who reported being called ethnically based hate words was greater in 2013 (29 percent), as compared to 2001 (22 percent).
  • The percentage of students who reported being called a hate word associated with sexual orientation was greater in 2013 (16 percent), as compared to 2001 (10 percent).
  • The percentage of students who were called gender-based hate words was lower in 2013 (15 percent), as compared to 2001 (23 percent).

hate-wordThe U.S. Department of Education July 2016 Data Point report from the National Center for Education Statistics includes data from the School Crime Supplement (SCS) to the National Crime Victimization Survey, a nationally representative sample survey of students ages 12 through 18, which were used to analyze trends in hate-related words. The SCS study is completed every other year.

In the study, students were asked if they had been called a hate-related word in the school building, on school property, on the school bus, or going to or from school, or if they had seen hate-related graffiti in school. Specifically, students were asked if during the school year anyone called them an insulting or bad name at school having to do with their race, religion, ethnic background or national origin, disability, gender, or sexual orientation (hate-related words). Students were also asked if they had seen any hate-related words or symbols (graffiti) written in school classrooms, school hallways, or outside of the school building.

The Southern Poverty Law Center (SPLC) has reported this year that “the gains made by years of anti-bullying work in schools have been rolled back in a few short months,” due to comments made as part of the Presidential campaign.  “Teachers report that students have been ‘emboldened’ to use slurs, engage in name-calling and make inflammatory statements toward each other,” explaining that “students have been emboldened by the divisive, often juvenile rhetoric in the campaign. Teachers have noted an increase in bullying, harassment and intimidation of students whose races, religions or nationalities have been the verbal targets of candidates on the campaign trail.”

The federal government’s stopbullying.gov website defines bullying actions to include “making threats, spreading rumors, attacking someone physically or verbally, and excluding someone from a group on purpose.”  The Bullying Prevention and Response Training and Continuing Education Online Program develschool-wordsoped by the federal Health Resources and Services Administration notes that “indirect bullying” includes “rumor spreading or encouraging others to exclude a peer.” Bullying is described as “a public health problem and requires a coordinated community response.”

“Harassing conduct may take many forms, including verbal acts and name‐calling” the U.S. Department of Education Office of Civil Rights pointed out in 2010 correspondence to the nation’s schools from Assistant Secretary of Civil Rights Russlynn Ali. The information provided pointed out that such behavior “fosters a climate of fear and disrespect that can seriously impair the physical and psychological health” of those subjected to it, and can “create conditions that negatively affect learning, thereby undermining the ability of students to achieve their full potential.”

The SPLC highlights the impact on students: “Every student, from preschoolers up through high school, is aware of the tone, rhetoric and catchphrases of this particular campaign season. Students are hearing conversations at home. They’re chatting, posting and joking on social media. Whether teachers decide to bring it into the classroom or not, kids are talking about it, modeling their behavior on that of political candidates and bringing heightened emotion to school along with their backpacks.”

UConn Study: Look-alike ‘Smart Snacks’ Confuse Students, Parents

Unhealthy snack food brands such as Cheetos, Fruit-by-the-Foot and Froot Loops have reformulated their products to meet new USDA Smart Snacks nutrition standards so they can be sold to kids in schools. But these products often come in packages that look similar to the unhealthy versions of the brands that are still sold in stores and advertised widely to youth. Selling these look-alike Smart Snacks in schools confuses students and parents, provides companies a way to market their brands to kids in schools, and may hurt schools’ credibility, according to a new study by the Rudd Center for Food Policy and Obesity at the University of Connecticut, published in the journal Childhood Obesity and reported by UConn Today.Exhibit_Revised-July (1)

It is the first to examine how selling look-alike Smart Snacks in schools affects attitudes about the brands and perceptions of schools selling these products.

“Kids think the healthier Smart Snacks they can buy in school are the same products that are sold in stores,” says Jennifer Harris, lead author of the study and director of marketing initiatives for the UConn Rudd Center. “It’s confusing because the packaging for these look-alike Smart Snacks looks so much like the less nutritious versions that kids see advertised on TV and in the stores.

“This is a great marketing tool,” she adds. “The snack makers get to sell their products in schools and at the same time market their unhealthy brands to kids every school day.”

The study involved an online experiment with 659 students 13 to 17 years old, and 859 parents of children 10 to 13 years old.  The participants viewed information about a hypothetical school that sold either look-alike Smart Snacks, regular versions of the same brands sold in stores, Smart Snacks in redesigned packages, or only brands whose regular products met Smart Snacks standards.

Specific findings of the study include:

  • Students and parents rated the healthier look-alike Smart Snacks similarly in taste, healthfulness, and purchase intent as the store versions, while considering Smart Snacks in different packages to be healthier but less tasty.
  • Most participants inaccurately believed they had seen look-alike Smart Snacks for sale in stores.
  • Participants also rated schools offering the look-alike Smart Snacks and the store versions of the brands as less concerned about students’ health and well-being.

RUdd
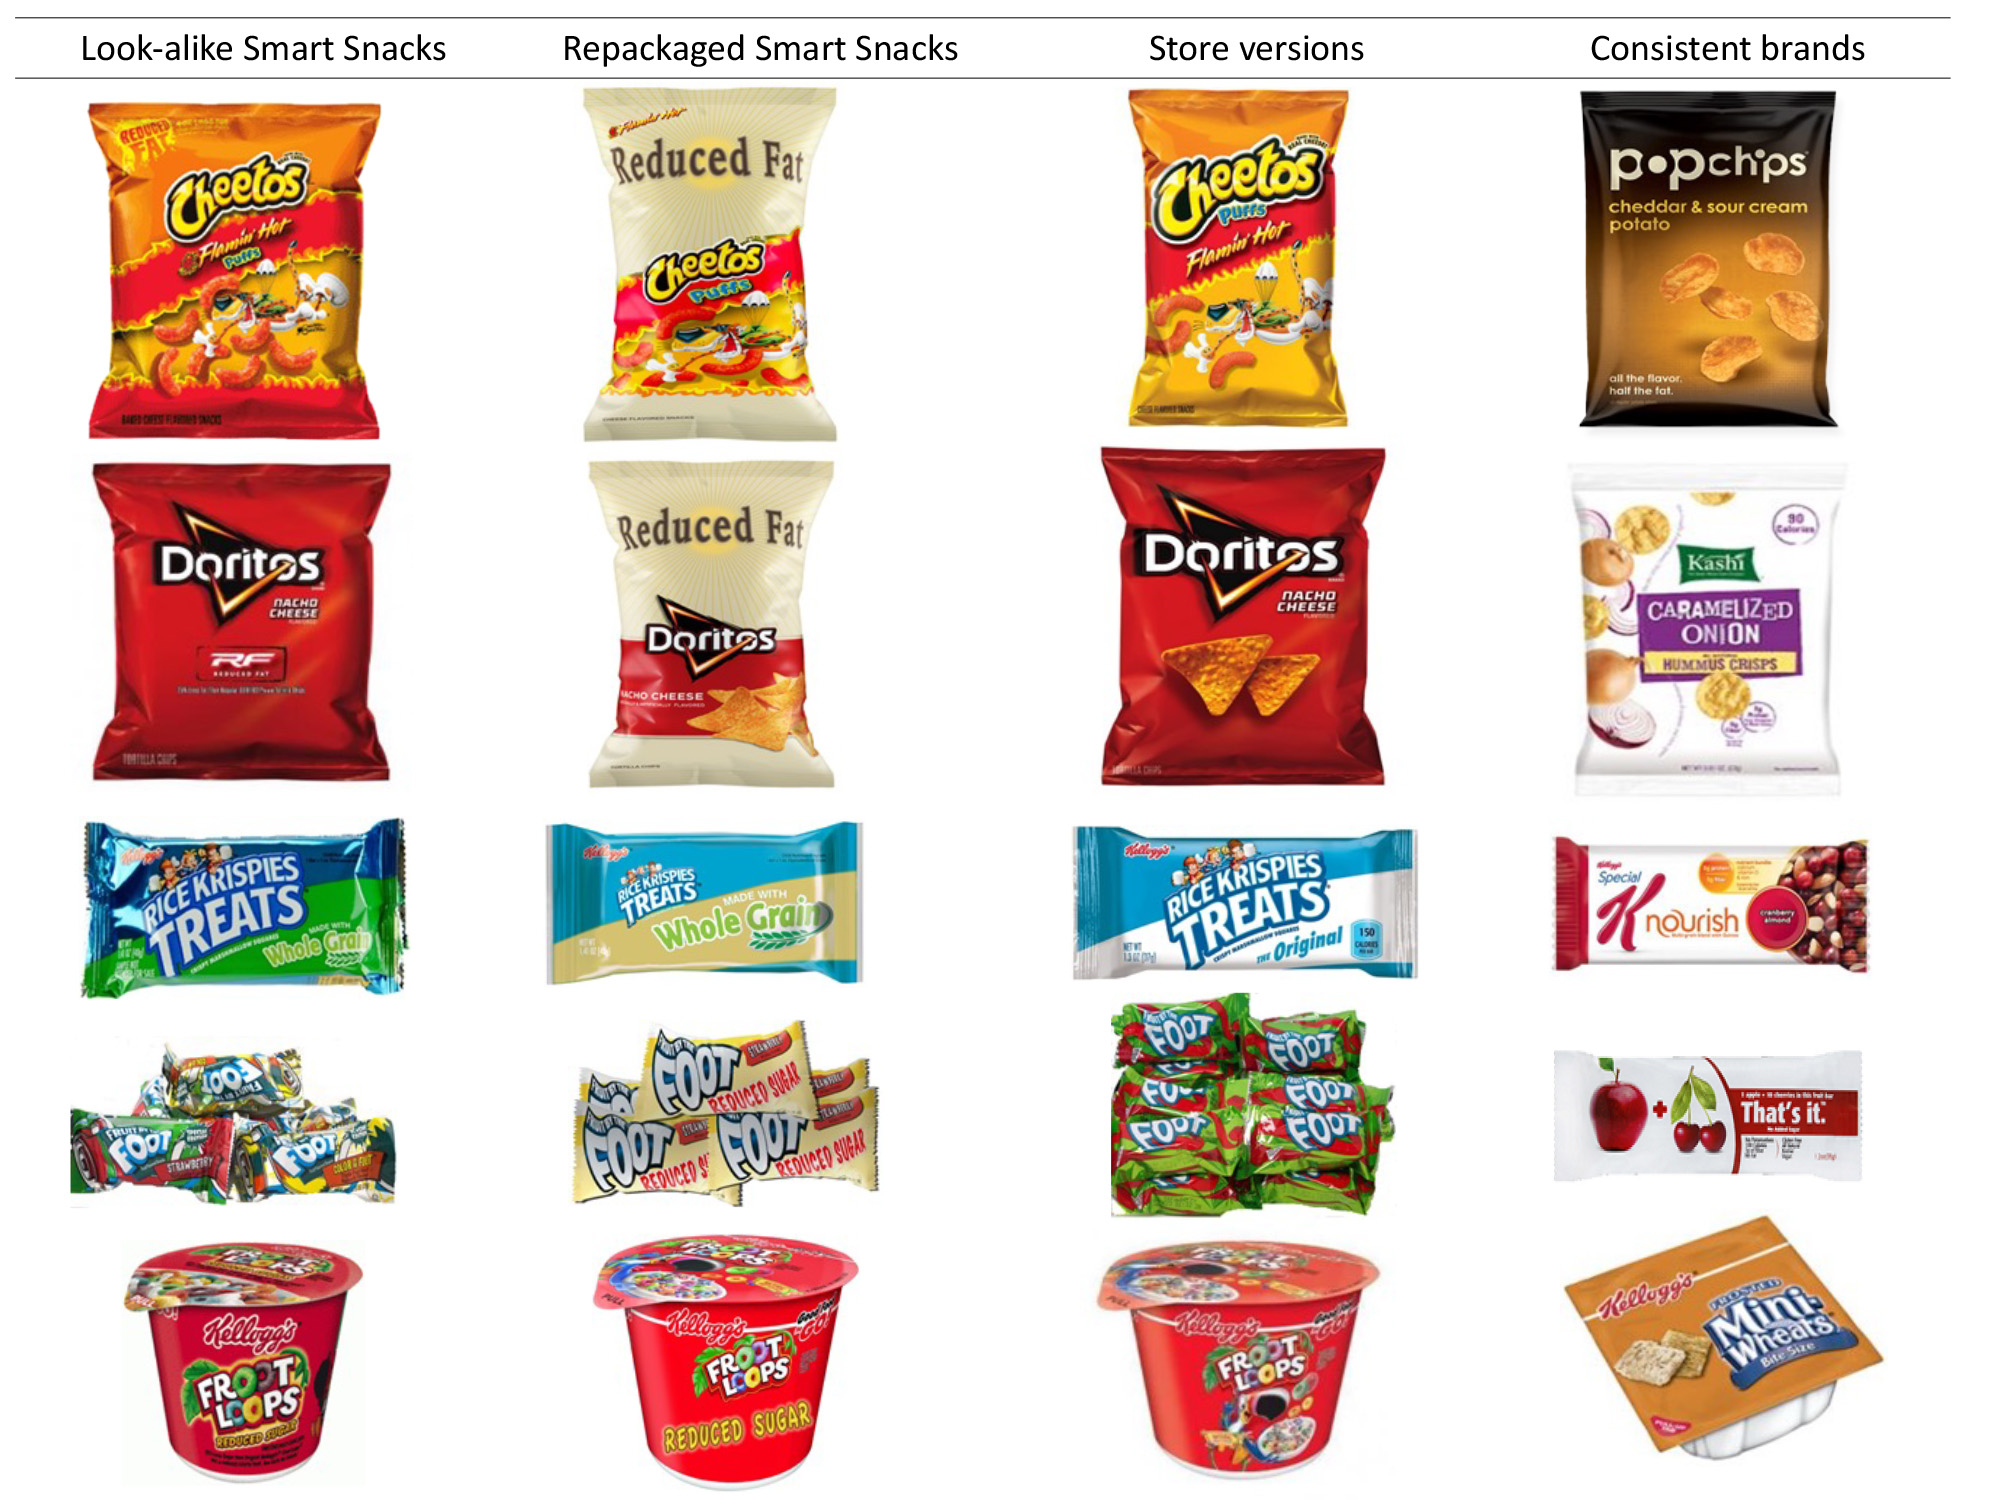
“The practice of selling look-alike Smart Snacks in schools likely benefits the brands,” says Harris, “but may not improve children’s overall diet, and undermines schools’ ability to teach and model good nutrition.”

The Rudd Center for Food Policy & Obesity relocated to UConn in 2015 after 10 years at Yale.  The Center is a distinguished multi-disciplinary policy research center dedicated to promoting solutions to childhood obesity, poor diet, and weight bias through research and policy. The Rudd Center is a leader in building broad-based consensus to change diet and activity patterns by conducting research and educating policy makers and the public.

The research was funded by a grant from the Michael & Susan Dell Foundation.

Childcare Costs Continue to Outpace Inflation, Low Income Families Hit Hardest; CT 6th Most Expensive

One of the more notable aspects of the latest data on consumer prices provided this month by the U.S. Bureau of Labor Statistics is the striking increase in childcare and nursery school prices.  That data, along with statistics that reflect the impact of those increasing costs on families ability to afford such care, highlight the struggles and disparities that continue to exist, in Connecticut and nationwide. Over the past 25 years, childcare and nursery school costs have risen 177 percent, while prices more generally have risen just 77 percent.  Childcare and nursery school costs have been outpacing general inflation for at least 25 years (the data do not go back any further than 1991);  this is putting a significant strain on the budgets of low-income families.

child care costsThe Center for Economic and Policy Research points to an August 2014 study by the U.S. Department of Agriculture that found a two-parent, middle-income family (those making between $62,000 and $107,000 per year) will spend an average of $245,000 (in 2013 dollars) on their kids between the ages of zero and 17.

Significantly, due to rising income inequality, poor families are finding it harder to give their children the same opportunities afforded to rich children, the study points out. At present, families in the top fifth of the income distribution spend seven times as much on their children as families in the bottom fifth.

“This inequality can also be observed for paid leave: about 23 percent of workers in the top tenth of the wage distribution have access to paid family leave, compared to just four percent of workers in the bottom tenth,” the findings show.

Child care in Connecticut, the Economic Policy Institute points out, “is expensive.” Connecticut is ranked 6th out of 50 states and the District of Columbia for most expensive infant care.

  • The average annual cost of infant care in Connecticut is $13,880—that’s $1,157 per month.
  • Child care for a 4-year-old costs $11,502, or $959 each month.

Childcare is also “unaffordable” for a large percentage of Connecticut famiies.  The Economic Policy Institute indicates that infant care for one child would take up 16 percent of a typical family’s income in Connecticut, noting that according to the U.S. Department of Health and Human Services (HHS), child care is affordable if it costs no more than 10% of a family’s income. By this standard, only 28.1% of Connecticut families can afford infant care.

costsA minimum-wage worker in Connecticut would need to work full time for 36 weeks, or from January to September, just to pay for child care for one infant. And a typical child care worker in Connecticut would have to spend 63.6% of her earnings to put her own child in infant care, according to the data.

CEPR points out that other costs for raising children have increased as well, also outpacing the inflation rate. For instance, elementary and high school tuition and fees have risen 3.2 percent over the past year (four times the overall inflation rate of 0.8 percent); college tuition and fees are up 2.7 percent. At the same time, infant care in Connecticut costs $3,752 (37.1%) more per year than in-state tuition for 4-year public college, according to the Economic Policy Institute.

According to the Organisation for Economic Cooperation and Development (OECD), public expenditure on pre-primary education and childcare is just 0.4 percent of GDP in the United States; this is far lower than the rates of spending in Denmark (2.0 percent of GDP) or Iceland and Sweden (1.6 percent). By this measure, the U.S. comes in 33rd out of the 36 countries surveyed by the OECD, according to the CEPR report.up

Public expenditure on pre-primary education spending is 0.3 percent of GDP in the U.S. but averages 0.5 percent in the other OECD countries; even more shockingly, public expenditure on childcare is just 0.06 percent of GDP, well short of the 0.4 percent average from the rest of the OECD. Nor do differences in GDP make up for the latter gap.  In 2011, public expenditure on childcare was $794 per child in the U.S., less than one-third of the OECD average. By contrast, public spending on childcare is $7,100 per child in Finland, $6,400 in Norway and Denmark, $5,900 in Sweden, and $5,700 in Iceland — despite the fact that the U.S. is substantially richer than all those countries except Norway.

In a separate survey, the OECD found that just 14 percent of all public spending on children in the U.S. went to children age five and under — dead last among the 32 OECD countries in the sample. In the United States, 14 percent of all public spending on children goes to children ages zero to five; 41 percent goes to children ages six to 11; and 45 percent goes to children ages 12 to 17. For the other 31 countries (data were not available for Canada and Turkey), 26 percent of all public spending on children went to children ages zero to five; 35 percent went to children ages six to 11; and 39 percent went to children ages 12 to 17, the Center for Economic and Policy Research explained.

E-Cigarettes Remain Controversial as New Federal Law, Yale Academic Study Weigh In

Even as new federal rules restricting the sale of e-cigarettes take effect, advocates in Connecticut continue to urge state lawmakers to impose tougher restrictions on electronic cigarettes and vapor products when they reconvene next year.  They warn that a growing number of young people are using these electronic delivery systems to "smoke" what could be harmful and addictive substances. The U.S. Food and Drug Administration announced rules earlier this year that will forbid e-cigarette shops nationwide from selling the products to people younger than 18 and will require staff to ask for identification that proves customers are old enough to buy.  The rules – which take effect this month - would also extend long-standing restrictions on traditional cigarettes to a host of other products, including e-cigarettes, hookah, pipe tobacco and nicotine gels. Minors would be banned from buying the products.e-cigs-poison

Teens who initially tried e-cigarettes because of their low cost had significantly stepped up their use of e-cigarettes by the time researchers checked in six months later, according to a study that senior researcher Suchitra Krishnan-Sarin, a professor of psychiatry at Yale University School of Medicine, told WebMD in an article published last week.  The low cost of the devices and the promise they can help teens quit smoking tobacco are the two strong predictors of continued use, she said.

In addition, teens who tried e-cigarettes to quit smoking were more than 14 times more likely to keep using e-cigarettes than those who did not consider this a reason to try the devices, the findings showed.  However, e-cigarettes didn't seem to help the kids quit. Four out of five teens who tried e-cigarettes to quit smoking were still puffing regular cigarettes six months later, the investigators found.

"Even though they said they were using e-cigarettes to quit smoking, it doesn't appear to have necessarily helped them," Krishnan-Sarin said.

Jennifer DeWitt, executive director of the Central Naugatuck Valley Regional Action Council, told members of the General Assembly's Public Health Committee this spring that every principal in the 12-town region her organization covers "has a desk drawer of these items that were confiscated from teens this year," including some retrofitted to smoke marijuana, the Associated Press reported.flavor

"Tobacco is a success story for us in the overall picture of prevention. However, we will take a back-slide if electronic nicotine delivery devices continue to be available in the ways that they are currently," DeWitt said.  She said 7.2 percent of Connecticut high school students are e-cigarette users, marking a higher usage rate than all tobacco products combined.

According to the CDC, nationally, 7 out of 10 middle and high school students who currently use tobacco have used a flavored product. In addition:

  • 63% of students who currently use e-cigarettes have used flavored e-cigarettes (1.6 million)
  • 61% of students who currently use hookah have used flavored hookah (1 million)
  • 64% of students who currently use cigars have used flavored cigars (910,000)

Beginning this month, retailers are prohibited from selling the tobacco products to those under 18, placing them in vending machines or distributing free samples, under the new FDA rules. While nearly all states already ban sales of e-cigarettes to minors, federal officials said they will be able to impose stiffer penalties and deploy more resources to enforce the law. The FDA action comes five years after the agency first announced its intent to regulate e-cigarettes and more than two years after it floated its initial proposal, according to published reports.

“Millions of kids are being introduced to nicotine every year, a new generation hooked on a highly addictive chemical” Health and Human Services Secretary Sylvia Burwell said. “We cannot let the enormous progress we’ve made toward a tobacco-free generation be undermined by products that impact our health and economy in this way.”

The CDC indicated that in 2013, more than a quarter million middle and high school students who had never smoked regular cigarettes had used e-cigarettes, a number that had grown three-fold in just two years. A high proportion of middle and high school students saw e-cigarette advertisements (in 2014) from one or more of the following four sources: retail, Internet, TV/movies, and Magazines/newspapers. Overall, 66% of Middle School Students and 71% of High School Student.

sourcesThe New Haven Register reported that Dr. Roy Herbst, chief of medical oncology at the Yale Cancer Center and Smilow Cancer Hospital, said state and federal policy-makers should do more to rein in the spread of the devices.

“It didn’t go as far as we would’ve liked but it’s a good step in the positive direction and allows for more research,” Herbst said of the new federal rule. “I think now that we finally have this regulation, it will begin to stem the rapid use of e-cigarette use that is running rampant in the United States and around the world.”


CCMC Study Brings Attention to Dramatic Increase in Trampoline Injuries Nationwide

As trampoline parks are becoming more common in Connecticut and across the United States, so are emergency department visits for injuries that occur at these facilities, a new national study led by physician researchers at Connecticut Children’s Medical Center (CCMC), has found. The study published this month in the journal Pediatrics, co-authored by CCMC emergency physicians Steven Rogers, MD, and Jesse Sturm, MD, and pediatric emergency medicine fellow Kathryn Kasmire, MD, came about after the physicians began noticing a sharp increase in trampoline injuries, including some that were serious.trampoline

For the study, the CCMC physicians analyzed emergency room reports from a national database to estimate the total number of trampoline-related injuries both from parks and trampolines at home. From 2010 to 2014, the average annual number of Emergency Department visits for trampoline injuries was close to 92,000.

The vast majority happened at home - but injuries at trampoline parks surged more than 10-fold during the study period. The study found that emergency room visits related to injuries at trampoline parks grew from 581 in 2010 to 6,932 in 2014, which was the latest year represented in the study. Patients injured at trampoline parks were more likely to be males, with an average age of 13.

The study concluded that “trampoline park injury patterns differed significantly from home trampoline injuries. Trampoline park injuries are an emerging concern; additional investigation and strategies are needed to prevent injury at trampoline parks.”

The number of trampoline parks in the United States also increased during that time frame from around 40 in 2011 to 280 in 2014. It is now estimated that nationwide, five to six new parks open each month. Over the last year alone, it is estimated that more than 50 million people visited trampoline parks in North America, according to the International Association of Trampoline Parks.

In Connecticut, trampoline parks are up and trampoline chartrunning in communities including Hartford, New Britain, Trumbull, Bethel, Stamford, Norwalk, Manchester, Milford, Danbury, New Milford, Ridgefield, Brookfield, Wallingford.  Another is expected soon in East Haven.

The state’s official tourism website, www.ctvisit.com, includes six trampoline parks among the places highlighted for “safe, family-friendly indoor recreation.”  The “Connecticut – Still Revolutionary” site features information about, and links to, Launch Trampoline Park in Hartford, Sky Zone in Bethel and Norwalk, Chelsea Piers in Stamford, Rockin’ Jump Trampoline Park in Trumbull and Flight Trampoline Park in New Britain.

The study found that the majority of trampoline-related accidents occur at home — rather than at a park — and these accidents did not increase significantly from 2010 to 2014, nor did overall trampoline injuries.

The International Association of Trampoline Parks (IATP) said the rise in injuries should be expected because of more parks in recent years. "We believe that the positives of youth recreational sports far outweigh the negatives, and we are actively engaged in programs aimed at promoting the safety and well-being of jumpers who visit our member parkarticles," the organization said following publication of the study.

"I don't think trampoline park injuries are increasing because they are especially dangerous compared to home trampolines, but rather because of their growing popularity and the increasing number/availability of these facilities," said Kasmire, indicating that 1 in 11 children or young adults who went to the emergency room for park injuries was admitted to the hospital.

Most of the injuries were leg injuries, including strains and fractures. Children injured at trampoline parks were less likely to have head injuries than those injured on trampolines at home, but the severity of park-related injuries was concerning, the authors said.

In a published report, Kasmire said that parks generally have done a good job of ensuring that youngsters do not fall off trampolines, reducing the likelihood of head injuries, because the floors are covered with a bouncy surface. This floor, though, can increase the risk of other injuries if a person lands between two trampolines, she said.blue

The American Academy of Pediatrics advises against trampoline use for all children but says if children do use them, they should not do flips or have more than one jumper at a time on a trampoline. The academy said adult supervision is needed and that trampolines should also have proper padding.

The IATP indicated that the organization “welcomes studies like the one published” because they “provide a deeper understanding of safety issues and provide data on our sport allowing us to better educate parents, jumpers and parks so all can fully enjoy indoor trampoline park facilities.”

The trade organization also noted that “if the study reported Trampoline Park Injuries (TPIs) as a percentage, rather than a total, a more accurate industry picture would develop. As a point of reference, high school football players experience injuries at a rate of 3.87 per 1,000 exposures. The rate of reportable injury at a typical trampoline park is less than one per 10,000 jumpers.  Therefore, the rate at which injuries occur is a much more meaningful statistic than total number of injuries.”

The study in Pediatrics notes “adult supervision has been proposed to reduce trampoline injuries in children, although trampoline injuries often occur despite adult supervision.”  The study also states that “although only a fraction of trampoline-related injuries occurred at trampoline parks (11% in 2014), the trend is alarming.”