Five Connecticut communities – Danbury, Hartford, Stamford, Torrington and West Hartford - will share approximately $8.5 million in funding under the second phase of the state’s 2017 Responsible Growth and Transit-Oriented Development (TOD) Grants. They are the latest in a series of competitive state grants to be awarded in recent years to support the development and implementation of TOD initiatives around the state.
The competitive grant program “supports transit-oriented development and responsible growth in the state and is targeted at boosting economic activity and creating jobs,” according to state officials. Administered by the Office of Policy and Management (OPM) the grants rely on a combination of funding from the Responsible Growth Incentive Fund and the Transit-Oriented Development and Pre-development Fund.
A year ago, OPM released a request for applications for the current grant program, and the State Bond Commission approved a total of $15 million to be used – comprised of $5 million from the Responsible Growth Incentive Fund and $10 million from the Transit-Oriented Development and Pre-development Fund. Following that, OPM – with input from other state agencies – reviewed, rated, and ranked each of the proposals.
In this round of funding, Danbury’s Downtown Streetscape Project is receiving $2 million to prepare design drawings and construct sidewalk and streetscape infrastructure improvements along key downtown pedestrian routes within the vicinity of the Danbury train station. Improvements include the new construction or replacement of sidewalks, intersection improvements, landscaping, removal and installation of street trees, ornamental lighting, and pedestrian access improvements as detailed in the city’s Downtown TOD Planning Study.
Stamford’s Springdale TOD Implementation project is receiving $1,994,188 to prepare design and engineering drawings and construct improvements around the Springdale train station consistent with the recommendations of the Glenbrook/Springdale TOD Feasibility Study. Improvements include safer bicycle and pedestrian access to the village center and rail station, realignment and modification of the station’s main entrance at Clearview Avenue, and other improvements to landscaping, lighting, and general accessibility in and around the station area.
In Torrington, the East Main Street (Route 202) Sidewalk Implementation will receive $1,997,700 to construct new sidewalks, and repair/replace existing sidewalks along portions of East Main St (Route 202) between Torrington Heights Road and the Big Lots Plaza. The city will use a portion of the funding to evaluate existing conditions at nine signalized intersections within the project boundary, and at more complex sections of roadway which lack sidewalks, to determine if additional pedestrian improvements are feasible.
Hartford’s Main Street Complete Streets Vision Plan and Innovation District Activation will receive $450,000 to develop a Complete Streets Vision Plan for a section of Main Street from State House Square to the vicinity of South Green in order to identify improvements to bike and pedestrian amenities, and prepare complete construction documents for future buildout. In addition to bike and pedestrian amenities, the final plan is to identify potential improvements to transit services, new streetscaping, a new cycle track, and other linkages to improve bike and pedestrian connections within the project area.
A portion of Hartford’s funding will also be used to implement the Innovation District Activation Program, to provide grants to new and existing businesses within the project area to support capital and other investments such as façade improvements, building infrastructure, marketing, business planning, public events, and other business/community support services with the objective of creating vibrant employment and residential hubs.
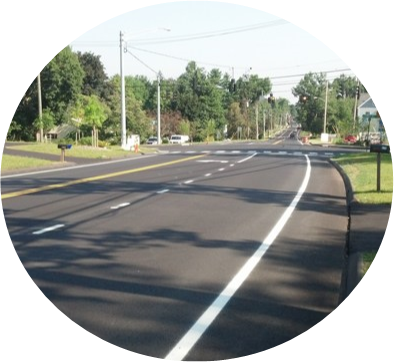
West Hartford’s New Park Avenue Complete Streets Implementation will receive a grant of $2,000,000 to construct complete streets infrastructure improvements along New Park Avenue from New Britain Avenue to Oakwood Avenue, consistent with the recommendations of the 2017 New Park Avenue Transit Area Complete Streets Study. Improvements include a road diet with center turn lane, landscaped medians and protected bike lanes, new street trees, lighting, wayfinding signage and other amenities, and a pocket park at the gateway to the Trout Brook Trail.
“Transportation isn’t just about cars, trains, and buses – it’s about building vibrant communities and continuing to make Connecticut a more attractive place to live, visit and do business,” Gov. Malloy said in announcing the grants. The awards “will build upon the smart, targeted investments we have made in recent years, which have already led to significant growth in transit-oriented development across the state.”
The first round of grants under the current initiative were released in December 2017, with eleven projects to receive $15 million. Communities selected to receive funds were Berlin, Clinton, East Windsor, Madison, New Britain, Norwalk, Stratford, Wallingford, Winchester, Windsor Locks, and the Southeastern Connecticut Council of Governments.
In 2016, state officials announced that twenty projects in towns and cities across Connecticut would receive a total of nearly $11 million to transit-oriented development and responsible growth, targeted at boosting economic activity and creating jobs. At the time, Gov. Malloy said “Our focus is on not only improving overall quality of life for residents in these areas, but also encouraging economic development by making our towns and cities more accessible."
Communities selected were Berlin, Branford, Canton, Clinton, Danbury, Hartford, Madison, New Canaan, New Haven, Old Saybrook, Torrington/Winsted, Waterbury, Westport, Windsor, and Windsor Locks. Also receiving funds were the Capitol Region Council of Governments, Naugatuck Valley Council of Governments, and Northwest Hills Council of Governments.
Previously, 11 state grants between $75,000 and $150,000 were provided in 2015 to “prospective planning projects that best support transit oriented development.” Receiving the state grants were Berlin, Bethel, Bridgeport, Enfield, Meriden, Milford, New Britain, New Haven, Stratford, Wallingford and West Hartford.


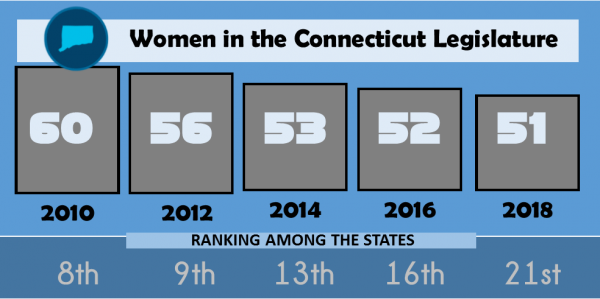 The 2018 election year has been widely declared the year of the woman in politics, a reaction to the MeToo movement and related issues that have risen to the top of many political agendas. It appears that Connecticut ballots may have a record number of women candidates in November, depending upon the outcome of the August 14 primaries in some legislative districts.
 Leading the nation were Arizona (40%), Vermont (40%), Nevada (38.1%), Colorado (38%), Washington (37.4%), and Illinois (35.6%). Women make up 25.4 percent of all state legislators
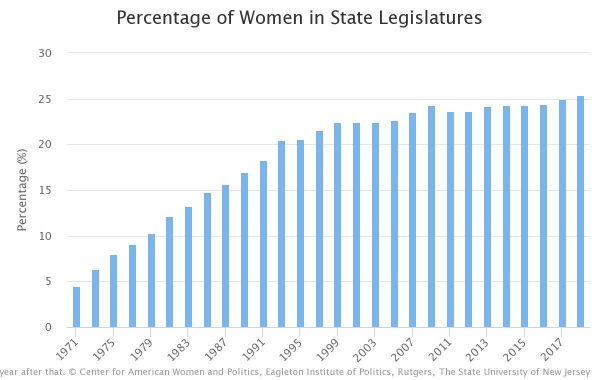

 According to the Nature Conservancy, Bridgeport currently has a 19% tree canopy cover, for example. If all open spaces, vacant lots and parking lots could be planted, the city would have a 62% tree canopy cover. The ramifications would be substantial, impacting various health and quality of life factors.
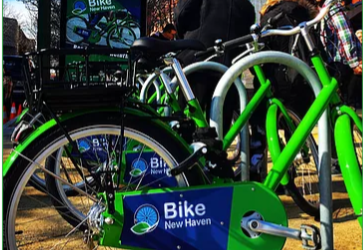 The ranking saw Davis and Berkeley California named the safest cities for bicyclists, followed by Boulder, Colorado; Eugene, Oregon; Palo Alto, Chico, and Mountain View, California; Fort Collins, Colorado; Santa Barbara, California, and New Haven. Minneapolis ranked number 12.
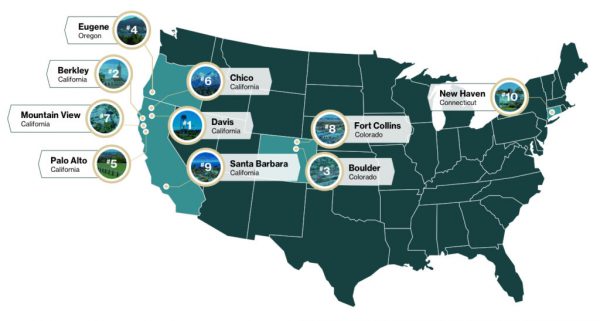

 In its Corporate Social Responsibility
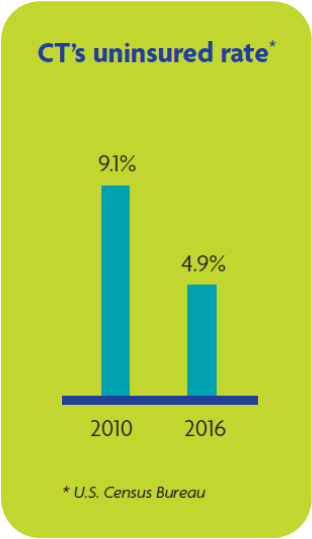
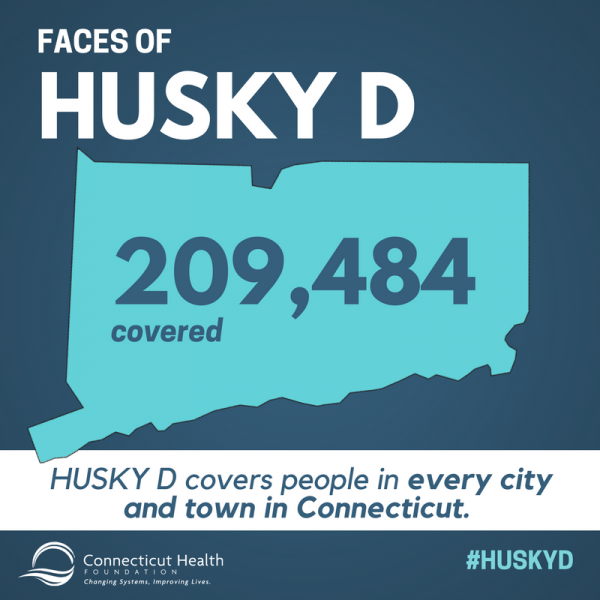 han 90 percent of the cost of the program, allowing Connecticut to cover more than 200,000 people with a relatively small budgetary impact.” Currently, the federal government pays 94 percent of the cost of coverage and the state pays 6 percent. The report also identifies challenges associated with HUSKY D, including concerns raised by health care providers about Medicaid payment rates and uncertainty in federal funding.
 The purpose of the pilot program, according to OPM, is to encourage and allow for the testing of fully autonomous vehicles (FAV) on local highways in Connecticut. The goal for the pilot program is to allow a variety of FAV testing to occur in four municipalities throughout the state, bringing Connecticut to the forefront of the innovative and burgeoning autonomous vehicle industry.
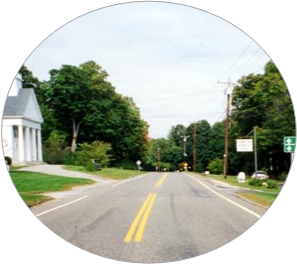
 The state law outlines a framework of the minimum requirements to be included in agreements between municipalities and autonomous vehicle testers approved for participating in the Fully Autonomous Vehicle Testing Pilot Program (FAVTPP). The Connecticut law, according to the
 The survey found that 38 percent of students whose grades were mostly A’s texted or e-mailed while driving a car on at least one occasion in the 30 days prior to the survey. The percentage was slightly less among students with lower grades: 31% of students with mostly B’s, 30% of students with mostly C’s and 23% of students with mostly D’s and F’s.
 The ranking does not capture the full extent of deprivations or hardships affecting children. Instead, it focuses on some key rights, or “guarantees” of childhood: life, healthy growth and development, education and protection from harm. If a child experiences all of these, his/her childhood is considered to be “intact.”
 The report notes that “While children are only 20 percent of the population, they are 100 percent of America’s future.” Save the Children’s ranking reveals children in New Jersey, Massachusetts, Vermont and New Hampshire are far more likely to experience safe, secure and healthy childhoods than children in Louisiana, Mississippi, Oklahoma and New Mexico.