Combatting Childhood Obesity Starts From Day One; Wide-Ranging Policies Proposed

Less “screen time,” more physical activity, more nutritional foods and fewer sugary beverages – that’s the formula to prevent obesity from taking root in infants and toddlers in the formative years of childhood, according to new recommendations by the Child Health Development Institute (CHDI) of Connecticut.  A series of “science-based policy opportunities” for Connecticut, outlined this week, also include support for breastfeeding in hospitals and child care centers.scale The need for stronger action is underscored by recent statistics.  In Connecticut, one of every three kindergartners is overweight or obese, as is one of every three low-income children. Children who are overweight or obese are more likely, according to the policy brief, to have:

  • risk factors for future heart disease, such as high cholesterol and high blood pressure
  • a warning sign for type 2 diabetes called “abnormal glucose tolerance,” although many children are being diagnosed with the full-blown disease in increasing numbers
  • breathing problems such as asthma
  • gallstones, fatty liver disease, and gastroesophageal reflux (acid reflux and heartburn)
  • problems with their joints

“Recent research shows that obesity may be very difficult to reverse if children are not at a healthy weight by 5 years of age,” the policy brief indicated. “Investing early in preventing childhood obesity yields benefits for all of us down the line by fostering healthier children, a healthier population overall and greatly reducing obesity-related health care costs over time.”

The policy brief recommends five ways Connecticut’s child care settings and hospitals can help our youngest children grow up at a healthy weight:

  1. Support breastfeeding in hospitals and in child care centers and group child care homes.
  2. Serve only healthy beverages in all child care settings.
  3. Help child care centers and group child care homes follow good nutrition guidelines.
  4. Increase physical activity time for infants and toddlers in all child care settings.
  5. Protect infants and toddlers in all child care settings from “screen time.”

The recommendations stress that “talking, playing, singing and interacting with people promotes brain development and encourages physical activity,” and urges that healthy infant and toddler development be encouraged by:

  • Never placing them in front of televisions, computers, or tablets to occupy them
  • Never allowing infants and toddlers to passively watch a television, computer, mobile phone or other screen that older children in the same room are watching

“Healthy lifelong weight begins at birth,” said Judith Meyers, President and CEO of CHDI and its parent organization the Children’s Fund of Connecticut. “Investing in obesity prevention policies makes sense for Connecticut.”  Meyers added that “the numbers are staggering,” and it has become clear that “to really address this problem we need to prevent it in the first place.”

If Connecticut were to implement the five recommendations highlighted in the policy brief, it would be the first state in the nation to do so, officials said. 1-5 A number of the proposals have been successfully implemented in other jurisdictions, including states and cities.  Marlene Schwartz, Director of UConn's Rudd Center for Food Policy and Obesity, noted that Connecticut has long been a leader in providing nutritional lunches in schools, and said that now the state’s attention needs to move to the earlier years of childhood.  “The field has realized that we need to start even earlier,” she said.  Rudd also indicated that determining "policy changes that might help reduce the disparities" in Connecticut, which are apparent in race, ethnicity and socioeconomic data, is also essential.

Legislation now pending at the State Capitol, which is not as comprehensive as the policy brief recommendations, is designed to "increase the physical health of children by prohibiting or limiting the serving of sweetened beverages in child care settings, prohibiting children's access to certain electronic devices in child care settings, and increasing children's participation in daily exercise."  The proposed legislation, HB 5303, was recently approved by a 10-3 vote in the Committee on Children, but has an uncertain future before the full legislature.

Dealing with childhood obesity has been a challenge because of the “many different systems and programs that impact childhood development – which can also provide “many different places for opportunities to influence what happens.”  Officials said that some of the policy proposals can be realized through legislative action, others by regulatory changes, and others through voluntary initiatives.  They indicated that since Connecticut established the Office of Early Childhood in recent years, coordination of oversight and services has improved, which is an encouraging development.  Child care settings provide an opportunity to impact a large proportion of the state’s pre-kindergarten children, but plans to disseminate the message more broadly, including through pediatrician’s offices, are being considered. obesity consequences

The recommendations call for “allowing toddlers 60-90 minutes during an 8-hour day for moderate to vigorous physical activity, including running, and “adherence to federal nutrition guidelines” including more whole grains and low-sugar cereals, no sugary drinks, and fewer fried foods and high-sodium foods.  Through 11 months, infants should be served “no beverages other than breast milk or infant formula, and those 12 months through 2 years old should be served no beverages other than breast milk, unflavored full-fat milk water, and no more than 4 ounces of 100% fruit juice.”

The CHDI policy brief indicates that “childhood obesity can contribute to poor social and emotional health because overweight and obese children are often bullied and rejected by their peers as a result of their weight. That stress can affect every part of their development, interfering with their learning (cognitive), health (physical and mental), and social well-being.”

k obeseThe recommendations, described as “affordable, achievable, common sense measures,” were prepared for CHDI as part of a grant to the UConn Rudd Center for Food Policy and Obesity, funded by the Children’s Fund of Connecticut.  The author was public health policy consultant Roberta R. Friedman, ScM.

CHDI began focusing on strategies to promote healthy weight in children from birth to age two after publishing thechdi_logo IMPACT “Preventing Childhood Obesity: Maternal-Child Life Course Approach” in 2014. The report reviewed scientific research on the causes of obesity and explored implications for prevention and early intervention. In 2015, the Children’s Fund of Connecticut funded four obesity prevention projects in Connecticut that addressed health messaging, data development, policy development and baby-friendly hospitals.

Unemployment Drops in Waterbury, Norwich/New London Lead CT; Unemployment Lowest in Danbury

The unemployment rate in greater Waterbury and the Norwich-New London saw a larger decrease during the past year than Connecticut’s other large metropolitan areas, and the state’s lowest unemployment rate can be found in Danbury, according to new data released by the U.S. Bureau of Labor Statistics. Danbury was the only one of the state’s six largest metro region to crack the top 200 for lowest unemployment rate, earning a spot at number 168. The year-over-year unemployment data shows that unemployment rates were lower in January 2016 than a year earlier in 333 of 387 metropolitan areas in the U.S., higher in 43 areas, and unchanged in 11 areas. In Connecticut, the six major metropolitan areas all saw a decline in the unemployment rate.chart

Nationwide, the unemployment rate dropped eight-tenths of a point, from 6.1 percent in January 2015 to 5.3 percent in January 2016.  Only one Connecticut region – Danbury – had a lower unemployment rate, at 5.1 percent.  Generally in Connecticcut, the larger the unemployment rate in January 2015, the larger the drop over the following year.

The one percent drop in unemployment in Waterbury and Norwich-New London-Westerly ranked each region tied for 124th for the largest drop in the nation.  Also reaching the top 200 for the largest reduction in unemployment was the Hartford-West Hartford-East Hartford area, ranking 197th with a drop of 0.7 percent, from 6.7 percent to 6.0 percent.

Even with the drop in unemployment, Waterbury’s jobless rate is the highest among the state’s major urban areas, at 7.4 percent. Bureau-of-Labor-Statistics

In this year’s rankings, Waterbury was number 342 with an unemployment rate of 7.4 percent. Norwich-New London-Westerly was at number 295 with an unemployment rate of 6.4 percent.  New Haven and Hartford-West Hartford-West Hartford were tied at number 263 with an unemployment rate of 6.0 percent, and Bridgeport-Stamford-Norwalk at number 235 with an unemployment rate of 5.8 percent, down from 6.3 percent a year ago.

Ames, Iowa, and Boulder, Colo., had the lowest unemployment rates in January, 2.5 percent each. El Centro, Calif., had the highest unemployment rate, 19.2 percent. A total of 187 areas had January jobless rates below the U.S. rate of 5.3 percent, 184 areas had rates above it, and 16 areas had rates equal to that of the nation.

CT Obesity Rate is 43rd in US; Steadily Increasing, But Among Lowest Rates

Connecticut’s obesity rate has increased dramatically during the past two decades, but the state has among the lowest adult obesity rates in the country, ranking 43rd among the states in an analysis of obesity rates. According to the most recent data, rates of obesity now exceed 35 percent in three states (Arkansas, West Virginia and Mississippi), 22 states have rates above 30 percent, 45 states are above 25 percent, and every state is above 20 percent. Arkansas has the highest adult obesity rate at 35.9 percent, while Colorado has the lowest at 21.3 percent.CT rates

Connecticut now has the ninth lowest adult obesity rate in the nation, according to The State of Obesity: Better Policies for a Healthier America. Connecticut's adult obesity rate is currently 26.3 percent, up from 16.0 percent in 2000 and from 10.4 percent in 1990.

U.S. adult obesity rates remained mostly steady — but high — in 2014, the most recent full year data available, increasing in Kansas, Minnesota, New Mexico, Ohio and Utah and remaining stable in the rest.

The analysis also found that 9.2 percent of adults in the state have diabetes, an obesity-related health issue, ranking 35th in the nation as of 2014. It is the highest rate in the state in the past 25 years. The number of diabetes case is projected to increase from 267,944 in 2010 to 412,641 by 2030, at the current pace of increase.obesity rates

The adult hypertension rate, 31.3 percent, ranks Connecticut 27th among the states.  The number of hypertension cases is projected to increase from 708,945 in 2010 to 941,046 by 2030.  Heart diseases is projected to increase from 214,986 people in 2010 to 1,014,057 in 2030, and obesity-related cancer is projected to more than double in 20 years, from 58,115 in 2010 to 147,883 in 2030.

The state-by-state analysis is a project of the Trust for America’s Health and the Robert Wood Johnson Foundation.

73 Local Health Departments Serve CT's 169 Municipalities

Connecticut has 73 local health departments serving the state’s entire population – individuals residing in the state’s 169 cities and towns. Data compiled by the state Office of Legislative Research breaks down the health departments by full-time and part time, as well as their geographic coverage. Of the 73 local health departments across the state, 53 are full-time departments, while the remaining 20 are part-time. The full-time departments include 33 individual municipal health departments and 20 health district departments (multi-town departments serving from two to 20 towns).numbers

By law in Connecticut, a town may have a part-time health department if: (1) it did not have a full-time department or was not part of a full-time district before January 1, 1998, (2) it has the equivalent of one full-time employee, and (3) the Department of Public Health commissioner annually approves its public health program and budget.

According to the Department of Public Health (DPH), based on the state’s 2013 estimated population, full-time health departments (both municipal and district) serve about 95 percent of the state’s population, while part-time departments serve the remaining 5% percent, OLR reports.

Connecticut’s local public health system is decentralized and a local health department falls under the jurisdiction of its respective municipality or district. Staff are hired and employed by the municipal or district health department.

The law requires towns, cities, and boroughs to nominate a municipal health director, who must be approved by their respective legislative bodies and DPH. The DPH commissioner may remove the director for cause. The town, city, or borough may also take such action with the commissioner’s approval.public health

Municipal and district health departments enforce the state’s public health laws, rules, and regulations, including the Public Health Code. Responsibilities include jurisdiction to:

  • examine and remediate public health hazards, nuisances, and sources of filth;
  • levy fines and penalties for Public Health Code violations;
  • grant and rescind license permits (e.g., for food service establishments or septic systems);
  • establish fees for health department services;
  • submit to DPH reports on reportable diseases from health care providers and clinical laboratories; and
  • provide for sanitation services (district directors may serve as sanitarians as practical).

Full-time municipal and district health departments receive state funding. The legislature eliminated funding for part-time health departments in 2009, according to OLR.


State Residents Express Confidence in Public Schools; CT Ranks 12th in Poll

North Dakota residents (89%) are more likely than those living in any other U.S. state to rate the K-12 education provided in their state as excellent or good, followed closely by those living in Minnesota and Nebraska (82%). Connecticut ranked at number 12 in the nation, for residents’ assessment of their state’s public schools, with 71 percent viewing the caliber of education provided as good or excellent. In stark contrast to the top states, about half as many Nevada and New Mexico residents, 42% in each state, rate their public edCHDIucation systems positively, the lowest percentages in the country, in a new poll released by Gallup.  Joining the two southwest states at the bottom of the list are Hawaii (47%), Louisiana (49%), Arizona (50%), California and Alabama (52%), Mississippi (53%) and  Oregon and Rhode Island (54%).

71State residents were asked “how would you rate the quality of public education provided in grades K-12” on a scale including excellent, good, fair and poor.  The top 10 states after North Dakota, Minnesota and Nebraska are Iowa, New Hampshire and Massachusetts (80%), Wyoming (79%), South Dakota (78%) and Vermont and Virginia (75%).

These results are based on a Gallup poll conducted from March through December 2015, and released this week, with approximately 500 interviews in every state.

Residents in states where a large share of residents rate the quality of education as excellent or good are also more likely to believe their public school system prepares students for success in the workplace, according to Gallup.230px-Gallup_Corporate_logo

When asked “Do you believe your state public school system prepares students for success in the workplace?” North Dakota and Nebraska again topped the list, at 89 percent and 81 percent, respectively.  Connecticut ranked 18th at 68 percent.


Connecticut Ranks 10th in U.S. in Percentage of Latinos Among Eligible Voters

Connecticut, with 10.8 percent of eligible voters of Latino heritage, ranks 10th among the states in the percentage of eligible Latino voters.  In 16 states, more than half of the Latino population is eligible to vote, including Connecticut which ranks 13th with 51.8 percent of the Latino population eligible to vote in the November elections. Those states include Vermont, Maine, Hawaii, New Mexico, Alaska, Montana, North Dakota, West Virginia, Florida, Pennsylvania, New Hampshire, and South Dakota, with percentages ranging from 61.9 percent to 51.9 percent. latino vote

A record 27.3 million Latinos will be eligible to vote in the 2016 elections, which will include legislative and Congressional elections, United States Senator and President/Vice President.  The Hispanic population in Connecticut is the 18th largest in the nation. About 540,000 Hispanics reside in Connecticut, 1 percent of all Hispanics in the United States, according to data compiled by the Pew Hispanic Center.  In other key data:

  • Connecticut’s population is 15 percent Hispanic, the 11th largest Hispanic statewide population share nationally.
  • There are 280,000 Hispanic eligible voters in Connecticut—the 15th largest Hispanic statewide eligible voter population nationally. California ranks first with 6.9 million.
  • Some 11 percent of Connecticut eligible voters are Hispanic, the 10th largest Hispanic statewide eligible voter share nationally. New Mexico ranks first with 40%.
  • Some 52 percent of Hispanics in Connecticut are eligible to vote, ranking Connecticut 13th nationwide in the share of the Hispanic population that is eligible to vote. By contrast, about eight-in-ten (79 percent) of the state’s white population is eligible to vote.

mapThe states with the largest Latino population are California, Texas, Florida, New York, Illinois, Arizona, New Jersey, Colorado, New Mexico, Georgia and North Carolina.  With the smallest Latino populations are two New England states – Maine and Vermont – along with North and South Dakota and West Virginia.  Another New England state, New Hampshire, is among the ten states with the smallest Latino population.

Among Connecticut’s Congressional Districts, the share of eligible voters who are Latino range from 6.4 percent in the 2nd C.D. in Eastern Connecticut, to 12.9 percent in Western Connecticut’s 5th Congressional District.  The percentages in the Connecticut’s other districts are 10.2% in the 3rd C.D. (Greater New Haven), 11.8% in the 4th C.D. (mostly Fairfield County) and 12.8% in the 1st C.D. (Greater Hartford).

All demographic data are based on Pew Research Center tabulations of the U.S. Census Bureau’s 2014 American Community Survey.

Confidence in State Government Plummets in CT; Third Lowest in USA

In 2013, a majority of Connecticut residents expressed confidence in their state government.  Two years later, 6 in 10 residents, when asked if they had confidence in their state’s government, said no.no confidence In a survey of states nationwide, Illinois was at the bottom of the list, with only one in four Illinois residents indicating confidence in their state government, the lowest among the 50 states by a significant margin. Rhode Island (33%) and Connecticut (39%) join Illinois as states with less than 40 percent government confidence, according to data compiled by Gallup. North Dakota residents are the most trusting; 81 percent say they are confident in their state government.

Connecticut is joined among the states where residents expressed the least confidence in their government by New Jersey, Louisiana, Kansas, Pennsylvania, and New York.  Along with residents of North Dakota, people living in Wyoming, Nebraska, Montana, South Dakota, Utah and Minnesota expressed the most confidence in their state government.

In the Gallup survey in Connecticut, 39 percent of residents expressed confidence in state government, while 60 percent said they did not have confidence in state government.  The "no confidence" percentage has increased by 14 percentage points in two years.  The Gallup analysis noted that there is a strong relationship between residents' ratings of their state's economy and their confidence in state government. In addition to Illinois, Rhode Island, Connecticut, New Jersey and Kansas all rank among the states in which residents are the least positive about their state's economy.

The resul230px-Gallup_Corporate_logots are based on Gallup's 50-state poll, conducted March through December 2015. Gallup asked respondents whether they do or do not have confidence in their state's "government in general."

A similar poll by Gallup in 2013 brought very different results for Connecticut.  In that survey, a majority (52%) expressed a great deal or fair amount of confidence in state government.  That year, 46 percent expressed not very much confidence or none at all.

least confidence


Connecticut Among Five States with Highest Percentage of Foster Children in Group Homes, Report Says

The percentage of children in foster care in Connecticut who have not been placed with a foster family is among the highest in the nation, according to a report issued in 2015.  The report, from the Annie E. Casey Foundation, highlights the differing policies and practices among states, stressing that “kids should live with relatives or foster families when they have been removed from their own families, but one in seven nationally lies in a group placement.” In Connecticut there are 4,071 children in foster care, with 74 percent in family placement and 24 percent in non-family placement, exceeding the national average, according to the report.  That compares with 84 percent in family placement and 14 percent in non-family placement, nationally.  Only Colorado (35%), Rhode Island (28%) and West Virginia and Wyoming (27%), had a higher percentage of foster children than Connecticut in a non-family placement. states comparison

The state-by-state data from 2013, the most recent year available, shows use of group placements varies widely by state, ranging from 4 percent to 35 percent of children under the system’s care.  In Oregon, Kansas, Maine and Washington, only 4 to 5 percent of young people in out-of-home care are in group placements, the report points out.

The Foundation’s policy report, Every Kid Needs A Family, highlights “the urgent need to ensure, through sound policies and proven practices, that everything possible is being done to find loving, nurturing and supported families to children in foster care.” The report highlights the promising ways that state and local government leaders as well as policymakers, judges and private providers can work together as they strive to help these 57,000 children who are living in group placements – and overall, the more than 400,000 children in the care of child welfare systems.

The report goes on to recommend how communities can widen the array of services available to help parents and children under stress within their own homes, so that children have a better chance of reuniting with their birth families and retaining bonds important to their development. And it shows ways in which residential treatment — a vital option for the small percentage of young people who cannot safely live in any family during treatment — can help those young people return to families more quickly and prepare them to thrive there.7 to 10 times

“We have an obligation to help all of our kids succeed,” said Patrick McCarthy, president and CEO of the Casey Foundation. “If our children couldn’t live with us, we would want them to live with someone close to us - and if that couldn’t happen, with a caring foster family who could provide them with as normal a life as possible during a turbulent time. This report shows more kids can live safely in families and get the nurturing they need while under the care and protection of our child welfare systems.”

Among the report’s findings across the United States:

  • One in 7 children under the care of child welfare systems live in group placements, even though federal law requires that they live in families whenever possible.
  • Fortaecf-everykidneedsafamily-cover-2015y percent of the children in group placements have no documented behavioral or medical need that would warrant placement in such a restrictive setting.
  • While research shows children who need residential treatment likely need to stay no longer than three to six months, young people are staying in group placements an average of eight months.
  • Group placements cost 7 to 10 times the cost of placing a child with a family.

The report also indicates that African American and Latino youth are more likely than white youth to be placed in group settings, and boys are more likely than girls to be in group placements.  Nationally, African American youth are 18 percent more likely than their white counterparts to be sent to group placements, and boys are 29 percent more likely than girls, according to data cited in the report.

4 in 10


Connecticut is Most Religious State in New England

Connecticut is the most religious state New England, ranked number 38 in the nation, according to a new Gallup poll.  The other New England states are all in the bottom ten, according to the survey, which covered the year 2015. New Hampshire is the least religious state in the nation, with 20 percent of residents considering themselves to be “very religious,” 24 percent “moderately religious” and 55 percent “non-religious.”  Just ahead of New Hampshire at the bottom of the list, are Vermont (22 percent very religious), Maine (26 percent very religious) and Massachusetts (27 percent very religious).  Rhode Island is ranked 43, with 32 percent of residents considering themselves to be very religious.CT religion

Connecticut, the only New England state ranked higher than the bottom ten, broke down this way:  33 percent very religious, 28 percent moderately religious, and 39 percent non-religious.

In the annual survey, Mississippi (63 percent) has extended its eight-year streak as the most religious state, followed closely by neighboring Alabama (57 percent), according to Gallup.  Rounding out the top ten “very religious” states were Utah, Louisiana, Tennessee, Arkansas, Georgia, South Carolina, North Carolina, Kentucky and Texas.

The state-by-state results are based on over 174,000 interviews conducted as part of Gallup Daily tracking in 2015, including more than 480 interviews in every state and more than 1,000 interviews in most states.  In Connecticut 1,919 interviews were conducted, according to Gallup.framed church Lee, MA

Gallup classifies Americans into three religious groups based on their responses to a question measuring religious service attendance and how important religion is in their daily life. Very religious Americans are those who say religion is important to them and who attend services every week or almost every week. Nonreligious Americans are those for whom religion is not important and who seldom or never attend religious services. Moderately religious Americans meet just one of the criteria, either saying religion is important or that they attend services almost every week or more.

Nationwide, the percentage classified as very religious on the basis of their attendance and view on the importance of religion has stayed remarkably stable since the survey began seven years ago. In 2008, 41% of Americans were very religious, 29% moderately religious and 30% nonreligious. In 2015, those same percentages are almost identical: 40%, 29% and 31%, respectively.

religion USA

Firsthand Accounts of Effects of Hunger in Connecticut On Display at State Capitol

Hunger in Connecticut is described as a pervasive problem: one in seven Connecticut residents struggle with hunger; 14.3 percent of Connecticut families do not have adequate resources to purchase enough food; 68 percent of Connecticut food pantry and soup kitchen clients at one point had to choose between food and medical care. Those stark statistics come alive through the firsthand accounts of individuals in Witnesses to Hunger CT, a photovoice exhibit showcasing firsthand accounts of hunger in Connecticut, which has opened in the lower level concourse of the Legislative Office Building in Hartford and will run through Thursday, February 11.stats

“Connecticut is one of the wealthiest states in the nation but there are many who struggle every day to put food on the table,” Lucy Nolan, Executive Director, End Hunger Connecticut!, said. “The Witnesses recruited to participate in this project have been faced with choices that are hard to fathom – whether to eat low cost foods that could be harmful to their medical conditions or not eat at all, whether to pay for prescriptions or put food on the table, and whether to feed themselves or give extra food to their children. We hope this exhibit can serve as a reminder that many among us, often hidden, need the state’s support.”

The 15 Witnesses to Hunger CT come from Connecticut’s cities, suburbs and rural communities. Kimberly’s picture told the story of her teenage son who while grateful to have something to eat wished there was meat on the plate. Randy from Westport had a good job until struck by cancer and now gets many meals from the soup kitchen and pantry. In his photo he holds a grocery bag in his hands and says while he is grateful for that safety net he wishes there were more fresh foods available. The photos tell a story of everyday choices that must be made to survive.

The project is a collaboration of Connecticut nonprofit organizations, anti-hunger and anti-poverty advocates, and state agencies inspired by Witnesses to Hunger, a project of the Center for Hunger Free Communities at the Drexel University Dornsife School of Public Health.  Advocates point out that limited access to food leads to poor health outcomes, including stress, obesity, and inability to succeed in work or school.hunger map

“There are four main themes that emerged from this project and tell me a compelling story,” said State Senator Marilyn Moore, Bridgeport. “The Witnesses to Hunger CT show everyday struggles with health and wellness, food and nutrition, transportation and adequate shelter. If we want people to succeed we need to make sure we support them. I appreciate their bravery in shining a light on these themes.”

Connecticut is the last in the nation for the number of schools with a school breakfast program, according to End Hunger Connecticut! officials. They point out that 64.6 percent of schools participate, and 45 percent students participate in free and reduced price breakfast for every 100 in lunch.  Connecticut would receive an additional $9.6 million federal dollars if the participation rate of school breakfast reached 70 percent.

Connecticut’s SNAP (formerly Food Stamps) participation rate is 72 percent and 53 percent of the eligible working poor participate in the SNAP program. Many go to food pantries instead for food, organization officials said. They indicated that for every $1 spent on WIC funding, Connecticut saves $1.77-$3.13 on future medical costs.

“The members of Witnesses to Hunger are the real experts on hunger and poverty,” said Dr. Mariana Chilton, an associate professor at Drexel University’s Dornsife School of Public Health and founder of Witnesses to Hunger. “Too many decisions today are made without consulting with the people that are affected most by policies made in Washington. We are thrilled to have families from Connecticut join in the national movement of families speaking from first hand experiences to inform policy makers and the public about the true realities of America’s struggles and how to solve them.”

They noted that 11.9 percent of Connecticut residents are food insecure and 4.7 percent are very food insecure — a slight increase from 2008.

“Data shows the food insecurity rate among those living with a severe mental illness is 475 percent higher than those who are not battling mental illness,” said Billy Bromhunger exhibit
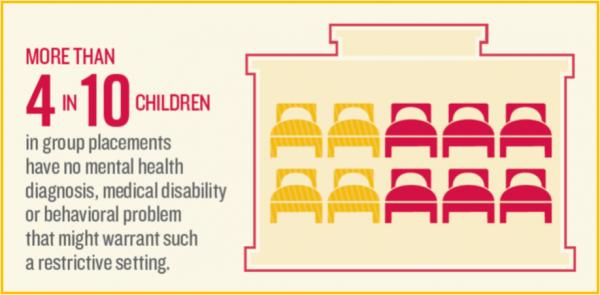
age, MSW, Director of Community Organizing, Yale Program for Recovery and Community Health. “We know that good nutrition plays a key role in mental health and that’s why the mental health community is here today to support the Witnesses.”

Witnesses to Hunger CT is the second exhibit of its kind in the state. The first took place in New Haven in 2014 and was championed by Congresswoman Rosa DeLauro.  Witnesses to Hunger CT is a collaboration of:  Advocacy Unlimited, Connecticut Association for Basic Human Needs (CABHN), Center for Hunger Free Communities at the Drexel University Dornsife School of Public Health, Connecticut State Department of Mental Health and Addiction Services (DMHAS), Connecticut Food Bank, End Hunger Connecticut!, Foodshare, Immanuel Congregational Church/UCC, Hispanic Health Council, New Haven Food Policy Council, and the Yale Program for Recovery and Community Health.

The exhibit will be in the lower concourse of the Legislative Office Building (LOB) through February 11th. A booklet prepared for the exhibit can be found at http://www.endhungerct.org. The LOB is located at 300 Capitol Avenue, Hartford and is open weekdays 8:00 am to 5:00 pm.  Free parking is available (first come first served) at the LOB Garage, which is located directly behind the LOB.

https://youtu.be/e-9M4byq90w