Connecticut Ranks 10th in U.S. in Percentage of Latinos Among Eligible Voters

Connecticut, with 10.8 percent of eligible voters of Latino heritage, ranks 10th among the states in the percentage of eligible Latino voters.  In 16 states, more than half of the Latino population is eligible to vote, including Connecticut which ranks 13th with 51.8 percent of the Latino population eligible to vote in the November elections. Those states include Vermont, Maine, Hawaii, New Mexico, Alaska, Montana, North Dakota, West Virginia, Florida, Pennsylvania, New Hampshire, and South Dakota, with percentages ranging from 61.9 percent to 51.9 percent. latino vote

A record 27.3 million Latinos will be eligible to vote in the 2016 elections, which will include legislative and Congressional elections, United States Senator and President/Vice President.  The Hispanic population in Connecticut is the 18th largest in the nation. About 540,000 Hispanics reside in Connecticut, 1 percent of all Hispanics in the United States, according to data compiled by the Pew Hispanic Center.  In other key data:

  • Connecticut’s population is 15 percent Hispanic, the 11th largest Hispanic statewide population share nationally.
  • There are 280,000 Hispanic eligible voters in Connecticut—the 15th largest Hispanic statewide eligible voter population nationally. California ranks first with 6.9 million.
  • Some 11 percent of Connecticut eligible voters are Hispanic, the 10th largest Hispanic statewide eligible voter share nationally. New Mexico ranks first with 40%.
  • Some 52 percent of Hispanics in Connecticut are eligible to vote, ranking Connecticut 13th nationwide in the share of the Hispanic population that is eligible to vote. By contrast, about eight-in-ten (79 percent) of the state’s white population is eligible to vote.

mapThe states with the largest Latino population are California, Texas, Florida, New York, Illinois, Arizona, New Jersey, Colorado, New Mexico, Georgia and North Carolina.  With the smallest Latino populations are two New England states – Maine and Vermont – along with North and South Dakota and West Virginia.  Another New England state, New Hampshire, is among the ten states with the smallest Latino population.

Among Connecticut’s Congressional Districts, the share of eligible voters who are Latino range from 6.4 percent in the 2nd C.D. in Eastern Connecticut, to 12.9 percent in Western Connecticut’s 5th Congressional District.  The percentages in the Connecticut’s other districts are 10.2% in the 3rd C.D. (Greater New Haven), 11.8% in the 4th C.D. (mostly Fairfield County) and 12.8% in the 1st C.D. (Greater Hartford).

All demographic data are based on Pew Research Center tabulations of the U.S. Census Bureau’s 2014 American Community Survey.

Latino, African-American Arts Organizations Face Steeper Climb to Sustain Success

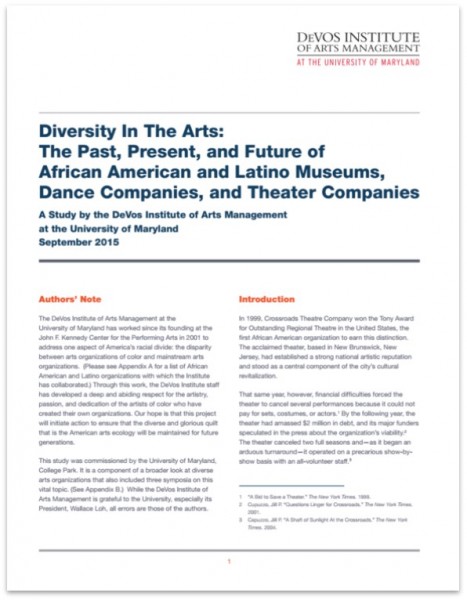
Latino and African-American museums and performing arts organizations struggle to draw philanthropic support compared to other cultural institutions, creating "chronic financial difficulties" that sharply limit what they are able produce, according to a comprehensive new report, Diversity in the Arts. The study by the University of Maryland's DeVos Institute of Arts Management suggests that donors focus their giving on bigger grants for "a smaller cohort [of minority organizations] that can manage themselves effectively, make the best art, and have the biggest impact on their communities." The 51-page report was cited by the Los Angeles Times and reported in The Chronicle of Philanthropy.  The report said that minority-focused arts organizations’ most debilitating weakness has been difficulty in attracting private, individual donors, a demographic whose charitable giving far exceeds the grantmaking of foundations, corporations and government.institute study

“In 2015 a large number of arts organizations of color are struggling, in some cases desperately,” says the report, overseen by Michael Kaiser, the veteran arts administrator and former Kennedy Center for the Performing Arts president who heads the DeVos Institute.  The report also recommended that “serious arts funders must address the need to develop pipelines to bring talented college graduates of color into the arts management field.”

Using 2013 tax returns, DeVos found that the 30 largest black and 30 largest Latino nonprofit arts groups had a median budget of $3.8 million, versus $61.1 million for 20 major general arts institutions. Minority entities reported getting 5 percent of their funding from individual donations, compared to a norm of 60 percent for other groups, the Times reported.

“There is an urgent need for philanthropic leaders to revise funding policies to account for changing demographics and the distinctive characteristics of organizations of color,” the report said.  Funders may need to support “a limited number of organizations,” the report stated, noting that “it might allow the sector to thrive by creating a group of strong, effective organizations of color that can serve as role models and training grounds for others.”

“The small staffs at many organizations of color are already stretched to the limit delivering their services and oftentimes struggle with reporting requirements set by institutional donors…A shift toward general operating support allows organizations to direct resources to where they are most needed while promoting sustainable capacity growth.”

The “Diversity in the Arts” report contains another potentially controversial finding: When large, mainstream arts organizations put on black- or Latino-themed performances or exhibitions, they siphon away artistic talent, donations and attendance from black and Latino companies, the Los Angeles Times reported. Kaiser called the study "a wake-up call" for arts funders.

lookingA survey to which 29 of the 60 black and Latino arts groups in the study replied showed that the median percentage of donations coming from individuals was 5%. The norm is about 60% for big mainstream arts organizations.  “This is the most important single statistic in the study,” the report says.  Minority arts organizations also trailed when it came to box office receipts and other earned revenue. Earned money accounted for 40% of their revenue, compared with 59% for the big mainstream groups.

To develop its financial profile, the DeVos Institute used tax returns for what it ranked as the 30 largest African American and 30 largest Latino nonprofit arts groups nationwide, by budget, in the fields of theater, dance and museums. The institute compared them with 20 of the biggest general companies in those fields.museum

The study concludes by suggesting that “people look at the challenges of arts organizations of color in a new way.  And we hope that leaders of every community will feel moved to work together to ensure that the arts of every segment of our varied society are allowed to thrive.”

The DeVos Institute of Arts Management provides training, consultation and implementation support for arts managers and their boards.  It has been associated with the University of Maryland since 2014 but has its origins in the early 1960’s, and has served more than 1,000 organizations in 80 countries.


Local Election Officials Less Responsive If They Think You’re Latino, Study Finds

The answers vary, depending who is believed to be asking.  In an academic study, researchers have found that individuals thought to be Latino by local election officials receive less responsive and accurate answers to basic questions seeking information about voting.  It is described as the first large-scale field experiment investigating bureaucratic behavior that provides “causal evidence of discrimination on the basis of ethnicity or race by election officials.” The authors, Ariel R. White, Noah L. Nathan and Julie K. Faller, Ph.D. candidates at Harvard University, have published the results of their 2012 study, “What Do I Need to Vote? Bureaucratic Discretion and Discrimination by Local Election Officials,” in the February 2015 issues of American Political Science Review.  The graduate students contacted more than 7,000 elections officials in 48 states (Maine and Alaska were not included) – and asked two questions via email of the people who are responsible for both implementing voter-ID laws in many states and providing election-related information to voters.study

“We find that officials provide different information to potential voters of different putative ethnicities,” the authors explained.  “Emails sent from Latino aliases are significantly less likely to receive any response from local election officials than non-Latino white aliases and receive responses of lower quality. This raises concerns about the effect of voter ID laws on access to the franchise and about bias in the provision of services by local bureaucrats more generally.”

The field study, in which fundamental voting-related questions were emailed to election officials, was designed to “isolate the effect of ethnicity on real-world performance” of election officials.  It indicates that the officials are less likely to respond to informational inquiries from individuals thought to be Latino.  Emails from Latino names are roughly five percentage points less likely to receive a reply to a question about voter ID requirements than those from non-Latino whites, the Boston Globe reported.

The experiment was designed to determine if “street-level bureaucrats discriminate in the services they provide to constituents.”  The results provide “strong evidence” that they do.  The study concluded that “the responses that Latino emailers received to voter ID questions were less likely to be accurate and were more likely to be non-informative.”  The results “suggest that bias from street-level bureaucrats can occur even when there are not clear strategic reasons for officials to discriminate on the basis of ethnicity.”amerian political science review

The study, just prior to the 2012 election, also indicated that “we find no evidence that whether local officials are elected or appointed, partisan or nonpartisan, or members of specific political parties influences the extent of bias.”

Significantly, given recent court decisions that have rolled back oversight of elections in certain jurisdictions around the country, the study authors indicate that “consistent with the claim that enhanced monitoring reduces discrimination, we find no evidence of bias against Latinos in jurisdictions subject to federal regulation under the Voting Rights Act.”

“These findings have important implications for debates about voter ID laws, and indeed for any changes to voting requirements or election administration,” the authors emphasize in the study’s conclusion.  “Our results indicate that changes to existing voting regulations are likely to differentially increase information costs for Latino voters because public officials are less responsive to their requests for information.”

The 14-page study report also suggests that:

  • There is “some evidence that officials respond at lower rates to Latinos, even when asked a question”
  • “Public officials can be biased even in exceptionally low cost interactions” such as when only a single word answer (“No”) is necessary
  • “If minority voters are less able to acquire information about ID requirements and more likely to be asked for ID at the polls, this could manifest in lower voting rates. This may be greatest where officials are not monitored to prevent discrimination.”

The researchers suggest that future research could “expand the use of experimental methods to examine the presence of bias in service delivery in many other aspects of local administration in the United States” – from” trash collection and snow plowing to the management of welfare offices.”  They raise the question as to whether “similar ethnic or racial biases may affect the quality of services delivered in these other arenas.”

emails


Latino Vote Increasing Battleground in Connecticut, Nation

If you wondered why the Governor of Puerto Rico and the former Governor of Puerto Rico both visited Connecticut in the waning days of the gubernatorial campaign to support the Democratic and Republican candidates, respectively, the numbers tell the story. Connecticut’s population is 14 percent Hispanic, the 11th largest Hispanic statewide population share nationally, according to data from the U.S. Census Bureau and the Pew Research Hispanic Trends Project.  There are 265,000 Hispanic eligible voters in Connecticut—the 16th largest Hispanic statewide eligible voter population nationally.

Hispanic eligible voters in Connecticut have a much different Hispanic origin profile than Hispanic eligible voters nationwide, the research indicates.  In Connecticut, 5 percent of Hispanic eligible voters are of Mexican origin, two-thirds (67 percent) are of Puerto Rican origin, and 28 percent claim other Hispanic origin. Among all Hispanic eligible voters nationwide, 59 percent are Mexican, 14 percent are Puerto Rican, and 27 percent are of some other Hispanic origin.PewHispanicResearchCenter-300x240Latino vote

One-in-ten Connecticut eligible voters are Hispanic, the 10th largest Hispanic statewide eligible voter share nationally. (New Mexico ranks first with 40 percent.) Just over half of the Hispanics in Connecticut (52 percent) are eligible to vote, ranking Connecticut 12th nationwide in the share of the Hispanic population that is eligible to vote. By contrast, more than three-quarters (78 percent) of the state’s white population is eligible to vote.

national exit poll taken last Tuesday in conjunction with NBC News, shows that Latinos made up an estimated 8 percent of voters this year.  Specific data on Connecticut was not available.   Nationwide, the share of Hispanics who voted remained unchanged from their estimated share in 2010 and 2006 despite the growing share of eligible voters (U.S. citizens ages 18 or older). This year, 11 percent of all eligible voters were Hispanic, up from 10.1 percent in 2010 and 8.6 percent in 2006.electorate

In several states where exit polling data for Hispanic voters is available, according to Pew Research, Democrats generally won the Hispanic vote in Senate and gubernatorial races. But in some states, Republicans did well among Hispanics, securing as much as 40 percent or more of the vote. In congressional races nationally, Democrats won the Latino vote by a margin of 62 percent to 36 percent.

In Florida, Republican Gov. Rick Scott won re-election with 38 percent of the Latino vote, a significant drop from the 50 percent he won in 2010.  In other gubernatorial races, including Texas and Georgia, the Democratic candidate won the Latino vote but lost the election.  In California, Gov. Jerry Brown was re-elected, winning won 73 percent of the Latino vote according to exit polls, up from 64 percent four years ago.


Tale of Two Lists: Influential Leaders in Greater Hartford

‘Tis the season of making a list and checking it twice. Which will probably be the strategy employed by Hartford magazine next year, after enduring considerable criticism for omitting Latinos from their list and feature article on the “50 Most Influential” individuals in the Greater Hartford region - a prominent, lengthy and well-photographed December edition cover story.

Now, Latinos United for Professional Advancement (LUPA) has issued its list of the 50 most Influential Latinos in the region – a list not only impressive for who’s included, but for the numerous talented and highly placed Latinos who didn’t make the list, an indication of the growing breadth of leadership in the region by individuals of Hispanic heritage.  It is the first such list to be issued by the relatively new organization, aimed at bringing together and advancing the Latino professional community.

At least Hartford magazine will have a place to start when they consider candidates for next year’s cover story.

Yes, such lists are incredibly subjective.  But as LUPA points out, their list “was developed to demonstrate the significant roles Latinos play in the capital region and the influence they have on many facets” of life in the region and the state.  “The Latino population in Hartford is more than 45 percent, according to the U.S. Census Bureau, and in Connecticut the total population growth from 2000-2010 was 168,532 with Latinos comprising 158,764 of that population growth.”

See the LUPA list and the Hartford magazine list.  All good and worthy people, who are making significant contributions to the region.   That's 100 names, no overlap.

Concerns raised by ctlatinonews and others regarding the Hartford magazine list will, one would expect, result next year in other names “making their first appearance, new faces on the Greater Hartford scene that we expect to see more of in years to come,” to quote, in a slightly different context, the Hartford magazine list preamble.