"The State of Black Hartford," published more than two decades after a landmark sociological text originally published in 1994, squarely focuses on education as the overriding issue on which Hartford’s future, and Connecticut’s, will be determined, flatly stating that “the future of Hartford rests with how we educate our children so they can contribute to the state and survive as productive citizens.”
“The mis-education of children is a human rights struggle. Children of color are our children and the thousands that are failing can no longer be tolerated. We have a moral, ethical and economic responsibility to educate children in Hartford. Hartford’s future is our children and they deserve an opportunit to compete and survive,” the new report’s conclusion states.
The report, published in recent weeks and unveiled at a public session in Hartford, points out that “the city remains challenged with high unemployment rates, uneven public education, missed opportunities in economic development, and a work force that is not adequately prepared to achieve sustainable living wages. There are new forms of discrimination where children graduate from high school without a real education to support themselves.”
Observing that “education in Hartford has been a priority for many years,” the report goes on to suggest what should happen next. “Leaders with great intentions have tried, but it is time to require and invite the involvement and participation from parents and families as partners in their children’s education. There is no other way to address the needs of children. Our society has made it very clear it will not take care of them.”
The 220 page report, made possible through a $36,000 grant from the Hartford Foundation for Public Giving, was written by volunteers from a diverse group of disciplines, including educators, social workers and ministers. It was published by the Urban League of Greater Hartford, Inc. Stanley F. Battle, director of the University of St. Joseph's master's of social work program was Editor; Ashley L. Golden-Battle was content editor.
The State of Black Hartford 2016 addresses challenges that African Americans face at both the national and local level through a series of briefs and chapters. The chapter authors “pay close attention to how Blacks are perceived by the public” and “incorporate barriers to education, economic stability, health and welfare.” Metrics and case studies are used "to better understand Black Hartford." Chapter authors include Peter Rosa, Amos Smith, U.S. Sen. Chris Murphy, Maris Dillman, Rodney L. Powell, Yan Searcy, Kimberly Hardy, Yvonne Patterson, Eunice Matthews, Clyde Santana, Trevor Johnson, and Rev. Shelley Best.
Noting that Hartford holds the “distinction of being both the capital for one of the wealthiest states in the country and being one of the poorest cities in country,” among the key observations highlighted in the report:
- “We need family stability, livable wages, economic development, and education to fully bridge the achievement gap.”
- “Hartford is a great place to work—the Greater Hartford community is aware of this fact. It is important to make sure that Hartford residents receive some of those benefits.”
- “Economic growth and business development are the foundation for Hartford’s survival. With downtown development and the presence of universities, it is time to develop new business incubators in the arts, home repair, healthcare, biotechnology, and business.”
- “In Hartford, 37 percent of the population is Black yet they make up only 10 percent of the population throughout the rest of Connecticut and 12 percent of the population in the United States (DHHS, 2012). The population of Hartford is younger than other Connecticut and U.S. cities with over 70 percent of the residents being under 45 years old (DHHS, 2012).”
- “The lifeblood of Hartford depends on education, business, employment, economic status and mortality, housing and food.”
Issues including criminal justice, housing, healthcare, child welfare are also discussed in depth in the report. Case studies, anecdotal evidence and data are highlighted throughout the report. The central role of faith, and religious institutions is also the focus of the report, in the context that “presently Black Churches are still striving to meet increasing demands with decreasing resources.” 
That uphill effort is reflected in the report indicating that “the Black Church cannot continue to operate as an independent agent with sparse budgets drawn from the meager donations of an already struggling congregation. Clergy and congregations need to build coalitions with other churches…” The importance is underscored as the report stresses that “active involvement of faith leaders as community leaders in the ongoing struggle for social, political, and economic justice is no less necessary now than it has ever been.”
The report bluntly states that “…if we do not educate children from urban school districts, the future of this state will be at serious risk. The achievement gap continues to expand with little improvement. It is true that there has been some improvement in graduation rates. However, many graduating seniors from urban school districts must endure remedial work if they decide to attend a two or four-year institution.”
Education is viewed as essential to solving a range of persistent challenges facing the city’s African-American community and city residents: “The challenges that confront Hartford include the overarching issue of poverty. While some efforts to address economic development, crime, and financial stability have been discussed in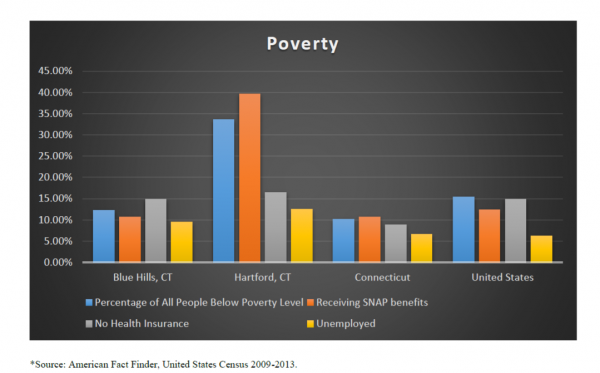 this book, education is the ultimate determinate of success. In order for Hartford to excel, the population must be educated. The emerging majority must be able to support itself and children require cutting edge educational opportunities.”
Among the data points:
- One half of high school graduates need help when they start a community college or a state university. Sixty-three percent of Hartford high school graduates require a remedial coursework.
- Slightly less than one third of Black males and slightly more than one third of Latino males to begin college education at public institutions of higher education complete their education within six years.
The report notes that “Frequently, urban youth can’t afford to attend community colleges, so how will they be able to earn a four- year degree? Hartford has the right idea to focus on education and economic development. Children need their parents, grandparents, aunts, uncles and the community to be successful.”
The report also calls for crime and homicide rates to be addressed at the community level. “There are families who have lived in Hartford for over 30 years and all of their children graduated from the Hartford Public school system. Their children are successful. How did they do it and why don’t we ask them?”
Economic development, the report explains, is another pivotal area that requires attention that differs from past efforts: “Blacks must become a major part of the growth strategy of these neighborhoods. The promise will only work if there is a diverse group of investors with Black investors in these zones. Black people must become owners in the city in greater numbers.”
Dr. Stanley F. Battle, educator, author and civic activist is currently Director/Professor of the MSW Program in the Department of Social Work and Latino Community Practice at the University of Saint Joseph. Previously, Dr. Battle was the Interim President at Southern Connecticut State University, Chancellor at North Carolina Agricultural and Technical State University (NCA&T) and President of Coppin State University in Baltimore.
The mission of the Urban League of Greater Hartford is “To reduce economic disparities in our communities through programs, services and educational opportunities.”


 The Cuban Lyceum of Bridgeport -- Liceo Cubano de Bridgeport- celebrated its 60th year in 2014, the Connecticut Post


 uded in the College Scorecard among bachelor’s degree granting institutions are Lincoln College of New England ($31,800); Mitchell College ($30,400); and Goodwin College ($27,500).
 The College Scorecard, recently updated by the federal agency, is designed “to ensure that students and families have the most up-to-date, comprehensive, and reliable information available on colleges, all in an easy-to-understand format.” The website allows visitors to sort and filter search results to compare schools to assist students in deciding “which college makes the most sense when considering the typical costs, average student loan amount, students’ ability to repay their loans, and their future earnings,” the website materials explain.


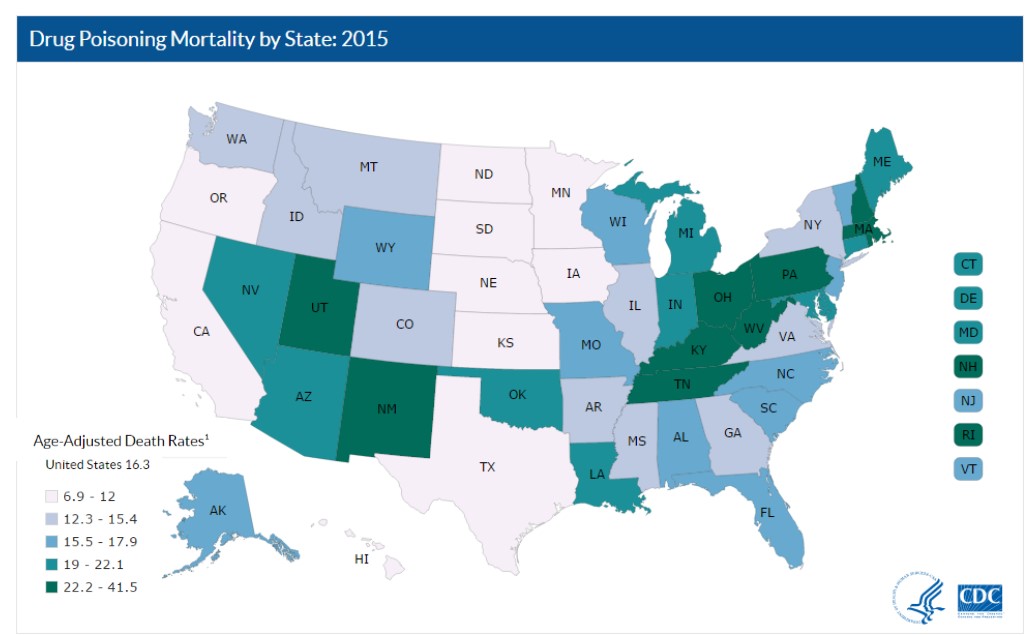 The five states with the highest rates of death due to drug overdose were West Virginia (41.5 per 100,000), New Hampshire (34.3 per 100,000), Kentucky (29.9 per 100,000), Ohio (29.9 per 100,000), and Rhode Island (28.2 per 100,000).


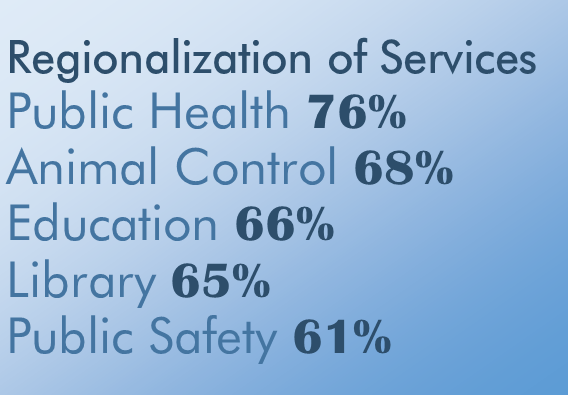 “Increasingly, towns will not be able to afford to sustain the level of services to which they have become accustomed, as budget pressures increase along with a reluctance to raise taxes. Residents showed concern, and a willingness to consider regionalism as a partial solution,” said Robert W. Santy, who serves as Board Chair of Inform CT and is President & CEO of the Connecticut Economic Resource Center (CERC) Inc.


