Disparities Evident As Fairfield County Considers Its Community Wellbeing

Fairfield County’s sizeable immigrant population - twenty percent of Connecticut’s most populous county - grew 89 percent from 1990 to 2014. In some municipalities, foreign-born residents make up as much as a third of the population. That is among the findings in the Fairfield County Community Wellbeing Index 2016, which examined regional demographics, economic opportunity, education, health, quality of life, and happiness.  The report includes analysis of the communities, populations, and neighborhoods of Fairfield County, as well as opportunities available and issues facing the area.

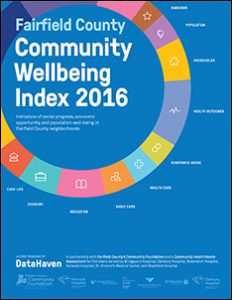
Since 1980, the size of the population living in neighborhoods that are considered most affluent – defined as those with an average family income more than 2.5 times higher than the state level - has tripled within Fairfield County. Meanwhile, the number of people living in poor neighborhoods is 3.5 times its 1980 size. The number of people in middle-income neighborhoods has decreased by sixteen percent.

Fairfield County’s Community Foundation, a major funder of the report, partnered with DataHaven, area hospitals, and government agencies to help launch a more robust and comprehensive resource that could serve as a part of the hospitals’ and health departments’ Community Health Needs Assessments as well as a broader county-wide indicators program.

“Fairfield County’s Community Foundation is committed to addressing the most pressing issues facing Fairfield County, but to do that we first need to be able to identify and understand those issues,” stated Nancy M. von Euler, Vice President, Programs, Fairfield County’s Community Foundation. “The data in the Fairfield County Community Wellbeing Index 2016 will help us to develop priorities for collective action to build a stronger, healthier Fairfield County where everyone has the opportunity to thrive, regardless of their zip code.”

The report states that "Despite its overall affluence, Fairfield County is among the nation’s most unequal metropolitan areas. Inequities in well-being appear when evidence is stratified by income, age, race, gender, and zip code. These differences are often most apparent after considering data that were collected specifically for the age groups and neighborhoods that are most impacted."

Among the findings, between 2014 and 2025, adults ages 65 and over are Fairfield County’s only age group projected to grow significantly, with a thirty-seven percent increase. Disparities in the County were also evident:

  • High and rising childcare costs are often prohibitively expensive for low and middle-income families. While Fairfield County has nearly enough spaces for all 3- to 4-year-olds to attend preschool, there are only enough regulated childcare slots for fifteen percent of the county’s children ages 0 to 2, and enough subsidized slots to cover only twenty-two percent of these youngest children in low-income households.
  • The issue of dental care arose as an indicator of well-being, particularly among younger adults and families. The Index shows that for every 10,000 residents living in Fairfield County, 12 residents visit an emergency room to receive treatment for preventable dental conditions in any given year, whereas on the East Side of Bridgeport, 178 residents do.
  • Fairfield County residents are healthy when compared to national benchmarks. However, many conditions and risk factors—such as asthma, food insecurity, exposure to community violence, and the early onset of diabetes—are disproportionately prevalent in lower-income neighborhoods and communities of color. Sections of Bridgeport in particular fall very far behind the surrounding area in many of these measures.
  • Disparities in access to reliable transportation persist between racial and income groups. A majority of Fairfield County workers, regardless of income, commute to another town for work. Many low-income (annual wages under $40,000) workers leave Bridgeport for work, while large shares of high-income workers commute to New York City.

“The process of developing this report allowed local partners and community members to identify links between the well-being of residents and the places where they live. Looking beyond typical measures like income levels or unemployment rates, the Community Wellbeing Index reveals a much more uneven distribution of opportunities in areas such as neighborhood walkability, economic development, public health, and education,” said Mark Abraham, Executive Director of DataHaven and a lead author of the report. “The impact that these barriers to opportunity have on overall well-being and happiness will serve as a call to action for many groups working to improve Fairfield County’s diverse neighborhoods and towns.”

The Fairfield County Community Wellbeing Index 2016 was based on a variety of federal and statewide data sources. Partners of DataHaven’s Fairfield County Community Wellbeing Index 2016 include Fairfield County’s Community Foundation; Bridgeport Hospital; Danbury Hospital; Greenwich Hospital; Norwalk Hospital; St. Vincent’s Medical Center; and Stamford Hospital.

Bridgeport, Stamford, New Haven, Hartford, New Britain Among Most Culturally Diverse Cities in USA

Five Connecticut cities are among the nation’s most culturally diverse, according to a new analysis.  Bridgeport is the 15th most culturally diverse city in the U.S., according to the analysis by the financial website WalletHub, which also ranked Stamford at number 22.   New Haven, Hartford and New Britain were back-to-back-to-back, ranking  at number 30, 31 and 32 on the list of more than 500 cities across the country. Bridgeport’s cultural diversity score was 86.34, and the city ranked 28th in ethno-racial diversity, 17th in linguistic diversity and at number 150 in birthplace diversity.  Stamford’s cultural diversity score was 84.29, and the city ranked 63th in ethno-racial diversity, 20th in linguistic diversity and at number 103 in birthplace diversity.

New Haven’s scores and rankings were similar, with a 83.02 cultural diversity score, and ranking at number 76 in linguistic diversity and number 132 in birthplace diversity.  New Haven was the only Connecticut city to rank in the top 10 in any category, finishing ranked at number 10 in ethno-racial diversity.

When the analysis broke metropolitan areas down by size, among medium sized cities Bridgeport, Stamford, New Haven and Hartford all ranked in the top 15 most culturally diverse.  Waterbury ranked at number 19.  Among small cities, New Britain ranked 8th, Danbury 10th, Norwalk 15th and West Hartford 76th.  Large cities in the analysis were those with more than 300,000 people; midsize cities with 100,000 to 300,000 people, and small cities with fewer than 100,000 people.

The most culturally diverse city in the U.S. is Jersey City, New Jersey, with a score of 95.88.  New York City ranked sixth; Providence was at number 12.

“The country as a whole is becoming increasingly ethnically diverse, and living in an ethically diverse city today is good exposure to the opportunities and challenges all cities will be facing sooner or later,” said Mario Luis Small, Grafstein Family Professor of Sociology at Harvard University.  “Ethnic diversity in neighborhoods is associated with a strong preponderance of businesses and local organizations that generate economic activity and sustain community.  Children exposed to ethnic and language diversity early on, develop a broader and more sophisticated understanding of the diversity of the world.”

In determining the cultural diversity scores, the three categories were weighted, with racial and ethnic diversity making up 50 percent of the score, language diversity 33 percent and U.S. region of birth diversity consisting of 17 percent of the score.  The regions were in-state, Northeast, Midwest, South, West, U.S. territories, and foreign-born.

CT’s Cuban-American Population Is Centered in Bridgeport, As Immigration to U.S. From Cuba Grows

The number of Cubans entering the U.S. has picked up dramatically since former President Barack Obama announced a renewal of ties with the island nation in late 2014, a Pew Research Center analysis of government data shows. The U.S. has since opened an embassy in Havana, a move supported by a large majority of Americans, and public support is growing for ending the trade embargo with Cuba, according to Pew surveys. Outside of Florida, the New York metropolitan area – including Connecticut - is home to the most Cuban Americans.  More than 10,600 Cuban-Americans call Connecticut home, according to U.S. Census 2014 data. The city with the largest Cuban population is Bridgeport, with more than 1,000 residents of Cuban heritage, according to published reports.

According to the website ZipAlas, the Connecticut communities with the largest percentage of Cuban residents among local their residents include Bridgeport, Hartford, Stratford, Westport, New Britain, Bolton, Stamford, Weston, New Haven, and West Hartford.

Overall, 56,406 Cubans entered the U.S. via ports of entry in fiscal year 2016, up 31 percent from fiscal 2015 when 43,159 Cubans entered the same way, according to the U.S. Customs and Border Protection data reported by Pew. Fiscal 2015 saw an even larger surge, as Cuban entries jumped 78 percent over 2014, when 24,278 Cubans entered the U.S.

There are 2 million Hispanics of Cuban ancestry living in the U.S. today, the fourth largest Hispanic origin group behind Mexicans, Puerto Ricans and Salvadorans. But population growth for this group is now being driven by Cuban Americans born in the U.S. The share of foreign born among Cubans in the U.S. declined from 68 percent in 2000 to 57 percent as of 2015, Pew reported. The Cuban population in the United States has steadily grown, accelerating from 737,000 in 1990 to 1,144,000 in 2013, according to the Migration Policy Institute.

According to the 2014 American Community Survey (ACS), 923,111 foreign-born Hispanics of Cuban origin lived in Florida, 47,016 in New Jersey, 30,398 in Texas, 28,436 in California, and 24,898 in New York, the Center for Immigration Studies reported.

The Cuban Lyceum of Bridgeport -- Liceo Cubano de Bridgeport- celebrated its 60th year in 2014, the Connecticut Post reported.  Founded in 1954 on the East Side of Bridgeport, the organization continues as the longest running Hispanic social club in all of New England, according to local leaders. The Lyceum was officially incorporated on July 21, 1954, created to “promote unity, understanding and friendship among all Cuban and others Spanish-speaking people,” and “provide a welcomed place for newly relocated Cubans in the United States,” to continue the traditions of Cuban culture.

Bridgeport Police Chief A.J. Perez was born in Cuba migrated with his family as a youngster to the United States in 1968, according to published reports.  He joined the Bridgeport Police Department in 1983 and became Chief of Police last year, the first Cuban-American police chief in the state’s history.


Percentage of Unbanked, Underbanked Households Continues to Climb in CT, Now Exceeds 1 in 5 Households

One in five Connecticut households is unbanked or underbanked, according to data compiled by the Federal Deposit Insurance Corporation, and the percentage of residents unbanked – those that do not have an account at an insured institution - has climbed in the state over the past six years. The percentage of Connecticut households considered unbanked has risen steadily, from 5.3 percent in 2009 to 6.2 percent in 2015, the most recent year for which data is available.  Connecticut ranked 21st in the nation in the percentage of unbanked households. 

Overall, the percentage of state households thatare either unbanked or underbanked increased slightly, from 20 percent to 21 percent between 2013 and 2015.  Those considered unbanked had a checking or savings account but also obtained financial products and services outside of the banking system.

Connecticut’s percentage of unbanked and underbanked individuals is better than the national average, which is 26.9 percent.  Nationally, 68 percent are considered to be fully banked, with an account or accounts at an insured institution, compared with 73.3 percent in Connecticut.

To assess the inclusiveness of the nation’s banking system, and in partial fulfillment of a statutory responsibility, the FDIC conducts biennial surveys of households to estimate the proportion of households that do not fully participate in the banking system.  The survey provides estimates of the proportion of U.S. households that do not have an account at an insured institution, and the proportion that have an account but obtained (nonbank) alternative financial services in the past 12 months.

Estimates from the 2015 survey indicate that 7.0 percent of households in the United States were unbanked in 2015. This proportion represents approximately 9.0 million households. An additional 19.9 percent of U.S. households (24.5 million) were underbanked,

The 2015 FDIC National Survey of Unbanked and Underbanked Households presents new data and insights on the size of unbanked and underbanked markets at the national, regional, state, and large metropolitan statistical area (MSA) levels. This is the fourth installment of the report.

In the Hartford-East Hartford-West Hartford metropolitan statistical area, a slightly higher percentage of households are unbanked or underbanked – 25.6 percent.  In the New Haven-Milford MSA, that percentage is slightly lower than statewide, at 19.5 percent.  The Bridgeport-Stamford-Norwalk MSA is lower still, at 18 percent.

CT’s Local Government Workforce Shrinks 7.4% in Past Decade; 10th Largest Reduction in US from Employment Peak

Connecticut’s local municipal workforce has been shrinking for the past decade, and had been reduced 7.4 percent by 2015 when compared with the peak employment year of 2005, according to a new analysis by Governing magazine.  The drop in local government employment is the 10th largest in the country by percentage of workforce, when peak employment levels were compared with 2015 numbers. “Going on nearly a decade since the start of the recession, localities in many parts of the country have since restored public payrolls to prior levels. But some still employ far fewer workers than they did before the downturn,” Governing reported.

Governing compared each state's pre-2010 peak aggregate totals to the latest 2015 data, excluding the education sector.  In all, the magazine reported, local governments in 26 states had yet to see payroll expenditures return to prior levels when adjusted for inflation. Similarly, local public employment remains below previous highs in most states and is down 3.5 percent nationally from 2008.

The steepest declines in local government payrolls, when 2015 data was compared with the peak pre-recession year, came in Delaware (-20.5% from 2007), Michigan (-18.2% from 2003), Arizona (-17.1% from 2008), Rhode Island (-16.5% from 2003), Massachusetts (-14.4% from 2008), Nevada (-14.1% from 2009), Florida (-11.0% from 2008), Indiana (-8.8% from 2008), New Jersey (-8.3% from 2009) and Connecticut (-7.4% from 2005).

Where localities chose to make payroll cuts has varied, according to the analysis, but a number of patterns were pointed out, based on Census data.  When national employment estimates were compared with 2008 levels, non-sworn police employees sustained the single largest reduction of any major category of workers, the analysis indicated. Governing suggested the reductions were likely a result of police departments trimming civilian staff to maintain the size of police forces on the streets. Nationally, the number of police and firefighters were down 2.6 percent from 2008 while all other areas of local government, excluding education and hospitals, experienced a larger 4.5 percent decline.

At the opposite end of the spectrum, North Dakota, South Dakota, Wyoming, Montana and New Mexico recorded the biggest increases in noneducation payrolls since the recession began in 2008-2009.  Half the states showed an increase in local government payrolls, and despite the generally slow recovery across many regions of the country, U.S. local government payroll spending overall showed a slight three  percent nationwide uptick between 2014 and 2015, according to the analysis.

Median Income for Students Who Attended College in CT Exceeds National Average

Median student earnings among those who attended college in Connecticut and received federal financial aid is between $27,500 and $74,200 ten years after enrollment, with most institutions students’ well above the national average, according to data included in the U.S. Department of Education’s (USDOE) College Scorecard. The earnings data is compiled 10 years after the students enrolled, as part of the College Scorecard that appears on the USDOE website. CT by the Numbers reviewed the data for schools that offer a four-year bachelor’s degree, a view that includes nearly two dozen colleges located in Connecticut.

Nationally, the median earnings for students is $33,400.

Connecticut’s top ten:  Yale University ($74,200); Fairfield University ($68,500); St. Vincent’s College ($61,800); Quinnipiac University ($57,700); Trinity College ($54,700); University of Connecticut ($54,000); Sacred Heart University ($53,900); Albertus Magnus ($52,100); Connecticut College ($51,700); and University of Saint Joseph ($49,500).

The next ten include Wesleyan University ($48,400), University of New Haven ($48,300); University of Hartford ($46,100); Central Connecticut State University ($44,300); Eastern Connecticut State University ($43,400); Western Connecticut State University ($43,400); University of Bridgeport ($42,700); Southern Connecticut State University ($40,700); Charter Oak State College ($39,200) and Post University ($38,600).  Also included in the College Scorecard among bachelor’s degree granting institutions are Lincoln College of New England ($31,800); Mitchell College ($30,400); and Goodwin College ($27,500).

According to the university’s website, 51 percent of Yale students receive need-based financial aid from the University. At Fairfield University, 46 percent of full-time undergraduates receive some kind of need-based financial aid, at Quinnipiac University it is 61 percent, according to U.S. News. Approximately 40 percent of Trinity College students receive need-based financial assistance from the institution; more than 80 percent of UConn students receive some form of financial assistance, with 33 percent of UConn's fall incoming freshmen class receiving a merit-based scholarship, the university website points out.

The College Scorecard, recently updated by the federal agency, is designed “to ensure that students and families have the most up-to-date, comprehensive, and reliable information available on colleges, all in an easy-to-understand format.” The website allows visitors to sort and filter search results to compare schools to assist students in deciding “which college makes the most sense when considering the typical costs, average student loan amount, students’ ability to repay their loans, and their future earnings,” the website materials explain.

The site notes that “experts say that by 2020, two-thirds of all jobs will require a postsecondary education; and college graduates are likely to earn a lot more and experience lower unemployment than those with only a high school diploma.”

CT Playing Catch-up to Other States in Reducing Childhood Obesity

Although Connecticut has fared comparatively well to other states in adult obesity rates, the state does “not do as well for children, especially low-income children,” according to two new national reports, the Child Health and Development Institute (CHDI) of Connecticut indicates in the organization’s latest issue brief. “Preventing children from being overweight or obese requires action in the earliest years since experts agree that reversing these trends later in life can be very difficult,” CHDI points out. “It is currently estimated that one in four children are overweight or obese by the time they enter kindergarten.

The reports highlight how Connecticut is doing relative to other states on early childhood obesity prevention. Data for low-income children was drawn from families participating in the federal Special Supplemental Nutrition Program for Women, Infants, and Children (WIC).

The Trust for America’s Health and Robert Wood Johnson Foundation’s State of Obesity in America report shows that Connecticut ranks:

  • 12th out of 50 states for highest WIC obesity rates (low-income children ages 2-4 years old)
  • 27th out of 37 states for highest adolescent obesity rates (students grades 9-12) Mississippi high schoolers have the highest obesity rate in US: 18.9%. Montana the lowest: 10.3% Connecticut is 12.3%
  • 42nd out of 50 states for highest adult obesity rates (18 and older)

A new report from the Centers for Disease Control (CDC), Early Care and Education State Indicator Report, tracks state policies aimed at preventing obesity in child care settings and shows that Connecticut is missing opportunities to address healthy nutrition in early childhood and education settings (ECE).

The 2016 report examines 15 data indicators including, assessing each state’s licensing regulations for high impact obesity prevention standards. Connecticut only had 2 out of 47 obesity prevention standards in State licensing regulations for early care and education programs and lacked ECE professional development training on obesity prevention that 42 other states offer.

CHDI explains that since 2014, Connecticut state agencies have started to address early childhood nutrition through licensing and training. The State is currently in the process of reviewing Early Childhood Education (ECE) licensing regulations, and has developed general training for some early childhood providers on nutrition and fitness.

Additionally, the Department of Public Health offers training to ECE providers via funding through the Centers for Disease Control and is working with the Connecticut State Department of Education (SDE), Office of Early Childhood (OEC), and the UConn Rudd Center for Food Policy and Obesity to enhance professional development training focused on obesity prevention.

“Despite this progress,” the CHDI stresses, “more needs to be done to catch up with other states and reduce obesity rates among young children.” CHDI adds that “Connecticut must look at best practice standards related to early childhood obesity prevention and do better for our children to ensure that they grow at a healthy weight.”

Connecticut now has the 10th lowest adult obesity rate in the nation, according to The State of Obesity: Better Policies for a Healthier America released September 2016. Connecticut's adult obesity rate is currently 25.3 percent, up from 16.0 percent in 2000 and from 10.4 percent in 1990.

CT’s Mortality Rate from Drug Poisoning is 11th Highest in US; Was 6th Lowest A Decade Ago

Connecticut’s mortality rate from firearms is less than half the national average, the state’s homicide rate is slightly above half the national average, but the rate of drug poisoning deaths exceeds the national average. Data from the Centers for Disease Control and Prevention (CDC) indicate that Connecticut’s mortality rate from drug poisoning was 17.6 per 100,000 population, with 623 deaths in the state in 2014, the 19th highest rate in the nation.  The U.S. rate that year was 14.7, with 47,055 fatalities.  Last year, Connecticut’s mortality rate from drug poisoning climbed to 22.1, which was the 11th highest rate in the nation, with 800 deaths. 

The states with the highest drug poisoning mortality rates in the nation in 2015 were West Virginia, New Hampshire, Kentucky, Ohio, Rhode Island, Pennsylvania, Massachusetts, New Mexico, Utah, Tennessee and Connecticut.  The lowest rates were in Nebraska, South Dakota, North Dakota, Texas and Iowa.

The CDC reported this month that opioids—prescription and illicit—are the main driver of drug overdose deaths. Opioids were involved in 33,091 deaths in 2015, and opioid overdoses have quadrupled since 1999.

In 2015, according to the CDC, significant increases in drug overdose death rates from 2014 to 2015 were primarily seen in the Northeast and South Census Regions. States with statistically significant increases in drug overdose death rates from 2014 to 2015 included Connecticut, Florida, Illinois, Kentucky, Louisiana, Maine, Maryland, Massachusetts, Michigan, New Hampshire, New Jersey, New York, North Carolina, Ohio, Pennsylvania, Rhode Island, Tennessee, Washington, and West Virginia.

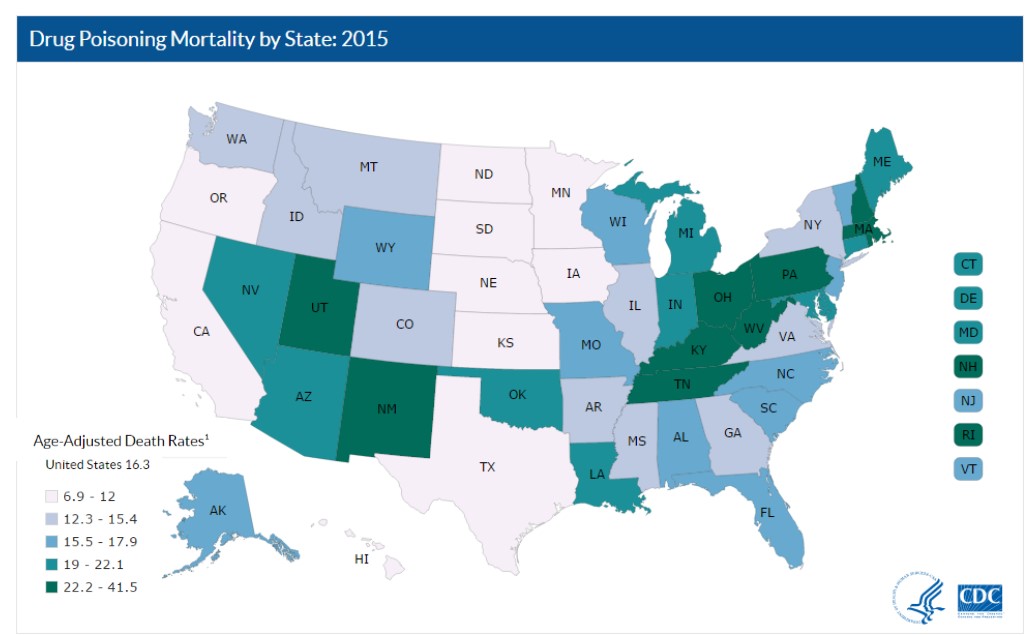
The five states with the highest rates of death due to drug overdose were West Virginia (41.5 per 100,000), New Hampshire (34.3 per 100,000), Kentucky (29.9 per 100,000), Ohio (29.9 per 100,000), and Rhode Island (28.2 per 100,000).

The increase in drug overdose deaths in Connecticut from 2014 to 2015 was 25.2 percent, the fourth highest in the nation among states that had a statistically significant increase.  Only Massachusetts, New Hampshire and Maine had larger increases.

Among the 28 states meeting inclusion criteria for state-level analyses, 16 (57.1%) experienced increases in death rates involving synthetic opioids other than methadone, and 11 (39.3%) experienced increases in heroin death rates from 2014 to 2015, the CDC reported.

The largest absolute rate change in deaths from synthetic opioids other than methadone occurred in Massachusetts, New Hampshire, Ohio, Rhode Island and West Virginia. The largest percentage increases in rates occurred in New York (135.7%), Connecticut (125.9%) and Illinois (120%).

Connecticut, Massachusetts, Ohio, and West Virginia experienced the largest absolute rate changes in heroin deaths, while the largest percentage increases in rates occurred in South Carolina (57.1%), North Carolina (46.4%), and Tennessee (43.5).

Connecticut announced a detailed opiate response initiative this fall.  The Connecticut Opioid REsponse Initiative (CORE) is a strategic plan from Yale experts in response to the state’s opioid and overdose epidemics. It recommends: 1) expanding access to effective, medication-based treatment for substance use disorders; 2) improving transitions within the treatment domain; 3) increasing the availability of naloxone — the antidote to reverse an opioid overdose — and; 4) decreasing the over-prescribing of opioid at high doses or in combination with sedatives.

The CDC said “there is an urgent need for a multifaceted, collaborative public health and law enforcement approach to the opioid epidemic;” the Drug Enforcement Administration referred to prescription drugs, heroin, and fentanyl as the most significant drug-related threats to the United States, the CDC reported.


Connecticut Opioid REsponse Initiative (CORE) news conference, 10/6/16

https://youtu.be/fqw-AXvsL_8

Northeast Sees Relatively Strong International Migration Amidst Overall Weak Population Growth

New data from the U.S. Census indicates that population growth and domestic migration patterns have continued to move away from the East and the Midwest to the South and West, at accelerated rates, the website newgeography is reporting. Equally important, according to the site, pre-Great Recession interstate mobility rates have been restored.  The Census population estimates for the nation, states and the District of Columbia indicate a population increase for the South of 7.7 million between 2010 and 2016. The West gained 4.7 million. By contrast, the Midwest grew 1.1 million, while the East, including Connecticut, was even lower, at 900,000.

Combined, the South and West accounted for 87 percent of the national growth, the website’s analysis of the Census data indicated. In 2011, the South and West captured 82 percent of the national growth. By 2016, the South and West had risen to 94 percent of the national population increase. The South, alone had 57 percent of the growth, up from 52 percent in 2011. The West also had a strong gain, from 31 percent in 2011 to 36 percent in 2016.  The growth leaders:

  • Texas has led the nation in total population growth. Total population growth includes the natural change (births minus deaths), international migration and net domestic migration. Texas added 2.7 million residents, a 10.8 percent increase compared to its 2010 population. This is more than double the national rate of 4.7 percent.
  • California was well behind, with a gain of 2.0 million, despite having started the decade with a 50 percent higher population. California’s growth rate was 5.3 percent.
  • Florida added the third largest number of new residents, at 1.8 million, for a 9.6 percent growth rate from 2010.

Three states suffered population losses over the period. Illinois lost 30,000 residents and West Virginia lost 20,000. Vermont lost 1,000 and was joined by New England neighbors Maine, New Hampshire, Connecticut and Rhode Island in the bottom 10, with slim increases in overall population.

International migration was a bright spot for the Northeast, which along with the South were the two leading regions, followed by the West and Midwest.

The East and Midwest had a near monopoly on the bottom 10 in net domestic migration. New York lost 867,000 net domestic migrants, while Illinois lost 540,000. California’s loss was 383,000. New Jersey lost 336,000 and Michigan 216,000. Connecticut, Pennsylvania, and Ohio lost between 100,000 and 200,000, while Maryland and Massachusetts lost between 70,000 and 100,000.

In 2016, there were 825,000 interstate moves, according to the data outlined by newgeography, which is more than double the post-2000 low of 411,000 in 2011. The 2016 moves exceeded the 2001 to 2009 average by more than 10 percent

CT Residents See Regionalism as Viable Option for Local Services; Highway Improvement A Transportation Priority

Connecticut residents believe that some services traditionally handled by individual municipalities  can be effectively delivered regionally.  A new statewide survey found that public health earns the most support for a regional approach and public safety the least.  More than 3 in 4 people (76%) say that public health services can be provided on a regional basis, followed by animal control (68 percent) and education (66 percent).  The survey found that 65 percent of state residents believe that library services can be delivered regionally, and 61 percent share that view regarding public safety services. The survey for InformCT, a public-private partnership that provides independent, non-partisan research, analysis, and public outreach, was administered by researchers from the Connecticut Economic Resource Center, Inc. (CERC) and Smith & Company.  The analysis is based on the responses of survey of 510 state residents, with a margin of error of 5 percent. logl

Survey respondents were asked about regionalization of services in surveys conducted in the first three quarters this year, and support was generally consistent – respondent’s views of regionalizing the various services did not vary more than four percentage points for any of the policy areas during that time.  Favorability of regionalization of public health services has increased each quarter, while regionalizing education has increased from Quarter 1.  While support for regional public safety services has also increased from Quarter 1, it received the least support among the services queried in each survey.  Only regionalizing libraries has seen a decline from the first quarter, and preferences for regionalizing animal control has held steady.

stats
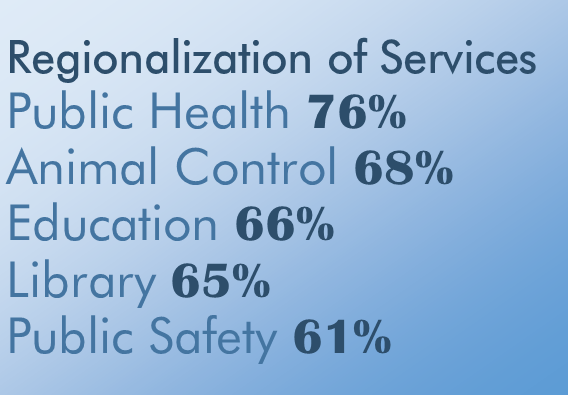
“Increasingly, towns will not be able to afford to sustain the level of services to which they have become accustomed, as budget pressures increase along with a reluctance to raise taxes. Residents showed concern, and a willingness to consider regionalism as a partial solution,” said Robert W. Santy, who serves as Board Chair of Inform CT and is President & CEO of the Connecticut Economic Resource Center (CERC) Inc.

The  also found that the most important factor when choosing a town in which to live, is property taxes, followed by the quality of the school system.  Those factors earned 53 percent and 51 percent of respondents, respectively, who describe the factor as “very important” - the only aspects  described as very important factor by a majority. Other factors deemed very important include recent appreciation of home values (30 percent), proximity to transportation and employment (29 percent) and proximity to entertainment ad amenities (24 percent).

The survey  also asked about transportation in Connecticut, finding that 74 percent said they use their car almost every day.  Other modes of transportation were not nearly as popular.   More than 80 percent indicated that they had used a local bus (86%), long distance bus (91%), commuter rail (87%), Amtrak (92%), an airplane (92%) or a bicycle (82%) only once, or not at all, in the past month.  Regarding state spending to improve transportation, respondents ranked highway improvements as the highest priority by a wide margin, with commuter rail, local bus, and bicycle lanes/pedestrian walkways, ranked next highest.  Highway improvements was described as the highest priority by more respondents than the other six options combined.