CT Has 10th Lowest Obesity Rate in the Nation, Research Finds

Connecticut has a lower adult obesity rate than most other states, according to new national data, which found that 26.9 percent of adults living in Connecticut have obesity, ranking the state 42nd among the 50 states and the District of Columbia.  The state has slipped slightly from four years ago - the obesity rate was 25 percent and ranking was 9th lowest in the nation in the 2014 edition of the annual survey. The state's top 10 least obsese status was in the new report came in the 15th annual State of Obesity: Better Policies for a Healthier America report  by Trust for America’s Health (TFAH) and the Robert Wood Johnson Foundation (RWJF).  Findings include:

  • Adult obesity rates vary considerably from state to state, with a high of 38.1 percent in West Virginia and a low of 22.6 percent in Colorado. No state had a statistically significant improvement in its obesity rate over the past year.
  • Adult obesity rates are at or above 35 percent in seven states; for the first time in Iowa and Oklahoma, and at least the second time in Alabama, Arkansas, Louisiana, Mississippi, and West Virginia.
  • Six states — Iowa, Massachusetts, Ohio, Oklahoma, Rhode Island, and South Carolina — saw their adult obesity rates increase significantly between 2016 and 2017.
  • Adult obesity rates are between 30 and 35 percent in 22 states and 19 states have adult obesity rates between 25 and 30 percent.
  • Over the past five years (2012 – 2017), 31 states had statistically significant increases in their obesity rate and no state had a statistically significant decrease in its obesity rate.
  • There continue to be striking racial and ethnic disparities in obesity rates. In 31 states, the adult obesity rate among Blacks is at or above 35 percent.  Latino adults have obesity at a rate at or above 35 percent in eight states.  White adults have obesity rates at or above 35 percent in one state. Nationally, the adult obesity rates for Latinos, Blacks and Whites are 47.0 percent, 46.8 percent and 37.9 percent respectively.

The least obese states are Colorado (22.6 %),District of Columbia (23.0%),  Hawaii (23.8 %), California (25.1%), Tie Montana and Utah (25.3%), New York (25.7%), Massachusetts (25.9%), Nevada (26.7%) and Connecticut (26.9%).

“Obesity is a complex and often intractable problem and America’s obesity epidemic continues to have serious health and cost consequences for individuals, their families and our nation,” said John Auerbach, president and CEO of Trust for America’s Health. “The good news is that there is growing evidence that certain prevention programs can reverse these trends.  But we won’t see meaningful declines in state and national obesity rates until they are implemented throughout the nation and receive sustained support.”

Obesity is a problem in virtually every city and town, and every income and social sector.  But its impact is most serious in communities where conditions make access to healthy foods and regular physical activity more difficult, such as lower income and rural areas, including many communities of color.  The national costs of obesity are enormous, officials point out.  Obesity drives an estimated $149 billion annually in directly related healthcare spending, and an additional $66 billion annually in lowered economic productivity. Also, one in three young adults is ineligible for military service, due to being overweight, officials noted.

The report offers 40 recommendations for federal, state and local policymakers; the restaurant and food industries; and the healthcare system.  Among them:

  • Medicare should encourage eligible beneficiaries to enroll in obesity counseling as a covered benefit, and, evaluate its use and effectiveness. Health plans, medical schools, continuing medical education, and public health departments should raise awareness about the need and availability of these services.
  • Food and beverage companies should eliminate children’s exposure to advertising and marketing of unhealthy products.
  • Hospitals should no longer sell or serve sugary drinks on their campuses; they should also improve the nutritional quality of meals and promote breastfeeding.

DataHaven to Launch Innovation Awards to Recognize Data-based Initiatives in CT

In conjunction with its 25th anniversary celebration this year, New Haven-based DataHaven has announced plan to launch the DataHaven Innovation Awards, which will be open to nominees from throughout the state. Winners will be selected in a number of education and community impact categories. Nomination will be accepted through October 1, and the award recipients will be announced at DataHaven’s 25th Anniversary Celebration on November 19, 2018. DataHaven is a non-profit organization with a history of public service to Greater New Haven and Connecticut. The organization’s mission is to improve quality of life by collecting, sharing, and interpreting public data for effective decision making.

“We are proud to highlight the creativity and ingenuity of those who employ data to make Connecticut a better place,” explained DataHaven Executive Director Mark Abraham. The awards will recognize organizations, groups and individuals who have demonstrated the ability to use data to improve the well-being of Connecticut communities.

The inaugural Data in Education Awards will recognize the outstanding use of data for projects developed within a classroom or educational setting. Nominations will be accepted in two categories, University and Graduate Level and K-12 Level.  Nominees can include teachers, students, school-based organizations, and non-profits working with youth.

The Data for Community Impact Awards will recognize the outstanding use of data to make a positive difference in one or more Connecticut communities. Nominations will be accepted in two categories: Large Organization, with more than 20 employees, and Small Organization, with less than 20 employees.  Nominees can include nonprofits, for-profits, funders, unincorporated groups, and municipal/state agencies.

Liberty Bank Foundation is underwriting the DataHaven Innovation Awards.

DataHaven maintains extensive economic, social, and health data, including information collected through the DataHaven Community Wellbeing Surveys in 2012 and 2015. DataHaven is a formal partner of the National Neighborhood Indicators Partnership of the Urban Institute in Washington, DC.

“We believe that data is a powerful force, uniting our state and helping make life better in Connecticut communities,” says Abraham. “Our statewide survey provides neighborhood-level data in key areas such as health, education, civic engagement and economic opportunity, so that programs and resources can be deployed to change lives for the better. Our goal is still to make life better for our neighbors.”

Presenting sponsors for the organization’s 25th anniversary year are the City of New Haven, Yale University, Yale New Haven Health and The Community Foundation for Greater New Haven.  Nomination forms for the DataHaven Innovation Awards can be found at http://www.ctdatahaven.org/anniversary and are due by October 1, 2018.

Report: Medicaid's Impact Goes Beyond Health Care to Economy

Medicaid is, at its core, a health insurance program that provides coverage to low-income Connecticut residents.  A new report in Connecticut finds that the program also plays a key role in the state’s economy, budget, and ability to weather economic challenges. The report was developed for, and released by, the Connecticut Health Foundation. In Connecticut, Medicaid is known as HUSKY and covers approximately one in five state residents – close to 800,000 people. HUSKY covers more than one third of Connecticut children, nearly 47 percent of non-elderly adults with disabilities, 15 percent of seniors, and 70 percent of nursing home residents.

The report, developed by the Georgetown University Center for Children and Families, finds that the program is deeply woven into Connecticut’s health care system and plays a major role in a sector of the economy that has been central to job growth in the state. Health care makes up nearly 15 percent of the state’s gross domestic product. Medicaid finances about 20 percent of health care expenditures in Connecticut.

“It is important for policymakers to understand the full impact of Medicaid in the state, particularly as they face difficult budget decisions,” said the report’s author, Edwin Park, research professor at the Georgetown University Center for Children and Families. “Medicaid plays a key role in the state’s economy and is linked to long-term positive outcomes for children like better health, obtaining a college degree, and higher earnings.”

Among the report’s other key findings:

  • Research has linked Medicaid coverage of children and pregnant women to long-term health and economic benefits when children reach adulthood: better health outcomes, greater educational attainment such as completing high school and obtaining a college degree, and higher employment and earnings.
  • Medicaid can help states cope with recessions and economic downturns because it automatically increases federal funding in response to higher state costs, such as those resulting from enrollment increases as people lose their jobs and health insurance.
  • Medicaid contributes the majority of the federal funding spent through Connecticut’s state budget – 58 percent in the 2016 fiscal year. The federal government pays more than half of the state’s Medicaid costs. For every $10 spent on Medicaid in Connecticut, approximately $5.92 comes from the federal government.

“Connecticut invests significant resources in HUSKY and the findings of this report underscore the impact of this investment,” said Patricia Baker, president and CEO of the Connecticut Health Foundation.

The report also indicted that “research has found that Medicaid eligibility during childhood is tied to higher wages and cumulative higher tax payments made as young adults. It also increases employment and reduces the need for public assistance, especially assistance needed due to disability. According to the report, in 2016 Medicaid covered:

  • 4 percent of the nearly 400,000 hospital discharges and 12.9 percent of hospital payments.
  • 63 percent of the 373,200 patients who received care at community health centers.

The Connecticut Health Foundation is the state’s largest independent health philanthropy dedicated to improving health outcomes for people of color. Since its creation in 1999, the foundation has awarded more than $62 million to nonprofit organizations and public entities to expand health equity, reduce health disparities, expand health coverage, and improve the health of all Connecticut residents.

Legal Challenge Seeks to End Prison Gerrymandering in CT

In 2010, New York State enacted legislation to ensure that incarcerated persons are be counted as residents of their home communities when state and local legislative districts are redrawn in New York, in an initiative designed to end what has come to be called “prison gerrymandering.” Connecticut has repeatedly considered legislation during the past decade – in 2011, 2013, 2015 and 2016 - that would make the same policy change, but that legislation has failed to pass.  A 2013 report by the Prison Policy initiative and Common Cause found that almost half of the state's prison population comes from the state's five largest cities, but almost two-thirds of the state’s prison cells are located in just five small towns - Cheshire, East Lyme, Enfield, Somers, and Suffield.

Because prisons are disproportionately built in rural areas but most incarcerated people call urban areas home, counting prisoners where they are incarcerated rather than in their home municipality results in a “systematic transfer of population and political clout” from urban to rural areas, according to the Prison Policy Initiative.

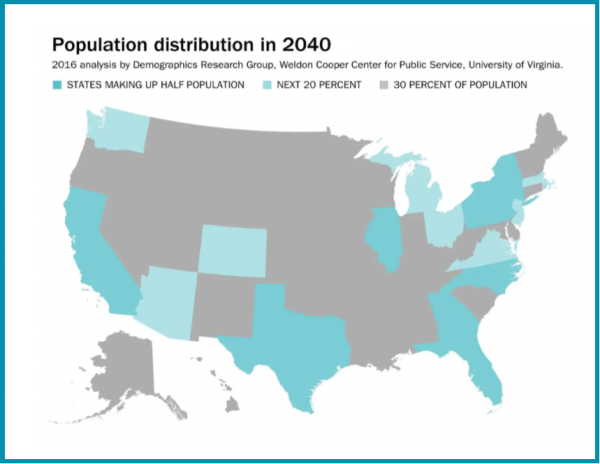
That shift of political influence has ramification across the electoral system, and was the impetus for a lawsuit filed this summer against the state of Connecticut by the NAACP to force an end to the practice.  It is the first of its kind, and being widely watched.

The NAACP points out that Connecticut, like many states, disenfranchises prisoners and has concentrated its prisons primarily in rural areas. The effect is that white, rural voters in the districts where prisons are located have their electoral power unconstitutionally inflated, at the expense of voters of color in other, over-crowded districts.

The plaintiffs seek to compel the State of Connecticut to adopt a new redistricting map that counts incarcerated individuals in their home state legislative districts rather than in the districts where they are being incarcerated, thereby safeguarding the Fourteenth Amendment principle of “one person, one vote.”

Although a number of states continue to engage in this practice, the NAACP explains, Connecticut has some of the worst discrepancies in population numbers between its prison districts and most populated districts.

According to the complaint filed in U.S. District Court, when prisoners are reallocated to their home districts, the population of the 59th House District, which includes Enfield and East Windsor, where three state prisons are located, has an overall population that is more than 15% smaller than the most populated district in the state. The effect is that the vote of a person in that prison district counts for 15% more than each vote of a person in the largest district.

“This is about making sure everyone gets an equal voice,” said Germano Kimbro, a formerly incarcerated individual and plaintiff in the case. A resident of the 97th House District, located in New Haven, one of the most overcrowded state legislative districts in Connecticut, Kimbro argues “My vote shouldn’t count less than someone else’s just because they live near a state prison.”

The NAACP, together with the NAACP Connecticut State Conference and individual NAACP members who live in five of the most overcrowded Connecticut state legislative districts, filed the suit.  The plaintiffs in the lawsuit are represented by the Rule of Law Clinic at Yale Law School and the NAACP.

“Each person’s vote is to be equal to that of their fellow citizens,” explains Alden Pinkham, a student in Yale Law School’s Rule of Law Clinic. “Using prisoners to inflate the population of the districts where prisons are located violates this principle.”

Seven states (Colorado, Mississippi, New Jersey, Virginia, Maryland, Michigan, and New York) encourage or even require local governments to exclude prison populations during redistricting.  The next legal filings in the case are due just after Labor Day.  A conclusion is not anticipated prior to the 2018 November elections, but with an eye toward 2020.

CT’s K-12 Enrollment Drops, Demographic Diversity Grows

Between the 2007-08 school year and the just completed 2017-18 school year in Connecticut, total K-12 student enrollment across the state dropped by nearly 40,000 students, reflected a gradual year-over-year decline in every year of the decade. According to state Department of Education data, enrollment in 2007-08 was 574,848, which slid down to 535,025 this past year, a decline of 39,823 students, or just under 7 percent.

The demographic characteristics of Connecticut’s students has changed substantially.  During the past ten years, the percentage of White students has dropped from 65 percent of those enrolled to 53 percent, while the percentage of Hispanic students has grown from 17 percent in 2007-08 to nearly 25 percent (24.85%) during the school year that ended last month. The percentage of Black students has nudged upward, from 13 to 14 percent.

There were 286,506 White students, 132,940 Hispanic students and 68,697 Black or African American Students during the 2017-18 school year.  That compares with 373,818 White students, 96,127 Hispanic students and 80,234 Black students.  In the past decade, the number of Black students has increased by about 11,000 while the number of Hispanic students has grown by more than triple that - about 36,000.

There were 79,256 students who had qualified for Special Education status last year, up from 68,750 in 2007-08.

Seven percent of students, a total of 38,368, qualified for English Learner status, compared with about 5 percent, or 30,088 students, during the 2007-08 academic year.

Looking ahead, there were 36,239 students in Kindergarten in Connecticut public schools last year.  In 2007-08, there were 39,944.

CT Headed for Population Also-Ran Status by 2040; Eight States Will Be Home to Nearly Half of Us

In 2040, it is anticipated that eight states will have just under half of the total population of the country, 49.5 percent, according to the Weldon Cooper Center for Public Service of the University of Virginia, which analyzed U.S. Census Bureau population projections.  Connecticut is not one of them. A report published in the Washington Post also indicated that the next eight most populous states will account for an additional fifth of the population, up to 69.2 percent — meaning that the 16 most populous states will be home to about 70 percent of Americans.

Geographically, the Post reports, most of those 16 states will be on or near the East Coast. Only three — Arizona, Texas and Colorado — will be west of the Mississippi and not on the West Coast.

The eight states expected to dominate the population numbers, with nearly half the nation’s residents, are California, Illinois, Pennsylvania, New York, Texas, North Carolina, Georgia and Florida.  The next eight, which will include 20 percent of the population, are Arizona, Colorado, New Jersey, Ohio, Virginia, Massachusetts, Michigan and Washington.

Connecticut is one of 34 states in which the remaining 30 percent of the nation’s population will reside.

The projections by the Weldon Cooper Center for Connecticut’s population are: 3,606,144 in 2020; 3,634,820 in 2030; 3,585,765 in 2040.

In previous populaton analysis, the Center has noted that the U.S. population is expected to reach 383 million by 2040, but the rate of growth is projected to slow down from nearly 10 percent over the 2000-2010 decade to 6 percent between 2030-2040. Similar trends are also expected from most states.

The geographic distribution of the nation’s overall growing population also reflects geographic shifts. Back in 2000, six of the top ten largest states belonged to the North. By 2040, five of the top ten are expected to be in the South. The slowing down of the northern states growth, along with rapid population growth in the south and west, means that over time the country will become more Southern and Western, the Center indicates. 

The fastest growth is projected to take place in Washington D.C., Texas, Colorado, Utah, and Florida. As noted above, the Connecticut population is expected to drop between 2030 and 2040.  Also expected to see population declines in that decade are Illinois, Maine, Michigan, Mississippi, New Hampshire, Ohio, Pennsylvania, Rhode Island, Vermont and West Viginia.


Will CT Legislature Reverse Representation Trend in "Year of the Woman"?

The number of women in the Connecticut legislature has dropped with each legislative election throughout this decade, dropping the state from 8th to 21st in the nation in the percentage of women in the legislature. 
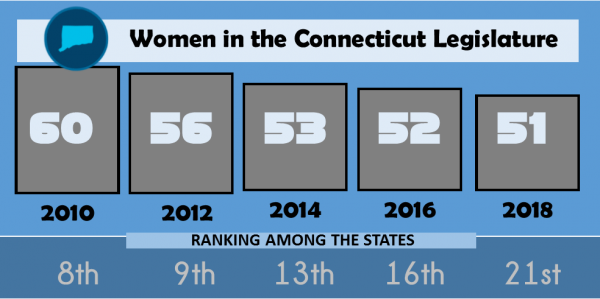
The 2018 election year has been widely declared the year of the woman in politics, a reaction to the MeToo movement and related issues that have risen to the top of many political agendas.  It appears that Connecticut ballots may have a record number of women candidates in November, depending upon the outcome of the August 14 primaries in some legislative districts.

If it turns out that a record number of women are elected to the state’s 187 General Assembly seats (36 in the Senate, 151 in the House) in November, it would reverse a trend a decade in the making.

This year, the state legislature saw 42 women serving in the House (21 Democrats and 21 Republicans) and 9 women in the Senate (7 Democrats and 2 Republicans).  The total of 51 seats held by women, 27.3 percent of the 187 seats, placed Connecticut as one of 19 states between 25 and 34 percent.

Leading the nation were Arizona (40%), Vermont (40%), Nevada (38.1%), Colorado (38%), Washington (37.4%), and Illinois (35.6%).   Women make up 25.4 percent of all state legislators nationwide.

In 2010, there were 60 women in the Connecticut legislature, 52 in the House and 8 in the Senate.  Connecticut ranked 8th among state legislatures in the percentage of women, at 32.1 percent.

Connecticut’s place among the states continued to drop through the decade, from 8th in 2010 to 9th in 2012, 13th in 2014, 16th in 2016 and 21st in 2018.

K-12 School District Regionalization May Do More Harm Than Good, Analysis Reveals

“Generalizations about regionalization oversimplify a complex topic,” according to a new report on K-12 School District Regionalization in Greater Hartford, which warns that “K-12 regionalization can actually increase costs and harm educational outcomes.” As some school districts in Connecticut have been considering regionalizing their K-12 education services as a way to reduce costs, the 23-page report prepared for the Hartford Foundation for Public Giving raises some red flags, noting that “policies that call for wholesale regionalization based on imposed criteria (e.g., minimum/maximum number of students) can have unpredictable, and often adverse, consequences.”

In an effort to get a clearer understanding of the potential educational and community impacts of school and district regionalization, the Hartford Foundation for Public Giving sponsored the comprehensive analysis to help inform those efforts gathering data on what is known about the effects of K-12 regionalization on education expenditures and educational achievement, based on recent empirical studies.

“The Hartford Foundation is committed to the availability of high-quality, impartial research,” said Scott Gaul, the Hartford Foundation’s Director of Research and Evaluation. “As policymakers continue to consider strategies to reduce the costs of government, the issue of regionalizing services continues to draw attention. This research is intended to provide a clearer picture on the potential benefits and challenges of regionalizing school districts in an effort to support a shared understanding and to support informed decision-making.”

K-12 regionalization generally includes combining school districts, boards of education, and central office staff. This can result in closing schools, eliminating teaching positions, reducing administrative staff, and increasing student-to-teacher ratios, among other consequences, according to the report.  Connecticut, like other New England states, relies mainly on municipalities to provide government services, including K-12 education, to its residents.  In 2017, there were 196 public school districts including town districts, charter school districts, regional districts, and regional education service center districts.

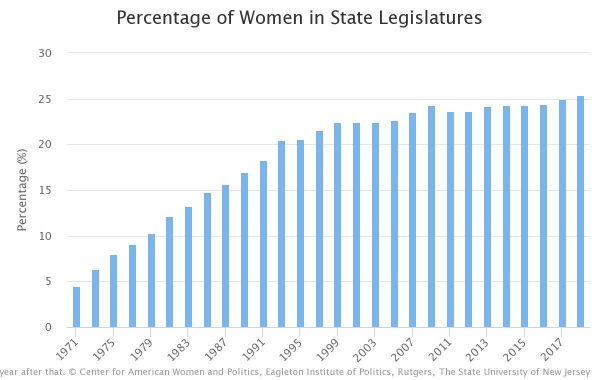
The review of the research, conducted by Connecticut-based Rodriguez Data Solutions, points out that policymakers often promote K-12 regionalization as a way to achieve cost savings, but often fail to consider the consequences for student educational achievement. The report reviewed initiatives to promote K-12 regionalization in several states including Connecticut, Maine, New York and Vermont.  Among the findings:

  • While there is no definitive answer on optimum school size, research on Connecticut suggests that a district with 2,500 to 3,000 students may be both cost-effective and foster educational achievement. This roughly matches the range suggested in research from other locations. In at-risk communities, research suggests that elementary school enrollment should not exceed 300 students, and high school enrollment should not exceed 500.
  • In rural communities, closing a town’s school can cause the social fabric of a community to unravel. Research also suggests that “impoverished regions often benefit from smaller schools and districts and they can suffer irreversible damage if consolidation occurs.”
  • The literature review suggests that deconsolidation of large school districts be considered as an option for cost savings.  In Connecticut, it is estimated that the total savings from the 129 smallest school districts would match the combined equivalent per-pupil savings from the three largest school districts.  Consequently, a significant reduction in statewide education costs requires reducing per-pupil spending in urban areas, not just in small rural districts.

Researchers found that “regionalization may lead to diseconomies of scale resulting from: higher transportation expenses because of longer bus routes, overall increases (leveling up) in staff salaries because of seniority and/or contract renegotiation, and increases in the number of mid-level administrators and administrative support staff.”

Warning of the perils of large, consolidated schools, the report also included the finding that “Students who are involved in extracurricular activities (e.g., band, sports, clubs) have higher graduation rates and it is widely accepted that participation in extracurricular activities decreases as enrollment increases.”

The report also provides a cautionary tale regarding demographics and the impact of school closing decisions:  “While it seems apparent that the closing of school buildings will reduce costs, savings are limited because there may not be buyers, and the facilities still must be maintained by the school district. In already struggling neighborhoods, these now empty school buildings (with boarded windows)

contribute to a downward economic spiral by attracting scavenging, dumping, drug users, and graffiti. The neighborhood children who previously attended the now closed school are then exposed to an increase in crime resulting from the blighted property.”

“Connecticut’s Black and Hispanic children,” the report adds, “are already disproportionately overexposed to crime in their neighborhoods.”

In addition, the report explains, “Students from advantaged (i.e., high socioeconomic status) households have similar educational achievement in both small and large schools. However, the situation is much different for students from low-income communities for whom “… smaller [school] size mediates the association between

socioeconomic status and achievement.” The potential for high educational achievement diminishes for at-risk students when they attend large schools that are disconnected from their communities.”

The report also included an update on the state’s student population.  From 2010-2011 to 2016-2017, the state’s public school enrollment dropped by 25,606 students – a decline in enrollment of 4.5 percent. The analysis found that “most Connecticut school districts have declining enrollments and it is more prevalent in rural areas.”

The report also cited a survey of Vermont voters, who expressed preferences for saving money and maintaining local control of local schools. “Vermont voters had not grasped that saving money may inherently include loss of local control,” the report indicated, concluding that “Vermont voters had conflicting goals, which could also be expected from Connecticut voters.”

Report: Connecticut's Medicaid Expansion Increased Coverage, Access to Preventive Care and Behavioral Health Treatment

A recently issued report found that emergency department visits are down; coverage seen as critical in fight against opioids has expanded, and preventative care and mental health care have become more prevalent – all resulting from a 2010 policy decision made by Connecticut’s elected officials to expand Medicaid coverage. That decision, made collaboratively by a Republican Governor (M. Jodi Rell) and Democratic-controlled legislature – helped to reduce Connecticut’s uninsured rate from 9.1 percent in 2010 to 4.9 percent in 2016 and created a significant source of coverage for preventive health services and behavioral health care, according to the report developed by the Connecticut Health Foundation.

The report examines the impact of HUSKY D, as the Medicaid expansion is known, and highlights a number of key findings:

  • Most people covered by HUSKY D are using their insurance to get care. Just over 80 percent of people with HUSKY D used the coverage for preventive or outpatient health services in 2016.
  • Emergency department usage among HUSKY D members is down significantly. The rate of emergency department visits fell by 36 percent from 2012 to 2016.
  • HUSKY D is a significant source of coverage for behavioral health care. In 2016, more than one in three HUSKY D members – 36 percent – used their coverage to get care for a mental health condition or substance use disorder.
  • Outcomes have improved for diabetes patients with HUSKY D. A review of more than 500 HUSKY D members with diabetes found that the percentage whose blood glucose was under control rose from 31 percent to 50 percent from 2012 to 2016.

The report also examines the role HUSKY D plays in other policy work in the state, including addressing the opioid crisis and helping those leaving prison get medical and behavioral health treatment when they return to society. The report notes that before HUSKY D, individuals with substance use disorders were generally not eligible for Medicaid, creating a major barrier to treatment.

“Health insurance coverage is a critical first step to health, but it is also important to ensure that people are able to use that coverage to get care, and for that care to make a difference in people’s health,” said Patricia Baker, president and CEO of the Connecticut Health Foundation. “This research underscores the importance of HUSKY D in giving low-income state residents the tools to take care of their health.”

HUSKY D covers adults ages 19 to 64 who do not have minor children and whose income falls below 138 percent of the poverty level – the equivalent of $16,643 for an individual. (For comparison purposes, a person working 30 hours per week at Connecticut’s minimum wage – $10.10 per hour – would earn $15,756 in a year, the report indicates.)

The report concluded that “nearly eight years after Connecticut expanded HUSKY to cover more low-income adults, HUSKY D has made a significant impact on the state’s uninsured rate and the lives of thousands of people. The majority of those covered are using this insurance to get preventive care, and the rate of emergency department usage has declined, a promising trend.”

The report also notes that the federal government has “financed more t
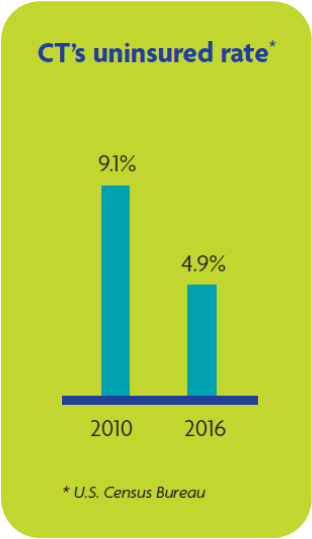
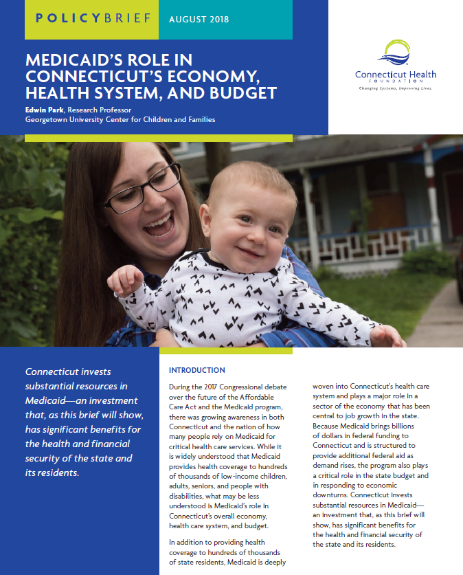
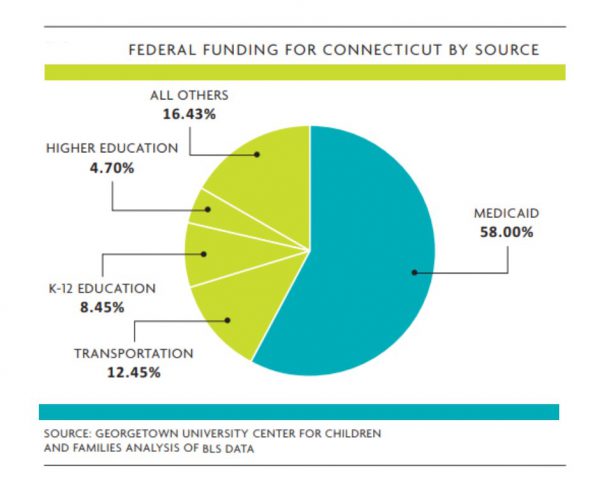
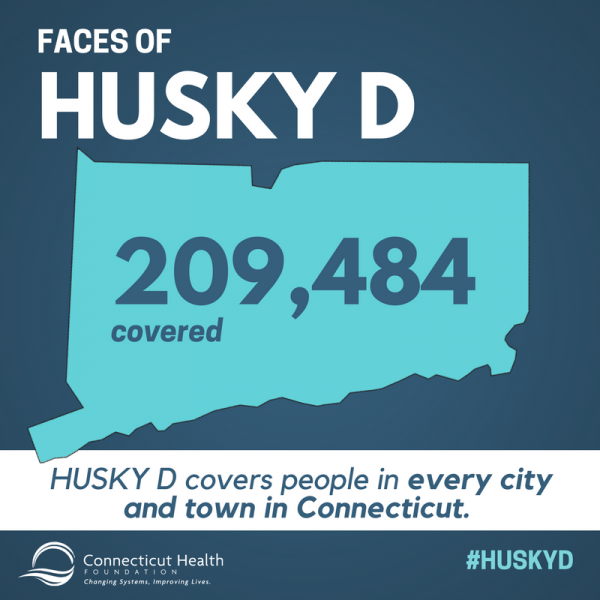
han 90 percent of the cost of the program, allowing Connecticut to cover more than 200,000 people with a relatively small budgetary impact.” Currently, the federal government pays 94 percent of the cost of coverage and the state pays 6 percent. The report also identifies challenges associated with HUSKY D, including concerns raised by health care providers about Medicaid payment rates and uncertainty in federal funding.

The report’s analysis indicates that HUSKY D enrollees live in every city and town in Connecticut.  The largest number of covered individuals live in Hartford (18,404), Bridgeport (16,330), New Haven (15,583), Waterbury (13,989), New Britain (8,439) and Stamford (6,110).

The Connecticut Health Foundation is the state’s largest independent health philanthropy dedicated to improving lives by changing health systems. Since it was established in 1999, the foundation has supported innovative grantmaking, public policy research, technical assistance, and convening stakeholders to achieve its mission – to improve the health of the people of Connecticut. Since its creation, the Connecticut Health Foundation has awarded grants totaling more than $60 million in 45 cities and towns throughout the state.


High School A Risky Time for CT Students, Survey Finds

The Youth Risk Behavior Surveillance System was designed to focus the nation on behaviors among youth related to the leading causes of mortality and morbidity among both youth and adults and to assess how these risk behaviors change over time. In Connecticut, the times they are a changin’.  Data released this week by the state Department of Public Health highlights changes over the past decade, and disparities among current students depending upon their grades in school.

The Youth Risk Behavior Surveillance System measures behaviors that fall into six categories:

  • Behaviors that contribute to unintentional injuries and violence;
  • Sexual behaviors that contribute to unintended pregnancy and sexually transmitted diseases, including HIV infection;
  • Alcohol and other drug use;
  • Tobacco use;
  • Unhealthy dietary behaviors; and
  • Inadequate physical activity.

The 2017 Youth Risk Behavior Survey (YRBS) includes randomly chosen classrooms within selected schools, and is anonymous and confidential.  It was completed by 2,425 students in 38 public, charter, and vocational high schools in Connecticut during the spring of 2017. The school response rate was 76%, the student response rate was 81%, and the overall response rate was 61%. The results are representative of all students in grades 9-12, according to the state Health Department.

The survey found that during the past decade, the percentage of students who rarely or never wore a seat belt has declined by one-third, as has the percentage who drove a car at least once in the previous month after they had been drinking.  That drop was between 2013 and 2017.

The percentage of students who “felt sad or hopeless” almost every day for a two week period “so that they stopped doing some usual activities” during the previous year climbed from 228% in 2007 to 26.9% in 2017 – more than one-quarter of students.  The survey found that in 2017, 13.5% of students seriously considered attempting suicide and 8.1% attempted suicide during the past year.

More than one-third of students (34.6%) of students did not eat breakfast every day in the week preceding the survey, and 14.1% did not eat breakfast on any of those days.  The percentage of students who got 8 or more hours of sleep on an average school night dropped from 26% in 2007 to 20% in 2017,

The survey also found that 25.8% of students with mostly A’s and 48.6% of those with the lowest grades (D or F) have used marijuana at least once in their lifetime.  More than one-quarter of students, across all academic grades (A-F) responded that they drank alcohol at least once in the month prior to the survey.

The survey found that 38 percent of students whose grades were mostly A’s texted or e-mailed while driving a car on at least one occasion in the 30 days prior to the survey.  The percentage was slightly less among students with lower grades:  31% of students with mostly B’s, 30% of students with mostly C’s and 23% of students with mostly D’s and F’s.

When it came to the percentage of students who rode with a driver who had been drinking alcohol (one or more times during the 30 days prior to the survey), students with better grades did so less often, ranging from 12% of students with mostly A’s to 26% of students with mostly D’s and F’s.

The survey also found that 1 out of 5 students (20.1%) whose grades were mostly D’s and F’s did not go to school because they felt unsafe at school or on their way to or from school, on at least one day during the 30 days prior to the survey.  Among those with mostly A’s, that percentage was just under 4 percent.

Among those with the lowest grades, 38.9% were in a physical fight at least once during the previous 12 months, and 19.7% were threatened or injured with a weapon on school property, such as a gun, knife, or club, at least once during the past year.  Among those with mostly A’s, the percentages were 10.2% and 3.6%.

https://youtu.be/d63xyYs9s94