CT’s Local Government Workforce Shrinks 7.4% in Past Decade; 10th Largest Reduction in US from Employment Peak

Connecticut’s local municipal workforce has been shrinking for the past decade, and had been reduced 7.4 percent by 2015 when compared with the peak employment year of 2005, according to a new analysis by Governing magazine.  The drop in local government employment is the 10th largest in the country by percentage of workforce, when peak employment levels were compared with 2015 numbers. “Going on nearly a decade since the start of the recession, localities in many parts of the country have since restored public payrolls to prior levels. But some still employ far fewer workers than they did before the downturn,” Governing reported.

Governing compared each state's pre-2010 peak aggregate totals to the latest 2015 data, excluding the education sector.  In all, the magazine reported, local governments in 26 states had yet to see payroll expenditures return to prior levels when adjusted for inflation. Similarly, local public employment remains below previous highs in most states and is down 3.5 percent nationally from 2008.

The steepest declines in local government payrolls, when 2015 data was compared with the peak pre-recession year, came in Delaware (-20.5% from 2007), Michigan (-18.2% from 2003), Arizona (-17.1% from 2008), Rhode Island (-16.5% from 2003), Massachusetts (-14.4% from 2008), Nevada (-14.1% from 2009), Florida (-11.0% from 2008), Indiana (-8.8% from 2008), New Jersey (-8.3% from 2009) and Connecticut (-7.4% from 2005).

Where localities chose to make payroll cuts has varied, according to the analysis, but a number of patterns were pointed out, based on Census data.  When national employment estimates were compared with 2008 levels, non-sworn police employees sustained the single largest reduction of any major category of workers, the analysis indicated. Governing suggested the reductions were likely a result of police departments trimming civilian staff to maintain the size of police forces on the streets. Nationally, the number of police and firefighters were down 2.6 percent from 2008 while all other areas of local government, excluding education and hospitals, experienced a larger 4.5 percent decline.

At the opposite end of the spectrum, North Dakota, South Dakota, Wyoming, Montana and New Mexico recorded the biggest increases in noneducation payrolls since the recession began in 2008-2009.  Half the states showed an increase in local government payrolls, and despite the generally slow recovery across many regions of the country, U.S. local government payroll spending overall showed a slight three  percent nationwide uptick between 2014 and 2015, according to the analysis.

Financial Cost to Connecticut Smokers Among Highest in the Nation

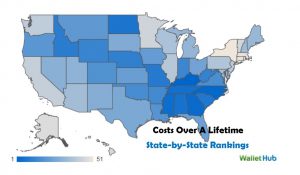
The financial cost of smoking in Connecticut is higher than just about anywhere in the United States.  The total cost over a lifetime per smoker is $2,183,204, the third highest in the nation, and the annual cost per year per smoker of $42,808, is also third highest in the nation, just behind New York and Massachusetts. The lifetime health care cost per smoker, $274,272 in Connecticut, is higher than every state but one, (Massachusetts), and the out-of-pocket cost per smoking individual of $170,513 for smokers living in Connecticut is third highest in the nation.

The data was compiled by the financial website WalletHub, where analysts calculated the potential monetary losses — including the cumulative cost of a cigarette pack per day over several decades, health-care expenditures, income losses and other costs — brought on by smoking and exposure to secondhand smoke. 

Emphasizing that “the negative physical and financial effects of smoking can be significant,” WalletHub noted that Connecticut’s rankings placed it as among the most costly in every category.

Over a lifetime, the financial opportunity cost for smokers living in Connecticut was $1.436,335 and the income loss per smoker was calculated at $286,950.  Other costs per smoker, such as not being able to qualify for homeowner’s insurance discounts for non-smokers, were $15,133.  In each instance, the costs in Connecticut were among the three highest among the 50 states and District of Columbia.

Annual income loss for Connecticut smokers is calculated at $5,626.  Only Maryland, Alaska, New Jersey and D.C. were higher, according to the analysis. Attributable factors included absenteeism, workplace bias or lower productivity due to smoking-induced health problems.  The website also noted that according to a recent study from the Federal Reserve Bank of Atlanta, smokers earn 20 percent less than nonsmokers, 8 percent of which is attributed to smoking and 12 percent to other factors.

For the calculations, WalletHub assumed an adult who smokes one pack of cigarettes per day beginning at age 18, when a person can legally purchase tobacco products in the U.S., and a lifespan thereafter of 51 years, taking into account that 69 is the average age at which a smoker dies. Data used in developing the ranking were collected from the U.S. Census Bureau, Bureau of Labor Statistics, Centers for Disease Control and Prevention, Insurance Information Institute, NYsmokefree.com, Federal Reserve Economic Data (FRED), Kaiser Family Foundation and the Independent Insurance Agents & Brokers of America.

In 2016, the American Lung Association gave Connecticut an “F” grade in its spending of tobacco prevention and control funds.  The ALA points out that 40 states and Washington D.C. spend less than half of what the Centers for Disease Control and Prevention recommends on their state tobacco prevention programs.  Overall, states spend less than two cents of every dollar they get from tobacco settlement payments and tobacco taxes to fight tobacco use.  Each day, more than 2,600 kids under 18 try their first cigarette and about 600 kids become new, regular smokers, according to nationwide data from ALA.

A report on Connecticut's spending on tobacco prevention just over a year ago found that the state was being outspent over 67 times by tobacco companies' marketing efforts - due in large part to the state spending only a small portion of tobacco settlement funds on anti-smoking efforts.

The report, “Broken Promises to our Children: A State-by-State Look at the 1998 State Tobacco Settlement 17 Years Later," said the state was spending $1.2 million in FY 2016 to fight tobacco use. That's compared to an estimated marketing investment of $80.4 million by tobacco companies in Connecticut that year. The national average shows a margin of 20.1 to 1.  At that time, Connecticut ranked 38th in spending on a percentage basis.  The state has consistently spend less than the CDC has recommended.

The annual report was developed by the Campaign for Tobacco-Free Kids (CTFK), a coalition that includes the American Heart Association, the American Cancer Society Cancer Action Network, the American Lung Association, the Robert Wood Johnson Foundation, Americans for Nonsmokers’ Rights, and the Truth Initiative.

A year later, the next report ranked Connecticut last, as Connecticut’s projected spending on smoke cessation and tobacco prevention efforts for FY 2017 dropped to zero.  The report found that 13.5 percent of adult state residents are smokers, and 10.3 percent of high school students smoke.  Just under 5,000 deaths each year are caused by smoking in Connecticut, and 27 percent of cancer deaths are attributable to smoking.  Connecticut’s cigarette excise tax, $3.90 per pack, is the second highest in the nation. It was estimated that the state would collect $519.7 million in revenue this year from the 1998 state tobacco settlement and tobacco taxes, but will spend none of it on tobacco prevention programs.


CT Seen As Hiding Bad Budget News

In an article headlined “Bad Budget News? Some States Just Bury It.” Connecticut is one of two states selected as a poster child for what a national publication describes as “hindering transparency.” The Connecticut policy that brought the unwelcome attention was put in place last year.  As Governing explains:

“Connecticut ended its practice of current services projections. That’s a boring-sounding way of talking about how much programs will cost over time, assuming there are no policy changes. It’s a baseline against which to compare any proposed cuts or increases in spending.”

Ben Barnes, Connecticut’s budget director (Secretary of the Office of Policy and Management), said last year that it didn’t make sense to project shortfalls or surpluses into the future, Governing explains. “There’s no such thing, in my view, as a deficit or a surplus in years in which there is no appropriation in place,” said Barnes, whose photo accompanies the article.

Some legislators complained that the new rules would be a blow against transparency in the budget. The change was adopted anyway, the publication noted, adding that a majority of states already choose not to publish current services projections.

“There is kind of a tendency for policymakers to focus on the immediate and not the future,” Liz McNichol of the Center on Budget and Policy Priorities, told Governing. “This reduces the outside pressure to look beyond one year.”

The publication’s report notes that Connecticut “will have to fill a shortfall of more than $1 billion in its budget this year.”

The other state highlighted in the article is Kansas, where a state task force recommended that the department stop releasing monthly budget reports after numerous reports indicated that the state had fallen short of anticipated revenues.   The Governor’s administration also “decided to kill a quarterly economic report that was also habitually filled with bad numbers.”

Governing is the nation's leading media platform covering politics, policy and management for state and local government leaders.


Rate of Success Obtaining Venture Capital is High in Hartford, Study Finds

A look at the nation’s 50 largest metropolitan areas to see how entrepreneurs have fared in their quests to secure money from venture capitalists, angel investors, and online crowds brought a somewhat surprising result – among the cities mentioned as ranking high in venture funding success rates was Hartford. Connecticut’s Capitol was listed among a handful of cities with success rates for businesses seeking venture capital that “are about twice as high as the national average.” According to a new report issued this month by the Kauffman Foundation, roughly $68 billion was invested in venture capital (VC) deals in the United States in 2014 and 7,878 employer businesses reported receiving venture capital funds. Thirty percent of those recipients were located in just four metro areas: New York, Los Angeles, San Francisco, and Boston. The national average was 0.2%.vc

Among the metro areas that rank highly in terms of those venture funding success rates, according to the report “Trends in Venture Capital, Angel Investing and Crowdfunding,” include: San Francisco, CA (0.8%), San Jose, CA (0.8%), Boston, MA (0.5%), Hartford, CT (0.5%), Memphis, TN (0.4%), Minneapolis, MN (0.4%), Philadelphia, PA, (0.4%), Richmond, VA (0.4%), Washington, D.C. (0.4%). Among the lowest ranked of the 50 largest metropolitan regions in the nation, at 0.1 percent, were Baltimore, Denver, Jacksonville, Las Vegas, Orlando, Riverside, and Tampa.

The report noted that “Some perhaps unlikely metro areas rank highly in terms of those venture funding success rates: Hartford, Memphis, Richmond, and Buffalo. This doesn’t necessarily mean that there are higher quality firms there, and, of course, the volume of firms seeking VC is smaller…And, these data don’t mean that all the funding came from local sources: venture capital firms in New York could be investing in Hartford businesses. But these numbers lend credence to arguments…that high-quality deals can be found everywhere, and that firms in these regions can succeed in raising equity capital.”

While 10.3 percent of entrepreneurs report using personal credit cards when starting their business, nationally, only 0.6 percent initially received venture capital, the analysis found.

The metros with the highest percentage of firms receiving venture capital funding when starting include: San Jose (2.4%), San Francisco (1.5%), Salt Lake City (1.3%), Austreportin (1.2%), Baltimore (1.1%), Birmingham (1.1%), and Nashville (1.1%).

According to the report, based on the 2014 Annual Survey of Entrepreneurs (ASE), “the primary sources of initial financing for new businesses in the United States are: personal and family savings, bank business loans, and personal credit cards.”  The report notes, however, that “entrepreneurs also tap other sources of funding, including venture capital, which “can be disproportionately important for business growth.”

The ASE, conducted by the U.S. Census Bureau, is the largest annual survey of American entrepreneurs ever done, and is done in a public-private partnership between the Census Bureau, the Kauffman Foundation, and the Minority Business Development Agency. The ASE samples approximately 290,000 employer businesses across all U.S. geographies and demographics, the report explained.

The top metropolitan statistical area for crowdfunding success in 2014 was Charlotte; for angel investing, San Jose led the way.  The report concludes that the concentration of venture capital firms in California, Massachusetts, and New York, “is well-correlated with the relative concentration of firms that receive VC investments.” Crowdfunding campaigns in Minneapolis and Oklahoma City, the report indicates, “may not be entirely due to local funders.”

“The ASE data add quantitative confirmation to what we know from other sources: high-quality entrepreneurs can be found—and can get funding—in nearly every corner of the United States.”

Including Hartford.

CT is Among 24 States Seeing Weak Revenues, Highest Number Since Recession

Connecticut is not alone. According to the National Association of State Budget Officers’ (NASBO) annual state spending survey, half of all states saw revenues come in lower than budgeted in fiscal 2016 and 24 states – including Connecticut - are seeing those weak revenue conditions carry into fiscal 2017. the-chartThat is the highest number of states falling short of revenue projections since 36 states budgets missed their mark in 2010, according to the NASBO report and Governing.  As a result, 19 states made mid-year budget cuts in 2016, totaling $2.8 billion, Connecticut among them. That number of states “is historically high outside of a recessionary period,” according to the report.  The revenue slowdown is caused mainly by slow income tax growth, even slower sales tax growth and an outright decline in corporate tax revenue, the report explains, stating that “progress since the Great Recession has been uneven, and many states are seeing softening state tax collections.”fall-2016-fiscal-survey-cover

Overall, state spending totaled $786 billion last fiscal year, a 3.7 percent annual increase. Although it marks the seventh straight year of spending growth, it represents a slowdown from fiscal 2015 when spending increased by 4.4 percent.

“Weaker-than-anticipated revenue collections and resulting budget gaps in fiscal 2016 led some states to cut spending during the year,” the report indicated, with overall spending increasing just 1.8 percent to $781 billion in fiscal 2016, compared with the previous year’s growth of 5 percent. When accounting for inflation, 32 states are still spending less than they did before the Great Recession and total state spending also has yet to surpass pre-recession levels.  Across the states, cuts enacted by legislatures come most often in K-12 education, an “all other” category, followed by Medicaid, higher education and corrections, according to data compiled for the NASBO report.

The state has an estimated $1.3 billion or $1.5 billion budget deficit, according to reports from the governor’s Office of Policy and Management and the legislature’s nonpartisan Office of Fiscal Analysis, CTNewsJunkie reported recently.

“Certainly a recession is coming sometime soon,” said NASBO President-elect Michael Cohen, who is also California’s finance director, told Governing. “But I think economists in all of the state offices would tell you that’s a really hard economic forecasting [task] of predicting when that’s going to happen.”  NASBO had previously predicted that fiscal 2016 would mark the full recovery of state budgets from the recession, but the cutbacks and increased inflation has delayed that at least another year.

The report indicates that eight (including energy-producing states like Alaska, North Dakota and Oklahoma) planned to spend less in 2017, and 11 states planned to up their spending by 6 percent or more next year. In those states, sales tax increases have improved their revenue with Louisiana, for example, anticipating a 17 percent increase in revenue, driven by an expected $800 million increase in sales tax collections.

Most states have focused on strengthening their rainy day funds, according to the report, though some states – particularly energy-producing ones – have had to tap their reserves to help address budget shortfalls. Twenty-nine states increased their rainy day fund balances in fiscal 2016, and 25 states project increases in fiscal 2017. Since aggregate rainy day fund levels hit a recent low in fiscal 2010, 40 states had increased their amounts as of the end of fiscal 2016, at least in nominal terms, the report said.

“States will also have to contend with rising spending demands in areas such as health care and education, long-term pressures such as pensions and infrastructure, and increasing federal uncertainty,” the report predicted, “particularly concerning the prospects of tax reform and health care policy. In this environment, states are likely to be cautious in their spending and revenue forecasts, as they continue to focus on ensuring structurally balanced budgets.”

https://youtu.be/uAvz-zo9NQw

Public Hearings Conclude; State Spending Cap Commission Seeks Definitions to Impact Spending Decisions

“Stop with the financial games and own up to the problem.”  That was the succinct comment provided to the 24-member state Spending Cap Commission by Darien resident Ken Weil at a public hearing this fall.  Small business owner Justin Higgins, of Orange, added that citizens should “always know where we stand financially without loopholes and political gamesmanship.” The Commission has held 18 meetings, beginning in March and most recently on November 14, as well as five public hearings during the past two months, during which nearly two dozen people filed testimony.  With the state anticipating an estimated $3.1 billion deficit for the next two fiscal years, dollars and sense will be front and center when the legislature, with 30 new members and a dead-even split in the State Senate, convenes in January.

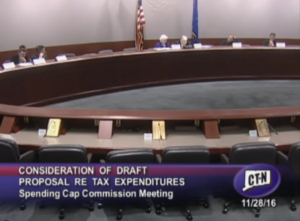
The Commission next meets on Nov. 28, according to CT-N.  Public Act 15-1, December Special Session (Section 24) established the Spending Cap Commission, charged with creating, for the purposes of the state's constitutional general budget expenditures requirements, proposed definitions of (1) "increase in personal income", (2) "increase in inflation", and (3) "general budget expenditures".

What the commission has been asked to address is two decades in the making - definitional questions with fiscal implications that have influenced policy and budget balancing since the passage of the state income tax in the early ‘90’s.  The Director of UConn’s Center for Economic Analysis, Fred Carstensen, said in an article published this month that “the spending cap as designed has been an unmitigated disaster, fiscally and economically.” spending-cap

The Commission is chaired by William Cibes, a former state legislator and Secretary of the Office of Policy and Management when the income tax was imposed and state spending cap was approved by voters, and Patricia Widlitz, also a veteran former legislator.  Members include Republicans and Democrats currently serving in the legislature, and others who have extensive experience with state government, in the public or private sector.  It is likely that the incoming state legislature will be looking to the Commission’s findings, as it grapples with the way forward for state finances.

As the public hearings approached in October, the Commission voted to include the following proposed definitions to be addressed:

  • “Increase in personal income” means the compound annual growth rate of personal income in the state over the preceding five calendar years, according to United States Bureau of Economic Analysis data
  • “Increase in inflation” means the increase in the consumer price index for urban consumers, all items less food and energy, during the preceding calendar year, calculated on a December over December basis, according to United States Bureau of Labor
  • The Commission is still considering potential optional language for the third proposed definition – “general budget expenditures” – it is charged with creating. That language may concern, among others, such expenditures as payments for bonds, notes and other evidences of indebtedness, court orders, federal mandates, grants to distressed municipalities, as well as the use of federal funds and monies contained in the budget reserve fund. Proposed language pertaining to these and other additional topics pertaining to general budget expenditures may also be suggested at the public hearing, and considered by the Commission.

Some of the comments received by the Commission, at hearings in Hartford, New Haven, Bridgeport, Willimantic and Waterbury, are quite clear on what the result ought to be done, even if precise wording is not offered:

connecticut-state-capitolLouise DiCocco, Assistant Counsel for the Connecticut Business & Industry Association, noted that “24 years ago, more than 80 percent of Connecticut votes overwhelmingly approved a spending cap to keep the cost of state government within the taxpayers’ means to afford it.  Voters demanded the cap as an offset to the persona income tax in Connecticut.  The state must enact a spending cap that is ironclad and works.”

Added the MetroHartford Alliance in testimony by Vice President Patrick McGloin: “Adoption by the legislature of well-crafted spending cap definitions will clearly demonstrate to our fellow residents and private sector employers that we have the political will to be fiscally disciplined.”  DiCocco noted that “the spending cap has always had a safety valve or escape mechanism.  They include bonded debt service, aid to distressed municipalities and first year costs of federal or court ordered mandates.”

The Connecticut affiliate of the National Federation of Independent Businesses pointed out that “reasonably understood, clear definitions of the key terms that will lead to additional budget transparency, predictability and ultimately cap state spending on an annual basis in a way that aptly reflects the will of the voters,” adding that “business owners feel that the legislature absolutely needs to stop allowing excessive spending to be an option and to recognize the ‘new economic reality’, just as small business owners have had to do. Achieving that goal is the most effective economic development policy we could have, and we believe that implementing the constitutional spending cap, and properly defining component terms, would go a long way in this regard.”

Westport resident Tom Lasersohn observed that “In business you learn that for every one customer that complains, there are many you have already lost as customers. For every citizen who gives testimony to this Commission, there are many who are so disgusted with the State’s fiscal mismanagement and chicanery that they will leave at the earliest convenient opportunity. Many outside the State peer in and resolve ‘no, not for me until the State gets its fiscal act together.’ A responsible definition for ‘general fund expenditures’ will communicate to both current and prospective residents and businesses that we are serious about fixing our problems.”
official_logo_mdState Senator Toni Boucher of Danbury told the Commission:  “I hope that the commission to adopt a definition of general budget expenditures that is comprehensive and gives a complete and realistic account of all the money that the state spends… it is equally critical that the legislature not be allowed to move what was once an expenditure included under the cap to bonding or fund it with a revenue intercept for the purpose of undermining the cap’s integrity.”

The final form of Commission recommendations remains unclear.  Minutes of the Commission’s most recent scheduled meetings, on October 31 and November 14, have not yet been posted to the Commission’s website, nor has an agenda for the Nov. 28 meeting (as of Nov. 27).

While Boucher is not a member of the Commission, a number of her legislative colleagues are.  The definitions – and the implications for the state’s budget and taxpayers – may soon be theirs to decide.  A decade ago, a UConn report observed that “the spending cap is only as restrictive as the legislative process decides it should be; its strictures are not written in stone.”
ct-nUPDATE: 

link to Agenda for Commission's Final Meeting on Nov. 28, 2016 and CTNewsJunkie article reporting on meeting.

link to CT-N video of Commission's Meeting on Nov. 28  at the Legislative Office Building in Hartford; Next meeting scheduled for Dec. 5

First Niagara Transitions to KeyBank This Weekend

For customers of the soon-to-be-history First Niagara Bank, this will be a holiday weekend of banking transition, as KeyBank becomes the new name on the door on Tuesday morning after a host of changes inside. First Niagara branches, converting to KeyBank, will close at 3 p.m. Oct. 7 and reopen for business the morning of Oct. 11, the day after Columbus Day. The company promises a smooth transition, and has been providing customers of the bank’s more than 60 branches in Connecticut with step by-step previews of what to expect. The changes represent the completion of the $4.1 billion KeyCorp purchase of First Niagara.logo-lockup

“As KeyBank and First Niagara come together you can continue to bank as you currently do, using your same account number, checks, debit card, ATM card, credit card, telephone banking, online access and branches,” the company website points out.

First Niagara has 65 branches in Connecticut that will be transitioned to KeyBank branches. There were no existing KeyBank branches in the state prior to the merger, so there was no overlap that required branch closings, as is often the case with bank mergers.

Headquartered in Cleveland, KeyBank’s footprint includes 15 states via a network of more than 1,200 branches and more than 1,500 KeyBank ATMs. The company’s roots trace back 190 years to Albany, New York. Since then, KeyCorp has grown into one of the nation's largest bank-based financial services companies, among the top 15, with assets of approximately $135 billion, according to the company.

keybank-mapIn recent months, First Niagara did consolidate five Connecticut branches (Woodstock, Dayville, Hamden, East Haven and Madison), and all of the employees who worked at those branches were offered positions within the bank, officials indicated, and no layoffs were associated with that consolidation.

"By asset size, this is the largest bank merger since the financial crisis,” Beth E. Mooney, Key’s chairwoman and CEO, told the Buffalo News last month, during a visit to Key’s Northeast regional headquarters in Buffalo, which had been First Niagara’s corporate headquarters.

“So there is a significance and an importance for us to do it well that’s critical for our communities, our clients, our employees and our shareholders. But from an industry perspective, this is actually one that there’s a fair amount of eyes on us, as well.”

The conversion of First Niagara accounts and services to KeyBank will begin at with a 3 p.m. close of business on Friday, October 7.  Due to Online Banking updates, customer balances that appears online on Thursday, October 6 at 11:59 p.m. will not change until Saturday, October 8, at 6 a.m., so any purchases or deposits made during that time will not be reflected on online balances until Saturday. Customers can continue to use current First Niagara ATM/debit card, account numbers and PINs will not change.

The acquisition of First Niagara by Keycorp was announced on Oct. 30, 2015, and includes the addition of approximately 300 First Niagara branches in New York, Pennsylvania, Connecticut and Massachusetts.  First Niagara had entered the Connecticut market in 2011 with the purchase of New Alliance Bank.

Connecticut Public Accounting Firms Reach National Rankings

The largest Connecticut-based public accounting firm, BlumShapiro, earned the #54 position in the nation’s top 100, according to the publication Inside Public Accounting.  It is one of a handful of Connecticut firms to make the annual top 300 list, in addition to regional firms with offices in Connecticut. BlumShapiro is the largest regional business advisory firm based in New England providing accounting, tax and business consulting services. The firm serves clients from six offices offices in Connecticut (West Hartford and Shelton), Massachusetts and Rhode Island. BlumShapiro ranked #53 last year. 2016_ipa-300_web-147x150

Noted among the nation’s top 200 public accounting firms is Hartford headquartered Whittlesey & Hadley.  The firm, ranked at #155 this year, up from #178 a year ago, and #192 in 2014, has two additional offices, located in Hamden, CT and Holyoke, MA. The firm provides a comprehensive array of accounting, auditing, tax, and advisory services to a broad range of businesses and individuals.

Ranked #285 is Reynolds & Rowella LLP, which maintains offices in Ridgefield and New Canaan.  “We are proud to be counted among the top-ranked accounting firms nationwide on a list that includes Deloitte, PwC, Ernst & Young and KPMG,” Frank Rowella, Reynolds & Rowella’s managing partner, told the Fairfield County Business Journal. “The IPA list is known as one of the most thorough and accurate sets of rankings in the accounting profession. Our inclusion reflects our determination to provide the very best quality compliance and financial services solutions to our valued clients.”

blum At #296 is Glastonbury-based Fiondella Milone & LaSaracina.  FML was founded in 2002 “for the purpose of providing professional auditing, tax and business consulting services to a wide range of clients and industries throughout the Northeast,” the company’s website indicates.  After working together at Ernst & Young, the firm’s founding partners, Jeff Fiondella, Frank Milone and Lisa LaSaracina launched FML.

Inside Public Accounting (IPA), founded in 1987, is published by The Platt Group. The Platt Group publishes both the award-winning Inside Public Acwhcounting newsletter and the award-winning National Benchmarking Report.
Beginning in 1994, INSIDE Public Accounting’s Survey and Analysis of Firms and the resulting national benchmarking report on the nation’s largest accounting firms has served as a barometer of the overall health, challenges and opportunities of the profession, according to the publication.

Annually more than 500 accounting firms across the North America complete the in-depth financial and operational survey. The data is then used to compile the annual ranking of the nation’s largest accounting firms, which is unveiled in August of each year. The annual IPA rankings are considered to be among the longest-running, most accurate and up-to-date for the nation’s largest accounting firms.

Leading the list nationally were Deloitte, PricewaterhouseCopers, Ernst & Young, KPMG, RSM, and Grant Thornton.  Ranked at #11 is New York based CohnReznick, which has offices in Hartford.  Marcum LLP ranked #16, Citrin Cooperman & Company, also based in New York and ranked #21, has offices in Fairfield County.

Financial Capital Remains Hurdle for Women Entrepreneurs

“Data reveal that an increasing number of women are choosing entrepreneurship as a career path, and of those, a growing number of them share aspirations for growth.”  That fact, pointed out in the preface of a new book co-written by a local university professor, is the proverbial tip of the iceberg. According to the U.S. Census Bureau, there are roughly 9.9 million women-owned firms in the United States, representing over a third of all firms in the country—and the ranks of new enterprises with women at the helm are growing rapidly. Between 2007 and 2012, women-owned firms in the U.S. grew by 27 percent compared to a growth rate of 2 percent for firms overall.

“But in spite of their impressive growth in numbers,” writes University of Hartford finance professor Susan Coleman, “the business ventures women are launching today continue to lag behind those launched by men in terms of revenues and employment. So while an increasing number of women can count themselves as entrepreneurs, many appear to be running into barriers, as the vast majority of their businesses remain quite small.”6a00d8342f027653ef01b8d205bcbd970c-800wi

Coleman, along with Alicia M. Robb, have co-authored The Next Wavcoleman_8_13e: Financing Women’s Growth-Oriented Firms (published by Stanford University Press), which points to “three essential factors that women entrepreneurs need to thrive: knowledge, networks, and investors. In tandem, these three ingredients connect and empower emerging entrepreneurs with those who have succeeded in growing their firms while also realizing the financial and economic returns that come with doing so.”

Robb is Senior Fellow with the Ewing Marion Kauffman Foundation and Visiting Scholar at the University of California, Berkeley and the University of Colorado, Boulder. She previously worked with the Office of Economic Research in the Small Business Administration and the Federal Reserve Board of Governors. Coleman is Professor of Finance and Ansley Chair at the Barney School of Business at the University of Hartford.

Coleman notes that “A crucial pitfall is that women face unique challenges in their attempts to acquire financial capital. Growth-oriented firms typically require substantial investment—both in the form of bank loans and external equity in the form of angel or venture capital funding—to scale up.” Studies reveal, however, that “women entrepreneurs raise significantly smaller amounts of capital than men and face continued barriers in their attempts to secure external equity in particular,” Coleman points out.

In the book’s forward, the authors explain that the motives behind women-run entrepreneurial businesses vary.  “Some of these growth-oriented entrepreneurs are motivated by a desire to pursue an opportunity or an unmet need in the marketplace.  Others are frustrated by the constraints imposed by a ‘glass ceiling’ that prevents them from reaching the most senior ranks of corporations.  Still others are drawn by the financial and economic rewards that can come from leading a firm that achieves scale.”

According to IRS data, women represent over 40 percent of top wealth holders in the United States, yet estimates from the University of New Hampshire’s Center for Venture Research indicate that they represented only 25 percent of angel investors in 2015, Coleman notes.

Optimistic about the future success of women entrepreneurs, Coleman and Robb observe that “Successful women entrepreneurs who are paying it forward in a variety of ways are a driving force” in what they describe as the “next wave.”

“In a virtuous cycle, women entrepreneurs evolve from being the recipients of human, social, and financial capital into becoming the providers of those key resources as their firms grow and create economic value. The more successful women at the helm of businesses that kick off cash, the more women there are to invest in others, and the faster we see the number of women grow in the ranks of larger businesses and investing.”

In addition to appreciation expressed to the Kansas City-based Kauffman Foundation for financial support, the book’s acknowledgements note that the Barney School of Business and the University of Hartford’s Women’s Education and Leadership Fund provided grants that helped support initial research and development of case studies on women entrepreneurs. The authors also expressed appreciation to three University of Hartford graduate assistants – Ece Karhan, Mert Karhan, and Isha Sen – who “played an invaluable role in the book’s development.”

Student Loans Grow; Home Ownership Pushed Back 5 Years, on Average

An analysis on the cost of student loans and home-buying nationwide finds that it takes graduates with the average student loan debt of $28,950 about 5 years longer to save a 20 percent home down payment. Thereafter, these graduates have almost $50,000 less in home equity 15 years after graduation compared to debt-free graduates, according to an analysis by GoodCall, The Real Cost of Student Loans. In Connecticut, where 62 percent of students graduate with debt averaging $29,750, above the national average, and home prices tend to be higher than in most states, the challenge is particularly acute.  Delaware has the highest average student loan balances, at $33,808. Utah has the lowest, with $18,921, according to data compiled by the Institute for College Access & Success and included in the report.loans home

Nationally, average debt for new bachelor’s degree recipients rose at more than double the rate of inflation from 2004 to 2014, but in some states it grew even faster.  In Connecticut, the percentage of graduating students with debt rose from 57 percent in 2004 to 62 percent in 2014; the average amount of debt increased by 57 percent (20th highest increase among the states), from $18,906 to $29,750.

Homeownership has generally fallen over the past decade, and for college graduates with student loan debt, the downward trend is even more marked, according to research by the Federal Reserve Bank of New York, the report indicates. What is clear, the report notes, is that after college, graduates with student debt must use part of their income to pay down loans. This means less income is available for saving compared to debt-free graduates.high debt

It also means that graduates with student loan debt will have to save at a higher rate than their debt-free counterparts to buy a home sooner. This points to another challenge student loan borrowers face: making tough decisions over whether to pay student loans off as quickly as possible or save for big purchases like a home, the report explains.

Waiting longer to buy a home can mean missing out on accruing home equity, an important part of building wealth and financial security over the long term. Home equity is how much of the home’s current value is owned by the homeowner. This is calculated by taking the current market value, which typically grows year over year, and subtracting any remaining mortgage payments.

A recent Harvard study noted in the report revealed the consequences for wealth building that these financial decisions can have over the long-term, where college-educated households with student loan debt were found to have significantly less in assets, cash savings, and net wealth compared to college-educated households without student loans.

Among the report’s key findings regarding the home buying timeline:sld

  • A 23-year-old debt-free college graduate today will be ready to buy a home with a 20 percent down payment in 2021 at age 28. That’s five years earlier than the 33-year-old average home buyer today.
  • Graduates with $12,000 in student loan debt can expect to save until 2022 before they’re able to put a 20% down payment on a median price home.
  • A 23-year-old graduate with $28,950 in student loan debt today will be saving until 2026 before she can make a 20% down payment on a home, at age 33 – the current average age for home buying.
  • Graduates with $50,000 in student loans will be saving until age 36 in 2029 before they’ll have enough for a 20 percent home down payment.

The report also highlights the impact of student loans on the age at which people decide to get married, their job choices, starting salaries and retirement savings – and the impact those choices have on their ability to pay off student loans.