Connecticut Among Five States with Highest Percentage of Foster Children in Group Homes, Report Says

The percentage of children in foster care in Connecticut who have not been placed with a foster family is among the highest in the nation, according to a report issued in 2015.  The report, from the Annie E. Casey Foundation, highlights the differing policies and practices among states, stressing that “kids should live with relatives or foster families when they have been removed from their own families, but one in seven nationally lies in a group placement.” In Connecticut there are 4,071 children in foster care, with 74 percent in family placement and 24 percent in non-family placement, exceeding the national average, according to the report.  That compares with 84 percent in family placement and 14 percent in non-family placement, nationally.  Only Colorado (35%), Rhode Island (28%) and West Virginia and Wyoming (27%), had a higher percentage of foster children than Connecticut in a non-family placement. states comparison

The state-by-state data from 2013, the most recent year available, shows use of group placements varies widely by state, ranging from 4 percent to 35 percent of children under the system’s care.  In Oregon, Kansas, Maine and Washington, only 4 to 5 percent of young people in out-of-home care are in group placements, the report points out.

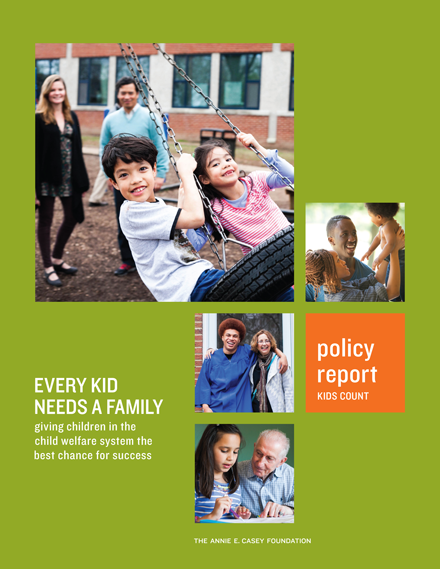
The Foundation’s policy report, Every Kid Needs A Family, highlights “the urgent need to ensure, through sound policies and proven practices, that everything possible is being done to find loving, nurturing and supported families to children in foster care.” The report highlights the promising ways that state and local government leaders as well as policymakers, judges and private providers can work together as they strive to help these 57,000 children who are living in group placements – and overall, the more than 400,000 children in the care of child welfare systems.

The report goes on to recommend how communities can widen the array of services available to help parents and children under stress within their own homes, so that children have a better chance of reuniting with their birth families and retaining bonds important to their development. And it shows ways in which residential treatment — a vital option for the small percentage of young people who cannot safely live in any family during treatment — can help those young people return to families more quickly and prepare them to thrive there.7 to 10 times

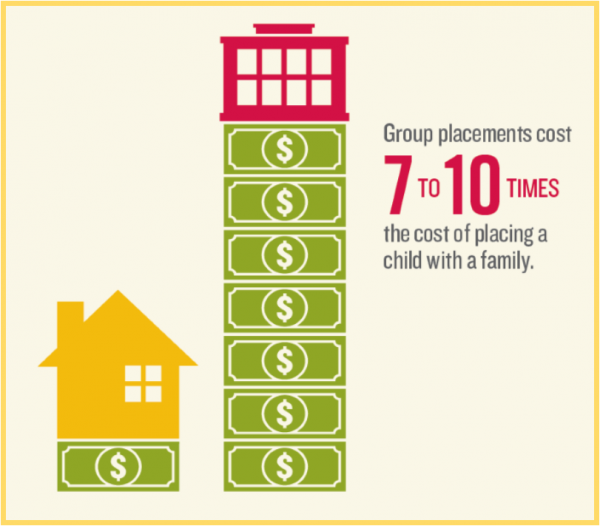
“We have an obligation to help all of our kids succeed,” said Patrick McCarthy, president and CEO of the Casey Foundation. “If our children couldn’t live with us, we would want them to live with someone close to us - and if that couldn’t happen, with a caring foster family who could provide them with as normal a life as possible during a turbulent time. This report shows more kids can live safely in families and get the nurturing they need while under the care and protection of our child welfare systems.”

Among the report’s findings across the United States:

  • One in 7 children under the care of child welfare systems live in group placements, even though federal law requires that they live in families whenever possible.
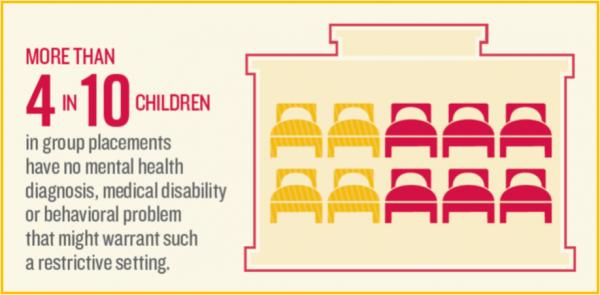
  • Fortaecf-everykidneedsafamily-cover-2015y percent of the children in group placements have no documented behavioral or medical need that would warrant placement in such a restrictive setting.
  • While research shows children who need residential treatment likely need to stay no longer than three to six months, young people are staying in group placements an average of eight months.
  • Group placements cost 7 to 10 times the cost of placing a child with a family.

The report also indicates that African American and Latino youth are more likely than white youth to be placed in group settings, and boys are more likely than girls to be in group placements.  Nationally, African American youth are 18 percent more likely than their white counterparts to be sent to group placements, and boys are 29 percent more likely than girls, according to data cited in the report.

4 in 10


Head Impacts in Lacrosse Subject of Closely Watched Study at Sacred Heart University

With heightened focus in recent years on the ramifications of concussions on the careers and lives of athletes – especially professional football players – research is gaining interest and attention in a range of contact sports. The recent release of the popular movie Concussion has pushed awareness and interest even further – along with the appetite for scientific research. In Connecticut, Sacred Heart University (SHU) is underway with poised to start the third year of a four-year study of the school’s men’s lacrosse team, which will be among the first comprehensive studies looking at head impact and concussions in the sport at the college level. U.S. Lacrosse, the sport’s governing body, provided the SHU athletic-training education program a $15,000 grant to study the effects of on-the-field head impacts. The 2016 season began on February 13 and runs through April 30.

The SHU study got underway in January 2014 and was initially focused on freshmen players.  It has continued to monitor the same athletes as they progress through their four-year lacrosse career.  The goal is to gain a better understanding of concussions in the sport and ultimately generate insights for safer play.

Theresa Miyashita, director and assistant professor for the athletic training education program, launched the accelerometer concussion study at the University. The research involves the use of accelerometers in the team’s helmets. These sensors detect the amount of impact (in Gs or standard gravity acceleration) a player receives when he gets hit by a ball, a stick, another player or hits the ground.

“We are one of the first in the country to embark on an accelerometer concussion study of this size in men’s lacrosse,” said Miyashita. “We are collaborating with Professor Michael Higgins at Towson University, who is conducting a similar study to compare impacts on different helmets (Cascade vs. Warrior). This research targets the fastest-growing team sport in America.”

The players have been wearing these sensors in their helmets for the entire season – both in practices and games. The information received from the sensors is then uploaded to see the number of impacts sustained, where the impacts were sustained and the amount of Gs each impact had. This data is then compared to a number of different variables such as neurocognitive function, modified IQ scores, depression/anxiety, alcohol/drug dependency screens and concussion injuries. The players were baseline tested and are given a post-test when each season is complete.LacrosseConcussionGrant675

The study is being done in partnership with a Canadian company, GForceTracker, which has developed “an advanced athlete monitoring system used to collect, measure, and analyze head impacts & biometric performance data, all in real time.” The company produces a “Hit Count® Certified, advanced linear g-force and rotational impact sensor monitoring system that accumulates a lifetime of head impacts.”

The detection device monitors, measures and provides vital statistics such as number of impacts, severity of impacts, local alarming when the impact exceeds an acceptable threshold and accumulates this data to provide key metrics that determine whether its user has suffered a possible head injury.  The GFT is currently the only Hit Count® Certified head impact sensor on the market, the company’s website indicates, “and can be used by individual players or entire teams in both helmeted and non-helmeted sports.”

“The men’s lacrosse team and their coach, John Basti, have been huge supporters and have been instrumental in getting this project running,” Miyashita said. “This project would not be possible without them and the rest of my research team.”shot

Miyashita’s team consists of Professor Eleni Diakogeorgiou; Kaitlyn Marrie, staff member for the athletic training program; Mary Jo Mason from the Health and Wellness Center, Professor Kelly Copperthite and a number of her athletic training students.  The Fairfield County Business Journal recently reported that Miyashita’s husband is a former professional player who is now assistant coach of the SHU men’s team.

Sacred Heart University, with a student population of 6,400, is the second-largest independent Catholic university in New England, offering more than 50 undergraduate, graduate and doctoral programs on its main campus in Fairfield.  The SHU Pioneers' men's lacrosse team competes in the Northeast Conference of the NCAA Division 1.

https://youtu.be/TewBxtexNjE

Motor Vehicle Deaths Up 14 Percent in CT in 2015, Exceeding National Average

The death toll in Connecticut from motor vehicle accidents increased 14 percent in 2015 from the previous year, consistent with a nationwide increase but higher than the national average.  The increase in Connecticut ranked the state tied for 14th in the percentage increase in motor vehicle deaths from 2014 to 2015. fatalities CT
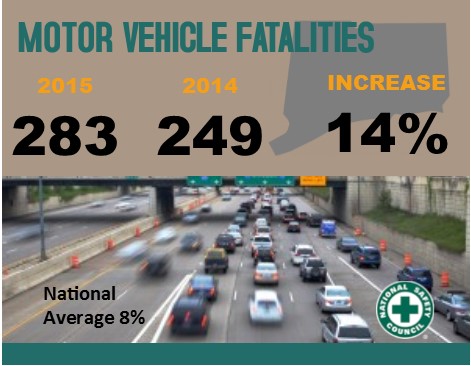
Nationally, 2015 saw the largest single-year percent increase in motor vehicle deaths since 1966. Estimates from the National Safety Council (NSC) show an 8 percent increase in 2015 compared with 2014 – with substantial changes in some states, including Connecticut.  There were 283 motor-vehicle related deaths in Connecticut last year, compared with 249 in 2014 and 276 in 2013.

While many factors likely contributed to the fatality increase, a stronger economy and lower unemployment rates are likely at the core of the trend.  The National Safety Council estimates 38,300 people were killed on U.S. roads, and 4.4 million were seriously injured, meaning 2015 likely was the deadliest driving year since 2008. The annual total of motor vehicle fatalities for 2014 was 35,398.

Over the last year at the state level, the National Safety Council estimates Vermont (30 percent), Oregon (27 percent), New Hampshire (24 percent), Georgia (22 percent), Washington (21 percent) and Florida (18 percent) experienced the largest percentage increase in fatalities, while only 13 states showed improvement. Among them were New Mexico (-20 percent), Kansas (-7 percent) and New Jersey (-2 percent).

Increases were also in Arizona (15%), Colorado (17%), Idaho (17%), Montana (17%), Maine (16%), Maryland (16%), and South Carolina (16%).  Also seeing 14 percent increases along with Connecticut were Arkansas, Minnesota, Missouri, and Nevada.  nsc_logo

“These numbers are serving notice: Americans take their safety on the roadways for granted,” said Deborah A.P. Hersman, president and CEO of the National Safety Council. “Driving a car is one of the riskiest activities any of us undertake in spite of decades of vehicle design improvements and traffic safety advancements. Engage your defensive driving skills and stay alert so we can reverse this trend in 2016.”

From 2013 and 2015, Connecticut had a 3 percent increase in traffic fatalities, according to the data.

The estimated cost of motor-vehicle deaths, injuries, and property damage in 2015 was $412.1 billion, according to NSC.  The costs include wage and productivity losses, medical expenses, administrative expenses, employer costs, and property damage.

The estimate is subject to slight increases or decreases as data mature, according to the National Safety Council. NSC has issued annual traffic fatality estimates since 1921. Over the last three years, preliminary estimates have fallen within 1 percent of final counts.

Average gas prices were 28 percent lower in 2015 than in 2014 and are projected to continue dropping this year, making driving more affordable for many Americans, NSC pointed out, noting that the U.S. Department of Transportation estimates a 3.5 percent increase in the number of miles driven in 2015 compared to 2014.

To help ensure motor vehicle accidentsafety, the National Safety Council recommends drivers:

  • Make sure every passenger buckles up on every trip
  • Designate an alcohol and drug-free driver or arrange alternate transportation
  • Get plenty of sleep and take regular breaks to avoid fatigue
  • Never use a cell phone behind the wheel, even hands-free
  • Stay engaged in teens’ driving habits, as teens are three times as likely to crash as more experienced drivers
  • Learn about vehicle safety systems and how to use them, including features such as adaptive cruise control, blind spot warning systems and backup cameras.

Founded in 1913 and chartered by Congress, the National Safety Council, nsc.org, is a nonprofit organization whose mission is to save lives by preventing injuries and deaths at work, in homes and communities, and on the road through leadership, research, education and advocacy.

Firsthand Accounts of Effects of Hunger in Connecticut On Display at State Capitol

Hunger in Connecticut is described as a pervasive problem: one in seven Connecticut residents struggle with hunger; 14.3 percent of Connecticut families do not have adequate resources to purchase enough food; 68 percent of Connecticut food pantry and soup kitchen clients at one point had to choose between food and medical care. Those stark statistics come alive through the firsthand accounts of individuals in Witnesses to Hunger CT, a photovoice exhibit showcasing firsthand accounts of hunger in Connecticut, which has opened in the lower level concourse of the Legislative Office Building in Hartford and will run through Thursday, February 11.stats

“Connecticut is one of the wealthiest states in the nation but there are many who struggle every day to put food on the table,” Lucy Nolan, Executive Director, End Hunger Connecticut!, said. “The Witnesses recruited to participate in this project have been faced with choices that are hard to fathom – whether to eat low cost foods that could be harmful to their medical conditions or not eat at all, whether to pay for prescriptions or put food on the table, and whether to feed themselves or give extra food to their children. We hope this exhibit can serve as a reminder that many among us, often hidden, need the state’s support.”

The 15 Witnesses to Hunger CT come from Connecticut’s cities, suburbs and rural communities. Kimberly’s picture told the story of her teenage son who while grateful to have something to eat wished there was meat on the plate. Randy from Westport had a good job until struck by cancer and now gets many meals from the soup kitchen and pantry. In his photo he holds a grocery bag in his hands and says while he is grateful for that safety net he wishes there were more fresh foods available. The photos tell a story of everyday choices that must be made to survive.

The project is a collaboration of Connecticut nonprofit organizations, anti-hunger and anti-poverty advocates, and state agencies inspired by Witnesses to Hunger, a project of the Center for Hunger Free Communities at the Drexel University Dornsife School of Public Health.  Advocates point out that limited access to food leads to poor health outcomes, including stress, obesity, and inability to succeed in work or school.hunger map

“There are four main themes that emerged from this project and tell me a compelling story,” said State Senator Marilyn Moore, Bridgeport. “The Witnesses to Hunger CT show everyday struggles with health and wellness, food and nutrition, transportation and adequate shelter. If we want people to succeed we need to make sure we support them. I appreciate their bravery in shining a light on these themes.”

Connecticut is the last in the nation for the number of schools with a school breakfast program, according to End Hunger Connecticut! officials. They point out that 64.6 percent of schools participate, and 45 percent students participate in free and reduced price breakfast for every 100 in lunch.  Connecticut would receive an additional $9.6 million federal dollars if the participation rate of school breakfast reached 70 percent.

Connecticut’s SNAP (formerly Food Stamps) participation rate is 72 percent and 53 percent of the eligible working poor participate in the SNAP program. Many go to food pantries instead for food, organization officials said. They indicated that for every $1 spent on WIC funding, Connecticut saves $1.77-$3.13 on future medical costs.

“The members of Witnesses to Hunger are the real experts on hunger and poverty,” said Dr. Mariana Chilton, an associate professor at Drexel University’s Dornsife School of Public Health and founder of Witnesses to Hunger. “Too many decisions today are made without consulting with the people that are affected most by policies made in Washington. We are thrilled to have families from Connecticut join in the national movement of families speaking from first hand experiences to inform policy makers and the public about the true realities of America’s struggles and how to solve them.”

They noted that 11.9 percent of Connecticut residents are food insecure and 4.7 percent are very food insecure — a slight increase from 2008.

“Data shows the food insecurity rate among those living with a severe mental illness is 475 percent higher than those who are not battling mental illness,” said Billy Bromhunger exhibitage, MSW, Director of Community Organizing, Yale Program for Recovery and Community Health. “We know that good nutrition plays a key role in mental health and that’s why the mental health community is here today to support the Witnesses.”

Witnesses to Hunger CT is the second exhibit of its kind in the state. The first took place in New Haven in 2014 and was championed by Congresswoman Rosa DeLauro.  Witnesses to Hunger CT is a collaboration of:  Advocacy Unlimited, Connecticut Association for Basic Human Needs (CABHN), Center for Hunger Free Communities at the Drexel University Dornsife School of Public Health, Connecticut State Department of Mental Health and Addiction Services (DMHAS), Connecticut Food Bank, End Hunger Connecticut!, Foodshare, Immanuel Congregational Church/UCC, Hispanic Health Council, New Haven Food Policy Council, and the Yale Program for Recovery and Community Health.

The exhibit will be in the lower concourse of the Legislative Office Building (LOB) through February 11th. A booklet prepared for the exhibit can be found at http://www.endhungerct.org. The LOB is located at 300 Capitol Avenue, Hartford and is open weekdays 8:00 am to 5:00 pm.  Free parking is available (first come first served) at the LOB Garage, which is located directly behind the LOB.

https://youtu.be/e-9M4byq90w


Eight CT Companies Among the Fastest Growing Tech Companies in North America

The Technology Fast 500 is a closely watched annual listing of the fast-growing tech companies, businesses that are releasing new, emerging technologies from the U.S. and Canada worldwide.  The latest ranking includes eight Connecticut companies, including one, operating in Stamford, that reached the top 100. Combining technological innovation, entrepreneurship, and rapid growth, Fast 500 companies—large and small, public and private—are located in cities all across North America and are “disrupting the technology industry,” according to consulting firm Deloitte, which has compiled the annual list for two decades.deloitte-technology-fast-500

Fast 500 award winners on the current list were selected based on percentage fiscal year revenue growth during the period from 2011 to 2014.  Companies must own proprietary intellectual property or technology that is sold to customers in products that contribute to a majority of the company’s operating revenues in order to be considered for inclusion on the list, according to Deloitte.

The lone Connecticut company to crack the top 100 was Milford medical device manufacturer SurgiQuest, which was number 100.  The company’s growth was pegged at 877 percent.  It was incorporated in 2006, with a focus on laproscopy technology.

Not far behind, at number 119, was Revolution Lighting Technologies, a manufacturer based in Stamford.  The analysis placed the company’s growth at 755 percent.  Revolution Lighting Technologies Inc. engages in the design, manufacture, marketing, and sale of light emitting diode (LED) lighting solutions in the United States, Canada, and internationally.  The company’s customers include the U.S. military.

SurgiQuest, Inc. Logo. (PRNewsFoto/SurgiQuest, Inc.)

Madison-based Clarity Software Solutions, Inc., with 298 percent growth, placed at number 247 on the top 500 fastest growing technology companies in North America.  Clarity Software Solutions, Inc. helps health insurance clients optimize customer relationships-and save time and money-by enhancing flexibility and control over document management and communications delivery, according to the company’s website.

newlogoAlso making the list were Evariant of Farmington, a software developer, at number 272, and HP One, a software company in Trumbull at number 307.  Biopharmaceutical company Alexion, in the midst of moving its headquarters from Cheshire to New Haven, was ranked at number 349, and etouches, a Norwalk software company ranked at number 357.  Rounding out the Connecticut companies on the list is Wallingford oil extraction technology company APS Tecnhology, at number 466.

“Amid a fierce business climate, there seems to be no shortage of new and established companies that are unlocking a seemingly unlimited potential for growth and advancement th20150320191512_Clarity_Logorough technology’s continued disruption and proliferation across industries,” said Sandra Shirai, principal, Deloitte Consulting LLP and US technology, media, and telecommunications leader.

“It is inspiring to witness the innovative ways companies are incorporating emerging technologies for business gains, be it cognitive computing, or the Internet of Things. We congratulate all those ranked on the Fast 500 and look forward to seeing their continued growth into 2016.”

Revolution Lighting Technologies ranked eighth among energy tech companies, and SurgiQuest Inc. ranked sixth among medical device companies.

Picture8Overall, 283 of the 500 companies were in the software sector, and 67 percent of the 500 companies have received venture capital funding at some point in their company’s history.  Topping the list was StartApp, with a growth rate of 21,984 percent from 2011 to 2014. Based in New York and founded in 2010, StartApp provides a free monetization and distribution platform that integrates with applications on mobile devices.

Two-thirds of the companies are private, and 33 percent are public.  The average growth rate of the top 500 companies was 850 percent, with individual company growth on the list ranging from 21,984 percent to 109 percent.  Broken down by region, 20 percent of the companies are based in the San Francisco Bay Area, 14 percent in the New York Metro Area, 7 percent in New England, and 6 percent in Los Angeles and Washington, D.C.

Connecticut Leads the Nation in Preventative Health Care

Among the nation’s 34 most populous states, the rate of preventive health care visits was higher in Connecticut than any state in the nation.  Data released this month from the Centers for Disease Control and Prevention National Center for Health Statistics also found that the rate of preventive care visits to primary care physicians, among the 34 most populous states, exceeded the national rate in Connecticut more than elsewhere. Preventive care visits such as general medical examinations, prenatal visits, and well-baby visits give physicians and other health professionals the opportunity to screen for diseases or conditions, as well as to promote healthy behaviors that may delay or prevent these conditions and reduce subsequent use of emergency or inpatient care.nchs_fb_identifier

In this report, the rate of preventive care visits to office-based physicians is examined by state, patient demographics, and physician specialty. Estimates are based on data from the National Ambulatory Medical Care Survey (NAMCS), a nationally representative survey of visits to office-based physicians.

Overall, preventive care visit rates were higher for children under age 18 years (73.2 per 100 persons) and for those aged 65 and over (81.1 per 100 persons) than for adults aged 18–44 (53.2 per 100 persons) and 45–64 (51.8 per 100 persons).  The preventive care visit rates for women aged 18–44 (87.1 per 100 women) and 45–64 (60.5 per 100 women) exceeded the rates for men in those age groups (18.5 and 42.5 per 100 men, respectively).

doctor
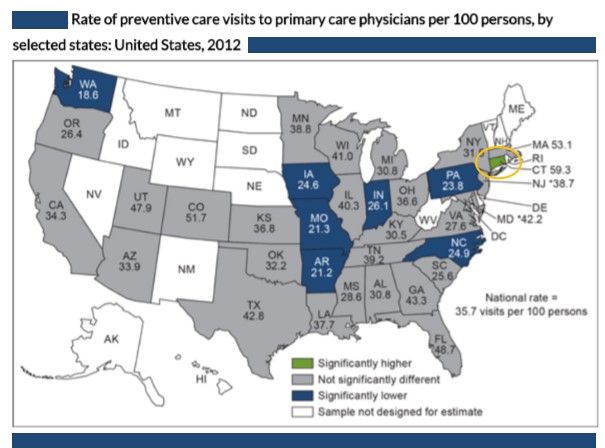
The rate of preventive care visits in the 34 most populous states ranged from 33.1 visits per 100 persons in Arkansas to 120 visits per 100 persons in Connecticut.  Among those 34 states, the rate of preventive care visits was lower than the national rate in 11 states (Arkansas, Indiana, Iowa, Michigan, Missouri, North Carolina, Oklahoma, Oregon, Pennsylvania, South Carolina, and Washington).  The national average was 61.4 visits per 100 persons.  The data is from 2012, the most recent year available from the National Ambulatory Medical Care Survey.

In 2012, 35.7 preventive care visits were made to primary care physicians for every 100 persons across the United States.  In Connecticut, primary care physician preventative care visits were made 59.3 times per 100 people, the highest percentage in the nation.  In Massachusetts, the rate was 53.1, in Colorado 51.7, in Florida 48.7 in Georgia 43.3, in Texas 42.8 and in Maryland 42.2.  Overall, 58.2 percent of preventive care visits were made to primary care physicians, according to the CDC data.  Primary care physicians include office-based physicians in the specialties of family or general medicine, internal medicine, and pediatrics.1u1-c15ecce858

The female rate (76.6 visits per 100 females) of preventative care visits exceeded the male rate (45.4 visits per 100 males) by 69 percent. The percentage of preventive care visits to primary care physicians, however, made by males (76.3%) exceeded those made by females (48.0%). The data suggests that women tend to make their preventative care visits to physicians other than their primary care physician, with the report’s summary suggestion. this “may be related to gynecological or obstetric care for women.”

In 2012, the NAMCS survey sample size was increased fivefold to allow for state-level estimates in the 34 most populous states for the first time.

preventative health map

Elder Abuse Prevention Recommendations Sent to State Legislature

Though precise definitions of elder abuse vary widely across jurisdictions, conceptually, elder abuse is any form of mistreatment that results in harm or loss to an older person. That, according to a report issued by Connecticut’s Legislative Commission on Aging, is at the core of a series of 15 recommendations being made to the state legislature and executive branch to respond to increasing concerns about the growing prevalence of elder abuse. The report explains that “it can be physical, financial, psychological, or include neglect or abandonment and it may take place in a home or institutional setting. Though often a hidden phenomenon, elder abuse is a significant human rights, public health and social justice issue that transcends race, ethnicity, religious affiliation, income and education levels.”report

Earlier this year, the legislature directed the Commission to conduct a study” concerning best practices for reporting and identification of the abuse, neglect, exploitation and abandonment of older adults.”  The report was submitted to the legislature, which convenes this week.

The Commission has also launched a new website focused on Financial Abuse & Exploitation, which includes a series video training videos and a range of resources.

Organized around the three areas of inquiry framed in Public Act 15-236, the report recommendations are:

To emulate national models for reporting abuse, neglect, exploitation or abandonment:

  1. Establish parameters for reasonable caseload standards for the Connecticut Department of Social Services Protective Services for the Elderly program (PSE);
  2. Establish an elder abuse resource prosecutor in the Office of the Chief State’s Attorney;
  3. Conduct a Connecticut-specific cost assessment to better understand the personal and state costs of financial exploitation; and
  4. Evaluate moving to an adult protective services model, for adults ages 18 and older, rather than a model only for adults ages 60 and older, balancing the import of retaining choice and control with ensuring that access to protective services is not restricted by age.

To advance standardization and uniformity in definitions, measurements and reporting mechanisms:

  1. Conduct a definitional crosswalk among and between state agencies and national guidelines and assess where legal, policy and practice changes can enhance alignment;
  2. Have Connecticut PSE develop a strategic plan to develop national voluntary consensus guidelines that have been developed nationally;
  3. Have Connecticut PSE modify its data collection process and explore predictive analytics modeling to improve outcomes and quality, to align with the dataset to be collected nationally, and to develop more targeted interventions; and in the interim, have PSE submit a more detailed report to the Connecticut General Assembly;
  4. Require Connecticut PSE to develop an online training module for mandated reports on the role of PSE, elder abuse red flags and reporting procedures to PSE; and
  5. Develop training and resources for law enforcement.

To promote and coordinate reporting communication among local and state government entities:

  1. Have Connecticut PSE formalize a system for consistent and uniform follow-up with all reporters of elder abuse;
  2. Enhance training for Connecticut PSE social workers and utilize consultants with specific subject matter expertise to provide guidance on investigation in certain highly specialized areas;
  3. Explore promising evidenced-based assessment tools and service models to make informed policy and practice decisions about how to direct and utilize limited resources on behalf of adults who need them most;
  4. Pursue federal funding for enhanced training and services to end abuse later in life program.
  5. Empower and support multidisciplinary teams (groups of regularly-meeting professionals to handle complex cases of elder abuse), as well as specialized teams such as financial abuse specialist teams, elder fatality review teams, and an elder abuse forensic center; and
  6. Support continued development of Connecticut’s criminal justice information system.

Connecticut’s Legislative Commission on Aging is a nonpartisan public policy and research office of the Connecticut General Assembly.  The report indicated that according to a study sponsored by the U.S. Department of Justice, 12.4 percent of adults age 60 and older reported at least one form of emotional, physical or sexual abuse or potential neglect and 11.7 percent reported financial exploitation by a family member or stranger.

Connecticut is the 7th oldest state in the nation, based on median age. It also has the third longest-lived constituency, with an average life expectancy of 80.8 years for residents born in Connecticut today. The report indicated that the “vast scope of elder abuse is especially concerning in light of the significant adverse health consequences for victims.”

More than one-third of Connecticut’s population is over the age of 50, and that proportion continues to rise. Between 2010 and 2040, Connecticut’s population of people age 65 and older is projected to grow by 57%, with less than 2% growth for people age 20 to 64 during the same period, according to the report.

https://youtu.be/b3Dr_sqJOYE

Caregiving Is Critical Issue as "Incredible Demographic Transformation" Continues, Aging Report Stresses

The United States continues to experience “incredible demographic transformation,” according to the Final Report of the White House Conference on Aging (WHCOA), a year-long, nationwide endeavor throughout 2015. In Connecticut, with the nation’s 7th oldest population, input was provided by legislative and executive branch agencies, which held hearings and offered expert testimony from organizations including AARP, the state Department on Aging, Legislative Committee on Aging and Commission on Aging. “No topic attracted more attention in the lead-up and follow-up to the 2015 WHCOA than caregiving. It echoed across all four of the conference issue areas,” the report indicated, referencing the four common themes that emerged as particularly important to older Americans: Retirement Security, Healthy Aging, Long-Term Services and Supports, and Elder Justice.cover  The final report noted the participation, at the Boston Regional Forum, of Connecticut’s Commissioner of the Department of Public Health, Jewel Mullen.

Among the findings in the report, issued by the White House, that will demand the attention of policy makers in the next decade:

  • Over 10,000 baby boomers are turning 65 every day, and the fastest growing demographic in the U.S. is women over age 85. The proportion of older adults representing racial and ethnic minorities is also increasing rapidly.
  • There is a need to break down the silos between housing, transportation, health care, and long-term services and supports in order to support healthy aging. The United States must also take advantage of an “increasing array of web-based technologies, robotics, and mobile devices” that “help older adults access the services they need, stay connected to family and friends, and remain active and independent.”
  • The majority of assistance for older Americans is generally provided at home by informal caregivers, especially family and friends, and are often the “primary lifeline, safety net, and support system for older adults.” Although rewarding, caregiving can be demanding, and “informal caregivers need to be supported and sustained with appropriate resources.”
  • With family structures changing as Americans are having fewer children and increasingly moving away from families of origin, the availability of family members to provide care is diminishing. “Direct care is a demanding profession with low wages, long hours, and limited benefits. It is critical for there to be efforts to recruit and retain a sufficient number of direct-care workers to keep pace with the growing need.”chart

The White House has held a Conference on Aging every decade, beginning in 1961, to identify and advance actions to improve the quality of life of older Americans. In 2015, the United States marked the 50th anniversaries of Medicare, Medicaid, and the Older Americans Act, as well as the 80th anniversary of Social Security. The White House Conference on Aging provided "an opportunity to recognize the importance of these key programs as well as to look ahead to the next decade."

At a public hearing in May at Connecticut's Legislative Office Building, state officials noted that Connecticut is undergoing a “permanent and historic transformation” in its demographics.  Statistics released as part of the WHCOA report echoed that observation.

65-600x249On July 13, 2015, President Obama hosted the sixth White House Conference on Aging, joining older Americans and their families, caregivers, and advocates at the White House and virtually through hundreds of watch parties across the country.

The July event built on a year-long dialogue; the White House Conference on Aging launched a website to share regular updates on its work and solicit public input; engaged with stakeholders in Washington, D.C. and listening sessions throughout the country; developed policy briefs on the emerging themes for the conference and invited public comment and input on them; and hosted regional forums with community leaders and older Americans in Tampa, Florida; Phoenix, Arizona; Seattle, Washington; Cleveland, Ohio; and Boston, Massachusetts.  Additional hearings, including those in Connecticut, were shared with conference officials.  Individuals and groups participated via live webcast in watch parties held in every State and were able to ask questions of panelists and others via Twitter and Facebook.

The Final Report, completed in late December and publicized by the White House this week, now goes to policy makers at the federal and state level to review findings and consider policy actions to respond the critical issues cited as requiring attention.

ph-whcoa-blog-collage


Average Age of Mothers Increasing in CT and Nationwide, Federal Data Reveals

First-time mothers are older than ever, new federal data has revealed.  Since 2000, the average mother’s age at the birth of her first child has increased in every state in the nation, rising 1.9 years or more in D.C., California, Oregon, and Utah, while increasing by less than a year in Connecticut, Michigan, New Hampshire, and West Virginia. Overall, the average age of mothers has increased from 2000 to 2014 for all birth orders, with age at first birth having the largest increase, up from 24.9 years old in 2000 to 26.3 years in 2014, according to newly released data compiled by the Centers for Disease Control and Prevention.  Connecticut is among a dozen states with the smallest increases in the average age of first-time mothers. graph

The federal agency points out that “a mother's age at birth, and particularly the average age when a mother has her first child, is of interest to researchers and the public. Mean age can affect the total number of births a mother has over a lifetime, which in turn impacts the composition and growth of the U.S. population. Age of mother is associated with a range of birth outcomes, such as multiple births and birth defects, the agency noted.

The largest factor in the rise a mother’s average age when her first child is born is the decline in the proportion of first births to mothers under age 20, down 42 percent from 2000 to 2014, or from approximately 1 in 4 births to 1 in 7.

Increases in the average age for all birth orders were most pronounced from 2009 to 2014, according to the data.  While the average age at the birth of a mother’s first child was fairly stable for the first half of this time period, greater increases were observed from 2009 (25.2 years) to 2014 (26.3 years).new mom

Increases from 2000 to 2014 in average age for higher birth orders were less than those for first births, rising 1.4 years for first births, 1.0 years for second births, 0.8 years for third- and fourth-order births, and 0.5 years for fifth- and higher-order births.  As a result of the different rate of increases by birth order, the gap in the average age between sequential birth orders is less than previously. For example, the difference in a mother’s average age at first birth compared with the mean age at second birth was 2.8 years in 2000 and fell to 2.4 years in 2014.

States with larger increases (1.7 years or more) in the average age at first birth tended to be in the western United States (California, Oregon, Washington, Utah, and Colorado), the data indicated. Greater increases were also seen in Illinois, Arkansas, and D.C.

map
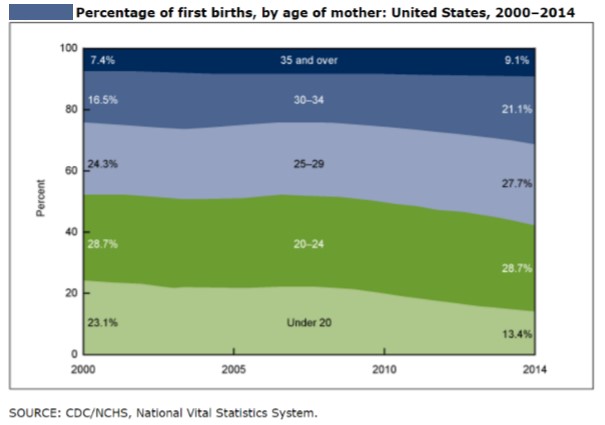
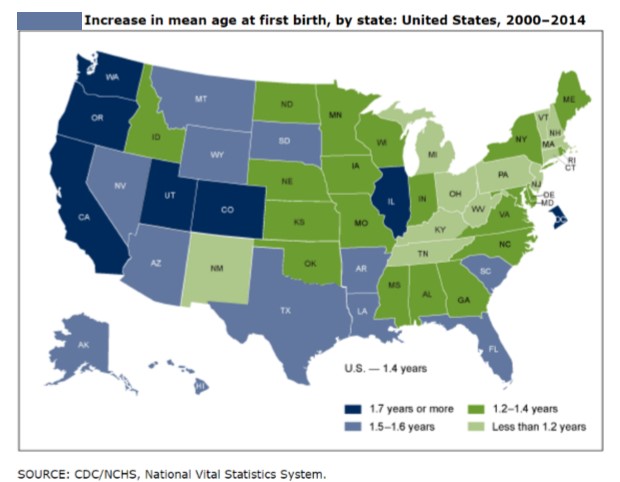
The report emphasized that over the past several decades, the United States continued to have a larger number of first births to older women along with fewer births to mothers under age 20. “This trend and the more recent uptick in delayed initial childbearing can affect the number of children a typical woman will have in her lifetime, family size, and for the overall population change in the United States,” the federal agency pointed out.

This report contains data from the birth data set, which is part of the National Vital Statistics System (NVSS). NVSS contains all live births reported in the United States. The birth data set is the primary data set for analyzing birth trends and patterns in the United States.


Background Checks Up 71 Percent in Past Five Years in CT, 12th Highest Increase in U.S.

Between 2010 and 2015, the number of background checks in Connecticut related to the purchase of firearms grew by 71.4 percent, ranking Connecticut 12th in the nation in the increase in background checks, according to data compiled by Bloomberg.  The number of background checks during the five-year period increased in every state in the nation, except Utah. In Connecticut in 2010, there were 179,595 background checks conducted as part of the process of purchasing  a firearm.  In 2015, that number had increased to 307,750 during the year, the data compiled by the National Instant Criminal Background Check System (NICS) revealed.gun stats graphic

The states with the largest increased in the number of background checks, from 2010 to 2015, were Indiana (211% increase), Delaware (162%), Alabama (139%), California (115%), District of Columbia (112.6%), Florida (105.1%), Wisconsin ((96.8%) Ohio (90.3%), Illinois (79.4%) and New Jersey (78.2%).

Overall, the largest number of background checks occurred in Kentucky, with 3.2 million.  California conducted 1.7 million, Texas 1.5 million, Illinois 1.2 million, and Wisconsin 1.1 million.

The Bloomberg news website ranked the 50 states and the District of Columbia by the percentage increase in number of NICS firearm background checks from January 1, 2010 through December 31, 2015. NICS is the National Instant Criminal Background Check System.background-check

In six jurisdictions – the states of Indiana, Delaware, California, Alabama, Florida and the District of Columbia – the number of federal firearm background checks more than doubled from 2010 to 2015.

Because of varying state laws and purchase scenarios, the statistics do not represent the number of firearms sold, the data analysis indicated.