Housing and Health - Foundations Fund Research in CT to Examine Relationship
/Housing and health are increasingly the focus of study, to better determine how one impacts and influences the other. Foundations at the state and national level are among those devoting resources in Connecticut to seek answers that can ultimately guide future public policy. With a $125,000 grant from the Connecticut Health Foundation, the Open Communities Alliance will work to create better links between housing and health care and set the stage for a two-year pilot program to enable interested families of children with acute asthma to move to healthier neighborhoods.
The “Healthy Housing Vouchers” project aims to use housing policy to improve health outcomes for low-income families and reduce health disparities, tying together clinical and nonclinical factors that affect people’s well-being. 
The Open Communities Alliance project will create a streamlined process for low-income families of children with asthma to help them access affordable housing in healthier communities if they choose. It will include referrals, counseling on the impact of environmental conditions on health, help identifying potential rental locations, and assistance with security deposits, moving expenses, and supportive services as they adapt to a new community. The initial participants in the pilot program will be low-income families who receive government-funded housing vouchers and have children with acute asthma.
The Connecticut Health Foundation will also be providing a $100,000 grant to support Connecticut Voices for Children’s work to promote policies that advance health equity for children and families. The work will include conducting policy research, producing educational materials and analyses to inform policymakers about issues affecting children and families, bringing together state agencies and advocates through the Covering Connecticut’s Kids and Families Coalition, and participating in state-run councils to represent research-based policy solutions.
These projects are among 11 awarded a total of $535,000 - announced this month - by the Connecticut Health Foundation, based in Hartford. It is the state’s largest independent health philanthropy dedicated to improving health outcomes for people of color.![]()
Earlier this year, the Connecticut Data Collaborative and the Liberal Arts Action Lab were awarded a 500 Cities Data Challenge grant by the Urban Institute and the Robert Wood Johnson Foundation. The joint proposal was one of 10 selected from a large competitive pool of applications submitted by organizations from cities across the United States.
The one-year $148,000 grant will support local research and educational outreach on housing conditions, health outcomes, and neighborhood disparities in the capital city of Hartford.
 The Connecticut Data Collaborative is a nonprofit organization focused on providing public access to data, creating an ecosystem of data users, and increasing data literacy. The Liberal Arts Action Lab, launched in early 2018 by Trinity College and Capital Community College, investigates problems posed by Hartford community partners, with teams of undergraduate students and faculty fellows who conduct semester-long research projects to strengthen the city.
The Urban Institute and the Robert Wood Johnson Foundation designed this challenge grant to encourage communities to delve into the 500 Cities open-access dataset, to design innovative solutions on social factors that influence health, and to guide local organizations on how to effectively use neighborhood-level data. The broader goal is to promote more comprehensive cross-collaborative approaches to foster a broader “Culture of Health” in urban areas.
 The model reflects that determinants of health directly influence health outcomes. A health outcomes category and four categories of health determinants are included in the model: behaviors, community & environment, policy and clinical care.


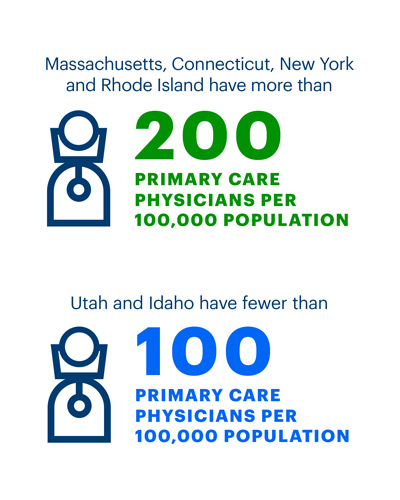
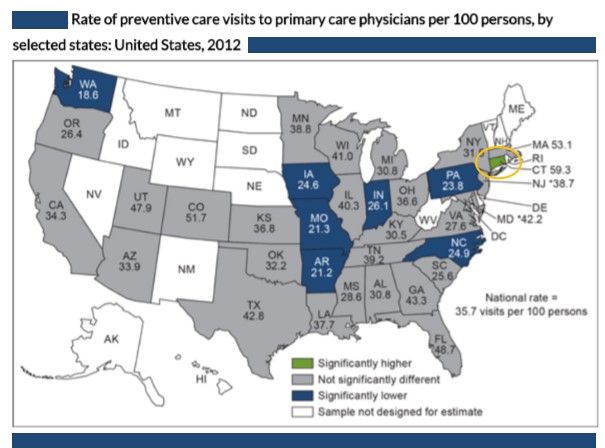
 The rate of preventive care visits in the 34 most populous states ranged from 33.1 visits per 100 persons in Arkansas to 120 visits per 100 persons in Connecticut. Among those 34 states, the rate of preventive care visits was lower than the national rate in 11 states (Arkansas, Indiana, Iowa, Michigan, Missouri, North Carolina, Oklahoma, Oregon, Pennsylvania, South Carolina, and Washington). The national average was 61.4 visits per 100 persons. The data is from 2012, the most recent year available from the National Ambulatory Medical Care Survey.
 e rankings is the Washington, D.C., metro area with a score of 77.3, followed by Minneapolis-St. Paul, Portland, Denver, San Francisco, San Jose, Seattle, San Diego, Boston Sacramento and Salt Lake City.
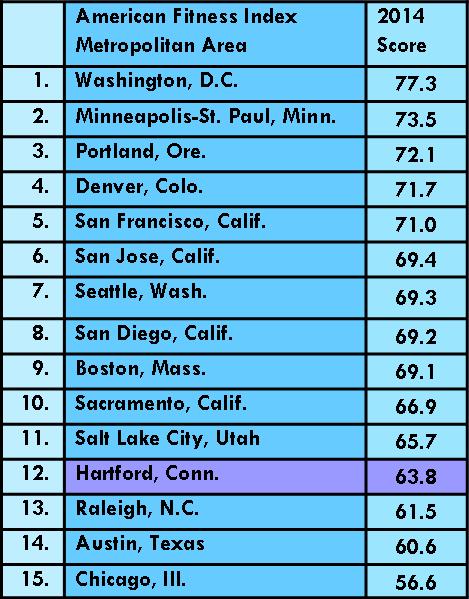 Hartford-East Hartford
 (CDC):