Women’s Economic Status in Connecticut Among Best in Nation, But Still Insufficient

Women are faring better in Connecticut than in most states in the nation, according to a new analysis that focused on data in two central areas of everyday life – Employment & Earnings and Poverty & Opportunity. Connecticut ranked 4th in the Employment and Earnings category, earning a B+, and 4th in the Poverty and Opportunity category, with a B- grade.

Status of Women in the States is a project of the Institute for Women’s Policy Research, a comprehensive project that presents and analyzes data for all 50 states and the District of Columbia. The Institute suggests that the data can be used “to raise awareness, improve policies, and promote women’s equality.”

Connecticut’s grade for women’s Employment & Earnings, B+, has improved since the 2004 Status of Women in the States report.  Its grade for women’s Poverty & Opportunity, B-, has dropped since 2004.

In the subcategories of Employment and Earnings, Connecticut ranked Connecticut ranked 2nd in median annual earnings for women employed full-time, 5th in the percent of all employed women in managerial or professional occupations, 13th in the percent of women in the labor force, and 38th in the earnings ratio between women and men employed full-time, year-round.

The Employment & Earnings Index measures states on women’s earnings, the gender wage gap, women’s labor force participation, and women’s representation in professional and managerial occupations. The top states were District of Columbia, Maryland, Massachusetts, Connecticut and New York.

Women working full-time, year-round have the highest earnings in the District of Columbia, where women’s median annual earnings are $65,000. Connecticut, Maryland, Massachusetts, and New Jersey are tied for second, with women in those states earning $50,000 at the median.

In the Poverty and Opportunity subcategories, Connecticut ranked 2nd in the percent of women age 18 and older above poverty, 5th in the percent of women age 25 and older with a Bachelor’s degree or higher, 10th in the percent of women age 18-64 with health insurance, and 29th in the percent of businesses owned by women.

New Hampshire, Connecticut, Maryland, and New Jersey have the highest rates of women living above poverty in the country at 89.2 percent, 88.4 percent, 88.1 percent, and 88.1 percent, respectively.

The report noted that women in Connecticut aged 16 and older who work full-time, year-round have median annual earnings of $50,000, which is 76.9 cents on the dollar compared with men who work full-time, year-round. Hispanic women earn just 47 cents for every dollar earned by White men, according to the report. According to the report’s analysis, if employed women in Connecticut were paid the same as comparable men, their poverty rate would be reduced by more than half and poverty among employed single mothers would be cut in half.

In Connecticut, 32.7 percent of businesses in 2012 were owned by women, up from 28.1 percent in 2007.  The report also indicates that 94.2 percent of Connecticut’s women aged 18 to 64 have health insurance coverage, which is above the national average for women of 89.4 percent.

The report, published in March 2018, concludes that “Women in Connecticut have made considerable advances in recent years but still face inequities that often prevent them from reaching their full potential.”

CT is 5th Healthiest State in USA; MA Ranks 1st, New Data Shows

Connecticut is the fifth healthiest state in the nation, dropping from third a year ago, but remaining in the nation’s top 10, where it has been every year since 1993. Massachusetts, Hawaii, Vermont, Utah and Connecticut rank as the five healthiest states, while West Virginia, Alabama, Arkansas, Louisiana and Mississippi rank the least healthy.

The United Health Foundation ranked America's states based on a variety of health factors, such as rates of infectious diseases, obesity, physical inactivity, smoking and infant mortality, as well as air pollution levels and the availability of health care providers. The survey has been conducted annually for 28 years.

America’s Health Rankings was built upon the World Health Organization definition of health:“Health is a state of complete physical, mental, and social well-being and not merely the absence of disease or infirmity.”

The model reflects that determinants of health directly influence health outcomes. A health outcomes category and four categories of health determinants are included in the model: behaviors, community & environment, policy and clinical care.

This is the first time Massachusetts has been named the healthiest state, ending Hawaii's five-year ranking at number one. Connecticut’s highest ranking was second, in both 2006 and 2008.

By category, Connecticut ranked fourth in Behaviors, fourth in Clinical Care, sixth in Policy, tenth in Health Outcomes and 15th in Community & Environment.  Connecticut had the third lowest levels of infectious disease, fourth lowest prevalence of smoking and ninth lowest levels of obesity.

The Bay State won the honor in part due to having the lowest percentage of uninsured residents at just 2.7% of the population, plus a low prevalence of obesity and a high number of mental health providers.  Rhode Island moved from 14th to 11th; New York from 13th to 10th

This latest report shows that the nation's health overall is getting worse.  The nation's premature death rate -- the number of years of potential life lost before age 75 -- increased 3% since 2015.  That increase is driven in part by drug deaths, which increased 7% during that time, and cardiovascular deaths, which went up 2%.  Overall, the United States ranks 27th in terms of life expectancy in a comparison of 35 countries, according to the report. Long-term challenges remain — including infant mortality and low birthweight. Cardiovascular deaths and drug deaths also increased.

Connecticut’s strengths, according to the report, include the state’s low prevalence of smoking, low violent crime rate and low percentage of uninsured people.  The state’s greatest challenges include a high drug death rate, high levels of air pollution and a large disparity in health status by educational attainment.

The report also identified the following highlights:

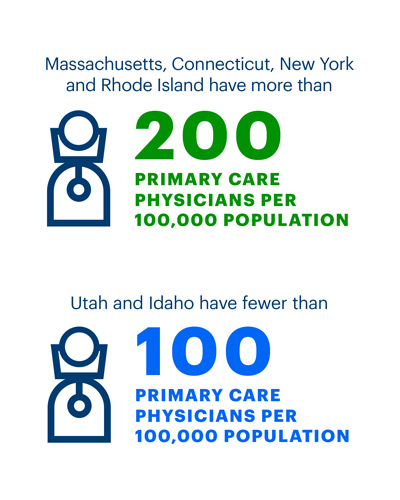
  • In the past year, primary care physicians increased 6%, from 197.8 to 209.4 per 100,000 population
  • In the past two years, children in poverty increased 33%, from 12.3% to 16.3% of children
  • In the past five years, cancer deaths decreased 3% ,from 179.0 to 173.7 deaths per 100,000 population
  • In the past three years, drug deaths increased 67%, from 11.0 to 18.4 deaths per 100,000 population
  • In the past five years, the percentage uninsured decreased 44%, from 9.9% to 5.5% of the population

Connecticut, Pakistan Have Similar Economic Output, Analysis Finds

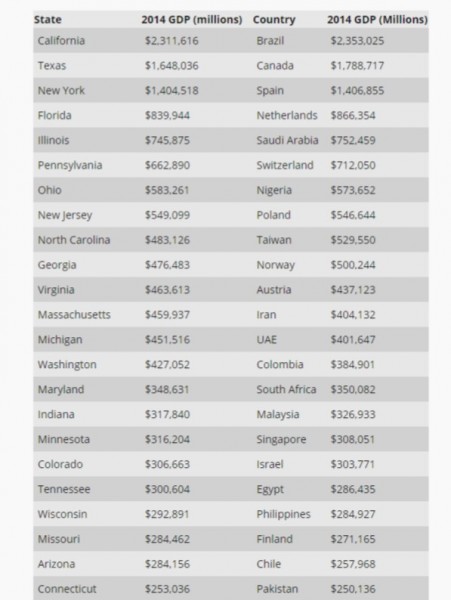
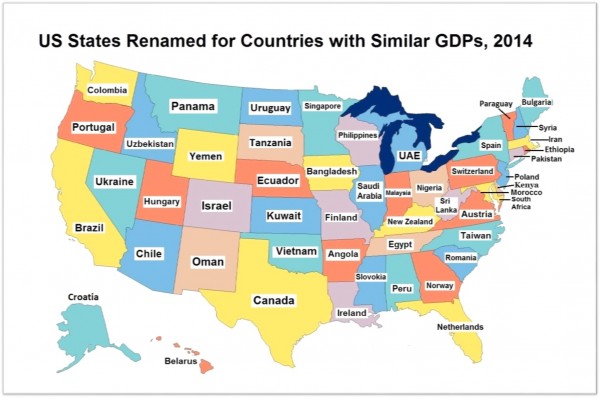
Connecticut is Pakistan. A review of state-by-state Gross Domestic Product (GDP) data for 2014 matches economic output in U.S. states to foreign countries with comparable nominal GDPs.  Connecticut’s GDP, which ranks 23rd among the states, is comparable to the nation of Pakistan – just over $250 billion.

The U.S. map, with names of nations with comparable GDP’s, “helps put America’s GDP of nearly $18 trillion in 2014 into perspective by comparing the GDP of US states to other country’s entire national GDP,” according to the American Enterprise Institute (AEI), which developed the comparative analysis.US map

Among the highlights, as described by AEI:

  1. America’s largest state economy is California, which produced $2.31 trillion of economic output in 2014, just slightly below Brazil’s GDP in the same year of $2.35 trillion. In 2014, California as a separate country would have been the 8th largest economy in the world, ahead of Italy ($2.1 trillion) and India ($2.04 trillion) and Russia ($1.86 trillion). And California’s population is only 38.8 million compared to Brazil’s population of 200.4 million, which means California produces the same economic output as Brazil with 81% fewer people.
  2. America’s second largest state economy – Texas – produced $1.65 trillion of economic output in 2014, placing it just slightly behind the world’s 11th largest country by GDP – Canada – with $1.78 trillion of economic output.
  3. Saudi Arabia’s GDP in 2014 at $752 billion was just slightly more than the state GDP of Illinois ($746 billion).
  4. America’s third largest state – New York with a GDP in 2013 of $1.4 trillion – produced the same amount of economic output last year as Spain ($1.4 trillion), even though Spain’s population of 47.3 million people is more than twice the number of people living in New York (19.75 million).
  5. Other comparisons: Florida ($840 billion) produced about the same GDP in 2014 as the Netherlands ($866 billion), Pennsylvania ($663 billion) produces almost as much as the entire country of Switzerland ($712 billion) and Ohio ($583 billion) produces more than the entire country of Nigeria ($573 billion).

Connecticut’s GDP of $253 billion is close to that of Pakistan, which was $250 billion in 2014.  Among the other New England states, Massachusetts had a GNP of $459 billion, slightly higher than that of Iran ($404 billion), New Hampshire’s GDP of $71 billion was comparable to Syria’s nearly $72 billion, and Rhode Island’s $54 billion GDP was similar to Ethiopia’s $52 billion.GDP chart

The comparison was developed by Mark J. Perry, concurrently a scholar at American Enterprise Institute and a professor of economics and finance at the University of Michigan's Flint campus. For each US state (and the District of Columbia), he determined the country closest in economic size in 2014 (measured by nominal GDP).  For each state, there was a country “with a pretty close match,” he found.

Overall, the analysis indicated, the US produced 22.5% of world GDP in 2014, with only about 4.6% of the world’s population. Three of America’s states (California, Texas and New York) – as separate countries – would rank in the world’s top 14 largest economies. And one of those states – California – produced more than $2 trillion in economic output in 2014 – and the other two (Texas and New York) produced more than $1.6 trillion and $1.4 trillion of GDP in 2014 respectively.


Connecticut Ranks #18 in Payroll to Population Ratio, Analysis Shows

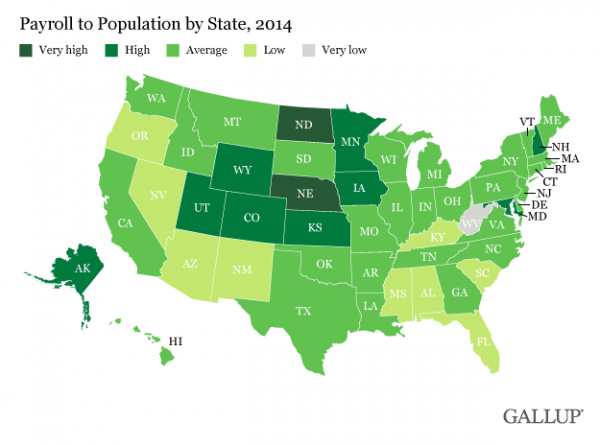
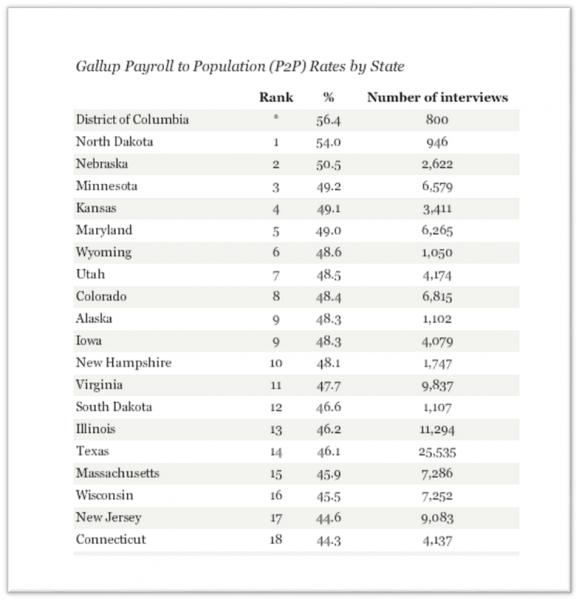
Connecticut ranks #18 in the nation in a measure of Payroll to Population (P2P), based on an analysis of the nation’s 50 states by the Gallup organization. The P2P metric tracks the percentage of the adult population aged 18 and older who are employed full-time for an employer, for at least 30 hours per week.  The rankings cover calendar year 2014. North Dakota (54 percent) had the nation’s highest Payroll to Population employment rate. A cluster of states in the northern Great Plains and Rocky Mountain regions -- including Nebraska, Minnesota, Kansas, Wyoming, Utah, Colorado and Iowa -- all made the top 10 on this measure, according to Gallup. West Virginia (35.6 percent) had the lowest P2P rate of all the states for the second consecutive year.

Connecticut was tied with Vermont with a P2P level of 44.3 percent.  Among the New England states, Connecticut and Vermont ranked in the middle, with New Hampshire ranked at #10, Massachusetts at #15, Maine at #22, and Rhode Island at #34.mpa

The year-long results are based on Gallup daily tracking interviews throughout 2014 with 353,736 U.S. adults. The payroll-employed data does not include adults who are self-employed, work fewer than 30 hours per week, who are unemployed, or are out of the workforce.

The differences in P2P rates across states may reflect several factors, Gallup points out, including the overall employment situation and the population's demographic composition. States with large older and retired populations, for example, can be expected to have a lower percentage of adults working full time. Connecticut has the 7th oldest population in the nation, which may influence the state’s overall ranking. The two states with the lowest P2P in 2014, West Virginia and Florida, have two of the largest proportions of residents aged 65 and older, at 17.3 percent and 16.9 percent, respectively.

Regardless of the underlying reasogallupn, Gallup indicates that the P2P rate provides “a good reflection of a state's economic vitality.”  Gallup also notes that P2P shows a stronger relationship than do unemployment rates with other important economic indicators, such as state GDP per capita.

In the overall rankings, Washington, D.C., had the highest P2P rate of any area in the country, at 56.4 percent, but Gallup points out that “it is unique in being the only entirely urban region in the survey, heavily dominated by the presence of the federal government, and with one of the lowest percentages of residents aged 65 and older (12.3 percent).”


CT's Population Remarkably Stable for a Century, Data Shows

Connecticut’s nickname as the Land of Steady Habits, is well-earned, as evidenced by a review of population origin during the past century.   Connecticut's domestic migration pattern has been remarkably steady through the decades, and most of the change has been due to immigration, according to data compiled by The New York Times. The hundred year comparison:  In 1900, 57 percent of the state’s residents were born in Connecticut.  A century later, in 2000, a nearly identical 55 percent of the state’s pCT bornopulation was born in Connecticut.

The percentage of Connecticut residents born outside the United States was as high as 29 percent in 1910, steadily declined to a low of 10 percent in 1970 and 9 percent in 1980 and 1990, and then began to slowly climb, reaching 11 percent in 2000 and 14 percent in 2012.

The breakdown of Connecticut’s population origins, between 1900 and 2012, as reported in The New York Times, is currently:

  • 55 percent born in Connecticut,
  • 14 percent born outside the U.S.
  • 10 percent born in New York,
  • 6 percent born in other states in the Northeast,
  • 4 percent born in Massachusetts,
  • 4 percent born in states in the South,
  • 3 percent born in other U.S. states (excluding the Northeast, South and Midwest),
  • 3 percent born in Midwest states,
  • 2 percent born in states in the Western U.S.

In 1900 and 2000, four percent of the state’s residents were born in neighboring Massachusetts.

By way of comparison, the percentage of Massachusetts’ population born in the Bay State was 55 percent in 1900 and 63 percent in 2012.  In New Hampshire the percentage of native born was 60 percent in 1900 and 42 percent in 2012 – when one quarter of the population, a robust 25 percent, were born in neighboring Massachusetts.  In Rhode Island, the population was 51 percent native born in 1900 and 57 percent in 2012.  Only 9 percent of Rhode Island’s recent population was born in Massachusetts.

The states with the lowest percentage of their population born in-state are Nevada, 25 percent; Florida, 36 percent; Arizona, 38 percent; Wyoming, 40 percent; and Alaska, 42 percent.

On the opposite end of the spectrum, 79 percent of Louisiana’s population was born in the state; 77 percent of Michigan’s; 75 percent of Ohio’s and 74 percent of Pennsylvania’s.

The largest immigrant population, by percentage?  California at 28 percent, New York at 25 percent, Florida at 23 percent and Nevada at 21 percent.

An interactive feature highlights the state-by-state data on the Times website.USA map

State Comparison Ranks Connecticut Students #4 in College Prep Test Results

Where have all the smart kids gone? Apparently, north. A state-by-state comparison map compiled by the website FindTheBest shows that when it comes to American students' standardized test scores, the North is dominating the South. And Connecticut is a top ten state, ranking at number 4.

The students with the best scores were in the states of New Hampshire, Minnesota and Massachusetts. Most of the New England states - except Maine and Rhode Island - reached the top ten.  New York was lower down the list, with a score in the 70's.  The lowest scores came out of Arkansas (60) and Mississippi (59).

To create the map, researchers looked at each state's scores for the SAT, ACT, AP and National Assessment of Educational Progress tests, using data from each state's department of education.  Each state was assigned a score based on the comparison, out of 100.

The top ranked states:

  1. New Hampshire 100states
  2. Massachusetts 98
  3. Minnesota 98
  4. Connecticut 96
  5. New Jersey 95
  6. Wisconsin 95
  7. Vermont 94
  8. North Dakota 92
  9. South Dakota 92
  10. Iowa 92
  11. Ohio 90
  12. Missouri 90
  13. Kansas 90
  14. Utah 89
  15. Pennsylvania 86
  16. Illinois 86


CT Among Leaders in Heart Health; States Vary Significantly Study Finds

If  heart health matters to you and you live in New England – especially Vermont or Connecticut - you’re in good company.  Americans’ cardiovascular health varies greatly from state to state, according to new research in the Journal of the American Heart Association (JAHA) - the first study to assess cardiovascular health at the state level. Among the findings:  people living in the New England states – including Connecticut – generally reported having among the highest percentage with “ideal cardiovascular health.”  Only the District of Columbia had better across-the-board numbers.  Among the findings:

  • The percentage of the population with ideal cardiovascular health varies from 1.2 in Oklahoma to 6.9 in Washington, D.C.
  • The percentage of the population reporting ideal cardiovascular health — defined as having optimal levels of all seven factors — was lowest in Oklahoma, West Virginia, and Mississippi.
  • Ideal cardiovascular health was highest in Washington, D.C. (6.9), Vermont (5.5), Connecticut (5.5), Virginia (5.0), Massachusetts (4.6), Maine (4.5), and New Hampshire (4.5).

Overall, in the nationwide study funded by the Centers for Disease Control 1112_AHA-ASA_Web-Header_630x270(CDC):

  • About 3 percent of the total U.S. population reported having ideal heart health.
  • About 10 percent of the total population reported having poor cardiovascular health, with two or less heart-health factors at optimal levels.

Researchers collected information on the American Heart Association’s seven major heart-health factors: blood pressure, total cholesterol, smoking, body mass index, diabetes, physical activity, and fruit and vegetable consumption. (used as a proxy measure in the study for a healthy diet.)

“Since the CDC is funding state heart disease and stroke prevention programs, we thought it would be helpful to have cardiovascular health information on the state level,” said Jing Fang, M.D., M.S., an epidemiologist with the CDC’s Division for Heart Disease and Stroke Prevention.  “Americans reported having on average more than four of the seven risk factors for heart disease,” Fang said. “We also found large disparities by age, sex, race/ethnicity and levels of education.”

Using 2009 data from the Behavioral Risk Factor Surveillance System – a telephone survey was conducted of more than 350,000 people in the 50 states and Washington, D.C. The report, in December 2012, could help state officials set goals to reduce risk of heart attack and stroke and improve cardiovascular health.

The American Heart Association goal is, by the year 2020, to improve the cardiovascular health of all Americans by 20 percent while reducing deaths from cardiovascular diseases and stroke by 20 percent.