Stamford Population Grows as Most Cities See Drop in Past Year

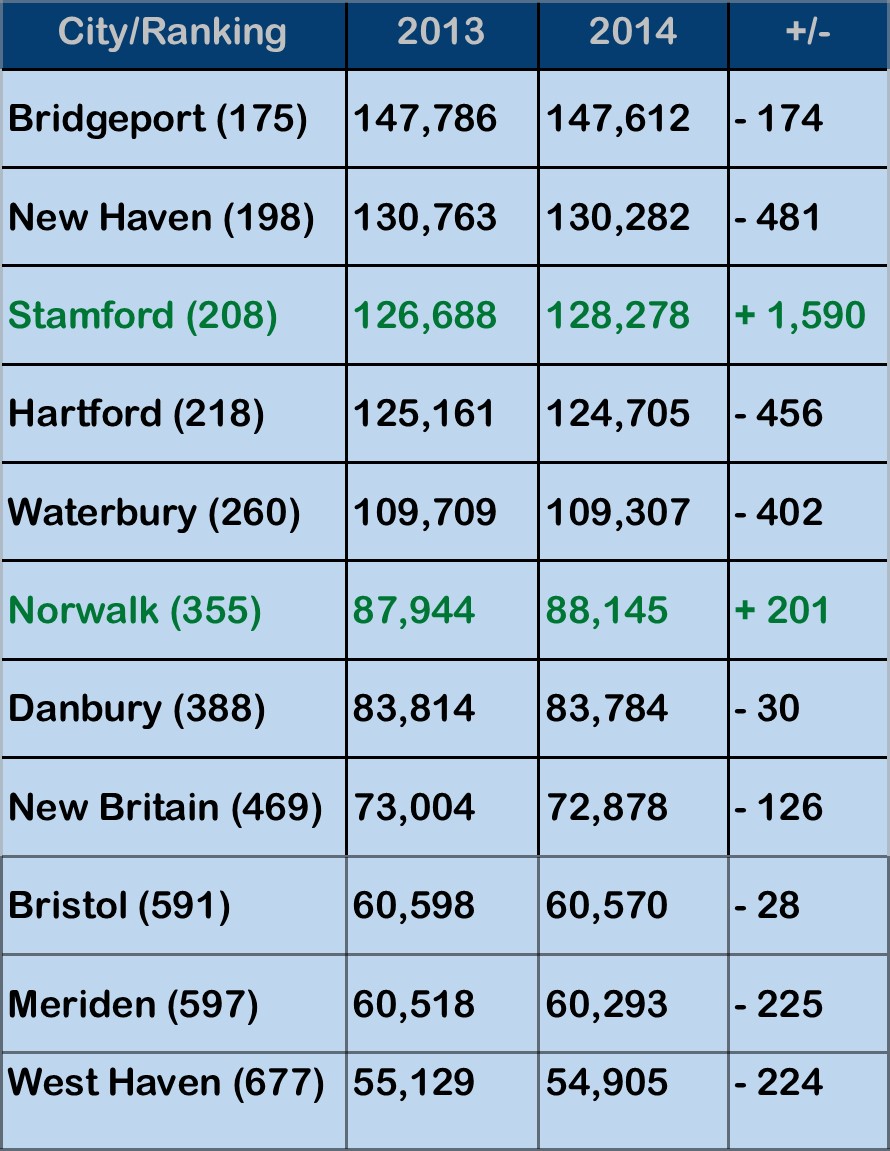
The growth in Connecticut’s population in recent years is largest in Stamford and across Fairfield County, and Stamford is gaining on New Haven, the state’s second largest city.  The U.S. Census Bureau has reported the municipalities in Connecticut that have experienced the largest increases in population last year, and over the past four years, revealing population declines in most of the state's largest cities during the past year. The municipality gaining the most people in Connecticut between July 1, 2013 and July 1, 2014, was Stamford, whose population rose by 1,590 over the period.  Stamford was followed by Stratford, with a population increase of 502, Darien (310), Fairfield (230) and East Lyme (222). Between 2013 and 2014, Bridgeport, New Haven, Hartford, Waterbury, Danbury, New Britain, Bristol, and Meriden  lost population while Stamford and Norwalk  experienced growth, among the state's largest cities.

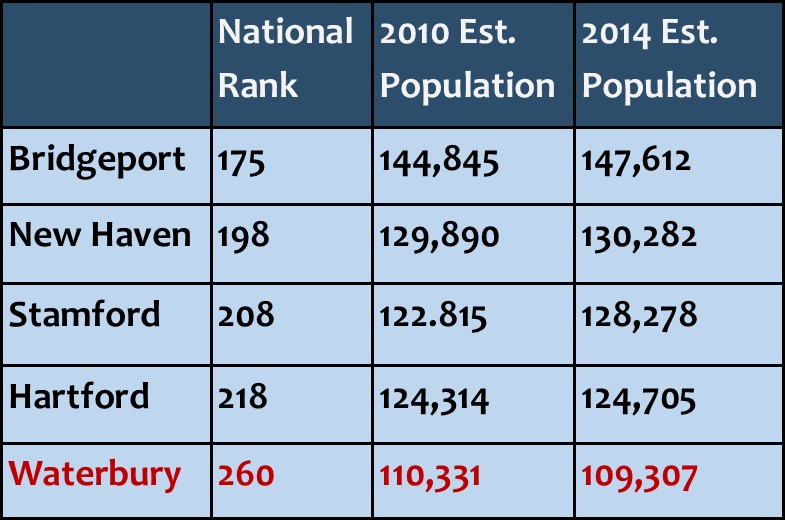
The estimated population in Stamford, the 208th largest city in the U.S., grew from 122,815 as of July 1, 2010 to 128,278 in 2014.  Bridgeport, ranked number 175 in the nation by population and Connecticut’s largest city, grew from an estimated 144,845 in 2010 to 147,612 in 2014, which was a slight drop of 174 residents, from 147,786 in 2013, according to the census estimate data.
cities CTOver the past four years, population also grew in Hartford, New Haven, Stamford, Danbury and Norwalk, but declined in some of the state’s other large municipalities, including Waterbury, New Britain, Meriden and West Haven.

In New Haven, the 198th largest city in the nation, the population increased from 129,890 in 2010 to 130,282 in 2014.  Connecticut’s Capitol City and the state’s 4th largest, Hartford, saw population grow narrowly from 124,314 in 2010 to 124,705 last year.  Hartford’s population is now ranked #218 in the nation.

As New Haven gained 392 residents during the past four years, Stamford gained 5,463, which narroPrintwed the gap between the two cities to 2,004.  Just four years ago, the population differential was 7,075.  Stamford passed Hartford to rank as the state’s third largest city three years ago.

Waterbury saw a population decline over the past four years, from 110,331 to 109,307.  The Brass City is the nation’s 260th most populous city.  Norwalk, the nation’s 355th largest city, saw population growth from 85,992 to 88,145 over the past four years, while Danbury, ranked number 388, experienced an increase in population, from 81,354 in 2010 to 83,784 in 2014.

New Britain, ranked number 469, also experienced a decline in population, from 73,240 to 72,878, populationaccording to the census data, while Bristol (number 591) saw a slight uptick of just under 100 residents, from 60,477 to a 60,570.  Meriden (number 597) saw population slip from 60,868 to 60,293.  West Haven, the 677th most populous city in the nation, also experienced a drop in populations, from 55,565 to 54,905.
The population estimates are based on annual population estimates since the 2010 Census and the data  includes annual estimates each July 1, through July 1, 2014.

San Jose, Calif., is now among the 10 U.S. cities with a population of 1 million or more, according to the new U.S. Census estimates.  California has three cities with 1 million or more people (Los Angeles, San Diego and San Jose), tying Texas (Houston, San Antonio and Dallas) for the lead among states.

New York remained the nation’s most populous city and gained 52,700 people during the year ending July 1, 2014, more than any other U.S. city.  Rounding out the top ten were Los Angeles, Chicago, Houston, Philadelphia, San Antonio, San Diego, Dallas and San Jose.  The other top 20 cities are Austin, Jacksonville, San Francisco, Indianapolis, Columbus, Fort Worth, Charlotte, Detroit, El Paso and Seattle.

The only change in the rank order of the 15 most populous cities between 2013 and 2014 was Jacksonville, Fla., and San Francisco, each moving up one spot to 12th and 13th place, respectively, passing Indianapolis, which fell from 12th to 14th.

For the first time since Hurricane Katrina struck in 2005, New Orleans (384,320) returns to the list of the 50 most-populous cities this year at number 50, with Arlington, Texas, dropping off the list.

Connecticut’s is the nation’s 29th most populous state, with the population in 2014 estimated by the U.S. Census at 3,596,677, an increase from 3,574,096 in 2010.  However, the state's population  last year was less than the previous year (3,599,341 in 2013), down by 2,664 statewide, according to the U.S. Census data.

Connecticut Ranks #18 in Payroll to Population Ratio, Analysis Shows

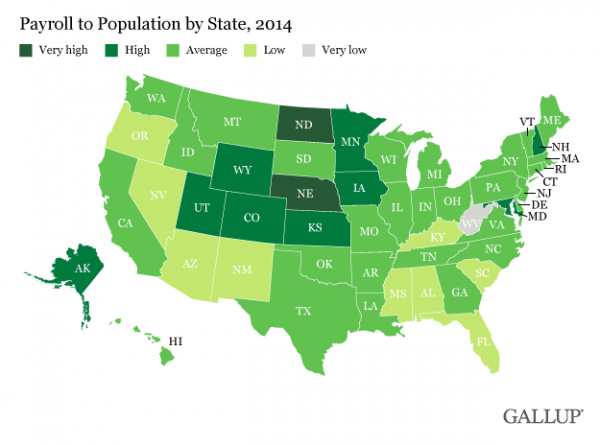
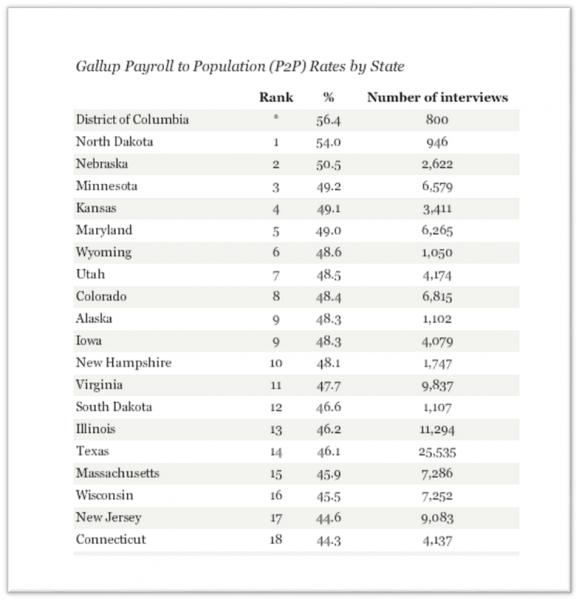
Connecticut ranks #18 in the nation in a measure of Payroll to Population (P2P), based on an analysis of the nation’s 50 states by the Gallup organization. The P2P metric tracks the percentage of the adult population aged 18 and older who are employed full-time for an employer, for at least 30 hours per week.  The rankings cover calendar year 2014. North Dakota (54 percent) had the nation’s highest Payroll to Population employment rate. A cluster of states in the northern Great Plains and Rocky Mountain regions -- including Nebraska, Minnesota, Kansas, Wyoming, Utah, Colorado and Iowa -- all made the top 10 on this measure, according to Gallup. West Virginia (35.6 percent) had the lowest P2P rate of all the states for the second consecutive year.

Connecticut was tied with Vermont with a P2P level of 44.3 percent.  Among the New England states, Connecticut and Vermont ranked in the middle, with New Hampshire ranked at #10, Massachusetts at #15, Maine at #22, and Rhode Island at #34.mpa

The year-long results are based on Gallup daily tracking interviews throughout 2014 with 353,736 U.S. adults. The payroll-employed data does not include adults who are self-employed, work fewer than 30 hours per week, who are unemployed, or are out of the workforce.

The differences in P2P rates across states may reflect several factors, Gallup points out, including the overall employment situation and the population's demographic composition. States with large older and retired populations, for example, can be expected to have a lower percentage of adults working full time. Connecticut has the 7th oldest population in the nation, which may influence the state’s overall ranking. The two states with the lowest P2P in 2014, West Virginia and Florida, have two of the largest proportions of residents aged 65 and older, at 17.3 percent and 16.9 percent, respectively.

Regardless of the underlying reasogallupn, Gallup indicates that the P2P rate provides “a good reflection of a state's economic vitality.”  Gallup also notes that P2P shows a stronger relationship than do unemployment rates with other important economic indicators, such as state GDP per capita.

In the overall rankings, Washington, D.C., had the highest P2P rate of any area in the country, at 56.4 percent, but Gallup points out that “it is unique in being the only entirely urban region in the survey, heavily dominated by the presence of the federal government, and with one of the lowest percentages of residents aged 65 and older (12.3 percent).”


International Migration Growth Keeping Population Numbers Steady

The Hartford region ranked third in the nation among metropolitan areas showing significant international migration amidst near-stagnant overall population change during the past three years.  The New Haven-Milford and Norwich-New London regions also ranked in the top 20 nationally among metro regions with less than one percent overall population growth but strong international migration.

The overall population change for the three metro areas in Connecticut were two-tenths of a percent population growth in the Hartford region, and virtually no change at all for New Haven and Norwich-New London region, each having zero percent population growth over the past three years.

The migration into the Hartford region from outside the U.S. during the three years was 16,251 people, behind only to Chicago and Detroit among the 20 metro areas where overall population change was at or near zero.  The New Haven metro area ranked 7th, with an international migration total of 10,717 and Norwich – New London was 19th, with 4,008.

During the past three years, the Norwicworld-map-background1h-New London region total population change reflected a net loss of 95 people, New Haven had a net loss of 187 people and Hartford region saw a slight increase of 2, 827 people.migration

The analysis of U.S. Census data by Governing magazine indicates that in some American cities, international migration far outpaced population gains from natural change (births and deaths) and domestic migration.  The three Connecticut metropolitan areas were among those that experienced little to no change in total population, but welcomed sizable tallies of residents from abroad.

The analysis indicated 20 metro areas across the country where total population change between 2010 and 2013 was at or near zero, while international migration was substantial – and made up, or nearly made up, for population declines to due domestic migration or natural factors. Among the other metro regions were Providence, St. Louis, Cleveland, Springfield, Pittsburgh, Rochester, Buffalo and Trenton.

Across the U.S. between 2010 and 2013, metro areas welcomed a net total of 2.6 million residents from international migration. Over the same three-year period, net domestic migration increased by just 382,000 as those who did move mostly relocated to other metro areas, the magazine reported.

The Census Bureau’s international migration estimates include not only foreign immigrants, but natives moving back home and movement of members of the military.

The country’s largest immigration hubs welcomed significant numbers of residents from abroad. Since 2010, the New York City-Newark metro area gained nearly 400,000 residents from other countries, followed by the Miami-Fort Lauderdale-West Palm Beach, Fla., area (+164,000) and the Los Angeles-Long Beach-Anaheim (+156,000) area.

According to the data, Hartford lost 18,917 people to domestic migration while it picked up 16,251 people through international migration, nearly off-setting the departing over the past three years.

Connecticut Ranked 45th in Population Growth Last Year; Births Outpaced Deaths, Net Loss from Migration

Connecticut’s population is estimated to have increased by 4,315 people during the past year, ranking the state 45th in the nation in population growth , according to the U.S. Census Bureau's population estimates program.

Only New Hampshire, New Mexico, Rhode Island, and Vermont added fewer residents.  Maine and West Virginia were the only states in the U.S. to lose population, by 199 and 2,376 respectively.  Connecticut’s population drop was one-tenth of one percent.

The largest overall population gain occurred in North Dakota (3.1 percent), the District of Columbia (2.1 percent), Utah (1.6 percent), Colorado and Texas (each 1.5 percent).

The data indicate that Connecticut ranked 44th in net domestic migration, losing 17,224 residents in 2013.  States losing more residents included, Ohio, Michigan, Pennsylvania, New Jersey, California, Illinois, and New York.  On the opposite end of the spectrum, the states achieving the largest net domestic migration were Texas (113,528), Florida (91,484), North Carolina (37,240), Colorado (36,284), South Carolina (29,324) aCensus Bureau Logond Arizona (26,417).

The numbers for international migration tell a different story.  California topped the list with a net gain of 123,217, followed by New York (101,778), Florida (99,454), Texas (64,187) and New Jersey (64,197).  Connecticut was just above the middle of the pack, with a net international migration gain of 15,702, ranking sixteenth.  Considering both domestic and international migration, Connecticut's net loss from migration was 2,076 people.

Connecticut saw 37,172 births and 29,249 deaths during the year, ranking the state 34th in births but 29th in the number of deaths.

The Census Bureau computes state population estimates using multiple data sets. Population estimates by state, current as of July of each year, include birth rates, death rates and estimates of residents migrating from one state to another, Governing magazine reported.

Connecticut’s population is estimated at 3,596,080, according to the U.S. Census.

Connecticut Ranks #42 in Population Gain Between 2010 and 2013; New England Lags Nation

Connecticut’s population grew six-tenths of one percent between 2010 and 2013 according to estimates by the U.S. Census Bureau, ranking the state 42nd among the nation’s 50 states in population growth.  The state population, which was 3, 574,097 at the 2010 U.S. Census was estimated at 3,596,080 as of the official July 2013 estimate, announced at year’s end.

The 2013 estimates also show the nation's population grew by 2.4 percent in the three years since the 2010 Census, with the South and the West leading the expansion. The total for the 50 states, the District of Columbia and Puerto Rico rose from 308,745,538 in 2010 to an estimated 316,128,839 in July 2population graphic013.  Only Rhode Island lost population (1,056 people) during the period, and the Southern and Western states accounted for more than 80 percent of the growth nationwide.

The bottom twelve states in population growth – all under one percent - include five from New England:  Rhode Island, Maine, Vermont, New Hampshire and Connecticut.  The remainder are in the Mid-West.  Massachusetts population grew by 2.2 percent, New Jersey by 1.2 percent, and New York by 1.4 percent.

The South, the nation's largest population center, also had the highest percentage-point growth at 3.3 percent: CT populationfrom 114,555,744 in 2010 to an estimated 118,383,453 in 2013. The West was close behind, with a 3.2 percentage-point growth during the period, from 71,945,553 in the 2010 Census to an estimated 74,254,423 in July 2013.

The Midwest region had the smallest growth, at 0.9 percent: 66,927,001 people in 2010 to 67,547,890 in 2013, according to published reports. The population growth for the Northeast was 1.1 percent between 2010 and 2013, growing from 55,317,240 in 2010 to 55,943,073, according to the census estimates.

The bottom twelve, including Connecticut, saw increases of less than one percent, including Rhode Island’s drop in population, and Maine standing essentially even, adding less than 1,000 people.

  • Rhode Island -0.1people
  • Maine   0.0
  • Michigan 0.1
  • Vermont 0.1
  • West Virginia 0.1
  • Ohio 0.3
  • Illinois   0.4
  • New Hampshire 0.5
  • Connecticut 0.6
  • Pennsylvania 0.6
  • Mississippi 0.8
  • Missouri 0.9

The new figures from the Census Bureau shows Massachusetts is continuing to add to its population. The latest estimate as of July 1 puts the state's population at nearly 6.7 million, up by more than 47,000 from July, 2012.  Massachusetts' ranking is the 14th most populous state in the country.

New York remains the third most populous state in the nation -- behind California and Texas -- but the state's lead over fourth-place Florida continues to erode, according to 2013 population estimates. New York saw an increase of 1.4 percent from 19,378,102 people in the 2010 Census to 19,651,127 in the 2013 estimate, according to the bureau.

Florida's population in the 2010 Census was 18,801,310, about 576,000 fewer than New York's 2010 Census population. However, Florida's population rose an estimated 4 percent between 2010 and 2013, to 19,552,860 -- about 98,000 fewer than New York's 2013 population estimate.  Some have projected that Florida will overtake New York in population next year.

North Dakota, with its expanding oil and gas industry, led the growth chart between 2010 and 2013, at a 7.6 percent clip, including a 3.1 percent population increase in just the past year.

For the 12 months ending July 1, 2013, population growth nationwide was 0.71%, or just under 2.3 million people. That's the slowest since 1937, USA Today reported.  An aging Baby Boomer population and slower immigration combined for what the newspaper described as “nearly stagnant U.S. population growth,” the slowest pace since the Great Depression.

Maine and West Virginia were the only two states to lose population between 2012 and 2013.  The Census Bureau estimates that Connecticut picked up 4,315 residents in that 12-month period.

Credit Card Debt Increases Among Older Residents

As Connecticut struggles to lift itself from a nagging recession and rebuild a shaky economy and grow jobs, new national data suggest that economic realities plus an aging population are combining to increase the credit card debt among a significant segment of the population. It has been estimated that the state's 65+ population would increase by 69 percent between 2000 and 2030. Middle-income Americans age 50 and older are carrying more credit card debt on average than younger people, according to a National Survey on Credit Card Debt of Low- and Middle-Income Households, released last month by Demos, a national policy think tank and AARP’s Public Policy Institute.

The results of the 2012 survey are a reversal of findings from a survey conducted by Demos in 2008.  It reveals a troubling picture of middle-income 50+ households carrying card debt near or in their retirement years.

The report shows that nationwide, older households carried an average credit card balance of $8,278 in 2012. For those underlogo 50, credit card debt averaged $6,258. Other key findings for middle-income households that carried credit card debt for three months or more:

  • A third of older households used credit cards to pay for basic living expenses such as rent, mortgage payments, groceries, or utilities.
  • Half of Americans age 50+ carried medical expenses on their credit cards. Prescription drugs and dental expenses were the main contributors.
  • A quarter of older households said loss of a job contributed to their credit card debt in the last three years.
  • Nearly one in five (18 percent) older Americans nearing retirement said they dipped into retirement funds to pay down credit card debt.chart
  • Older Americans were twice as likely as those under age 50 to take on credit card debt to assist other family members (23 percent vs. 11 percent).

This report suggests that credit card debt among older Americans is primarily a reflection of difficult economic times, not a lack of personal financial responsibility.  State-by-state data was not available.

The findings may help to explain the economic challenges facing Connecticut’s citizenry, which is on track to becoming one of the oldest among the states, expected to grow from 470,183 (13.8% of the total state population) in 2000 to 794,405 in 2030, constituting 21.5% of the projected total state population.


Population Growth Through 2025 Driven by New Haven, Hartford, Fairfield Counties

Connecticut’s population, which was just under 3.3 million in 1990 and just over 3.5 million two decades later, is projected to exceed 3.7 million by 2025, according to Connecticut Population Projections featured on the University of Connecticut’s Connecticut State Data Center website.CT Map The interactive site provides a breakdown of projections for each of the state’s eight counties – and all are expected to grow during the next dozen years.  The most dramatic growth is anticipated in New Haven County, which is seen to exceed 900,000 residents for the first time by 2025.  The state population is predicted to increase by slightly more than 100,000 residents between 2015 and 2025.

Overall, the state’s population is expected to reach 3.66 million by 2015 and grow to 3.74 million by 2025.  Litchfield County will likely see the slowest growth, with less than an additional 1,000 residents anticipated over the decade.  Middlesex County is expected to grow by about 2,000 residents; Tolland County by nearly 5,000.  Windham County is expected to grow at twice the rate of New London County, as both are anticipating adding between 6,000 and 7,000 residents, although New London County has more than twice the population.

Here’s the breakdown by county of the projections:

County                   2015                       2025                       Projected growth

Fairfield                 932,378                 954,479                 22,101

Hartford                 910,921                 936,811                 25,890

New Haven            881,371                 912,057                 30,686

New London         279,756                 285,773                 6,017

Litchfield               192,189                 193,113                  924

Middlesex             168,834                 170,976                  2,142

Tolland                   155,924                 160,760                  4,836

Windham               122,719                 129,526                   6,807

Connecticut          3,644,546              3,746,184              101,638

The ranking of the state’s eight counties by population is not expected to change:  Fairfield, Hartford, New Haven, New London, Litchfield, Middlesex, Tolland, and Windham.

The Connecticut State Data Center provides population projections to assist state agencies, non-profit organizations, businesses, governments, and centers/organizations to identify potential population changes into the future. These projections are created based upon several datasets and while these estimates are developed based on multiple data sources, actual population changes may vary from these projections.

Moving Vans Heading Outbound, Beyond Connecticut’s Borders

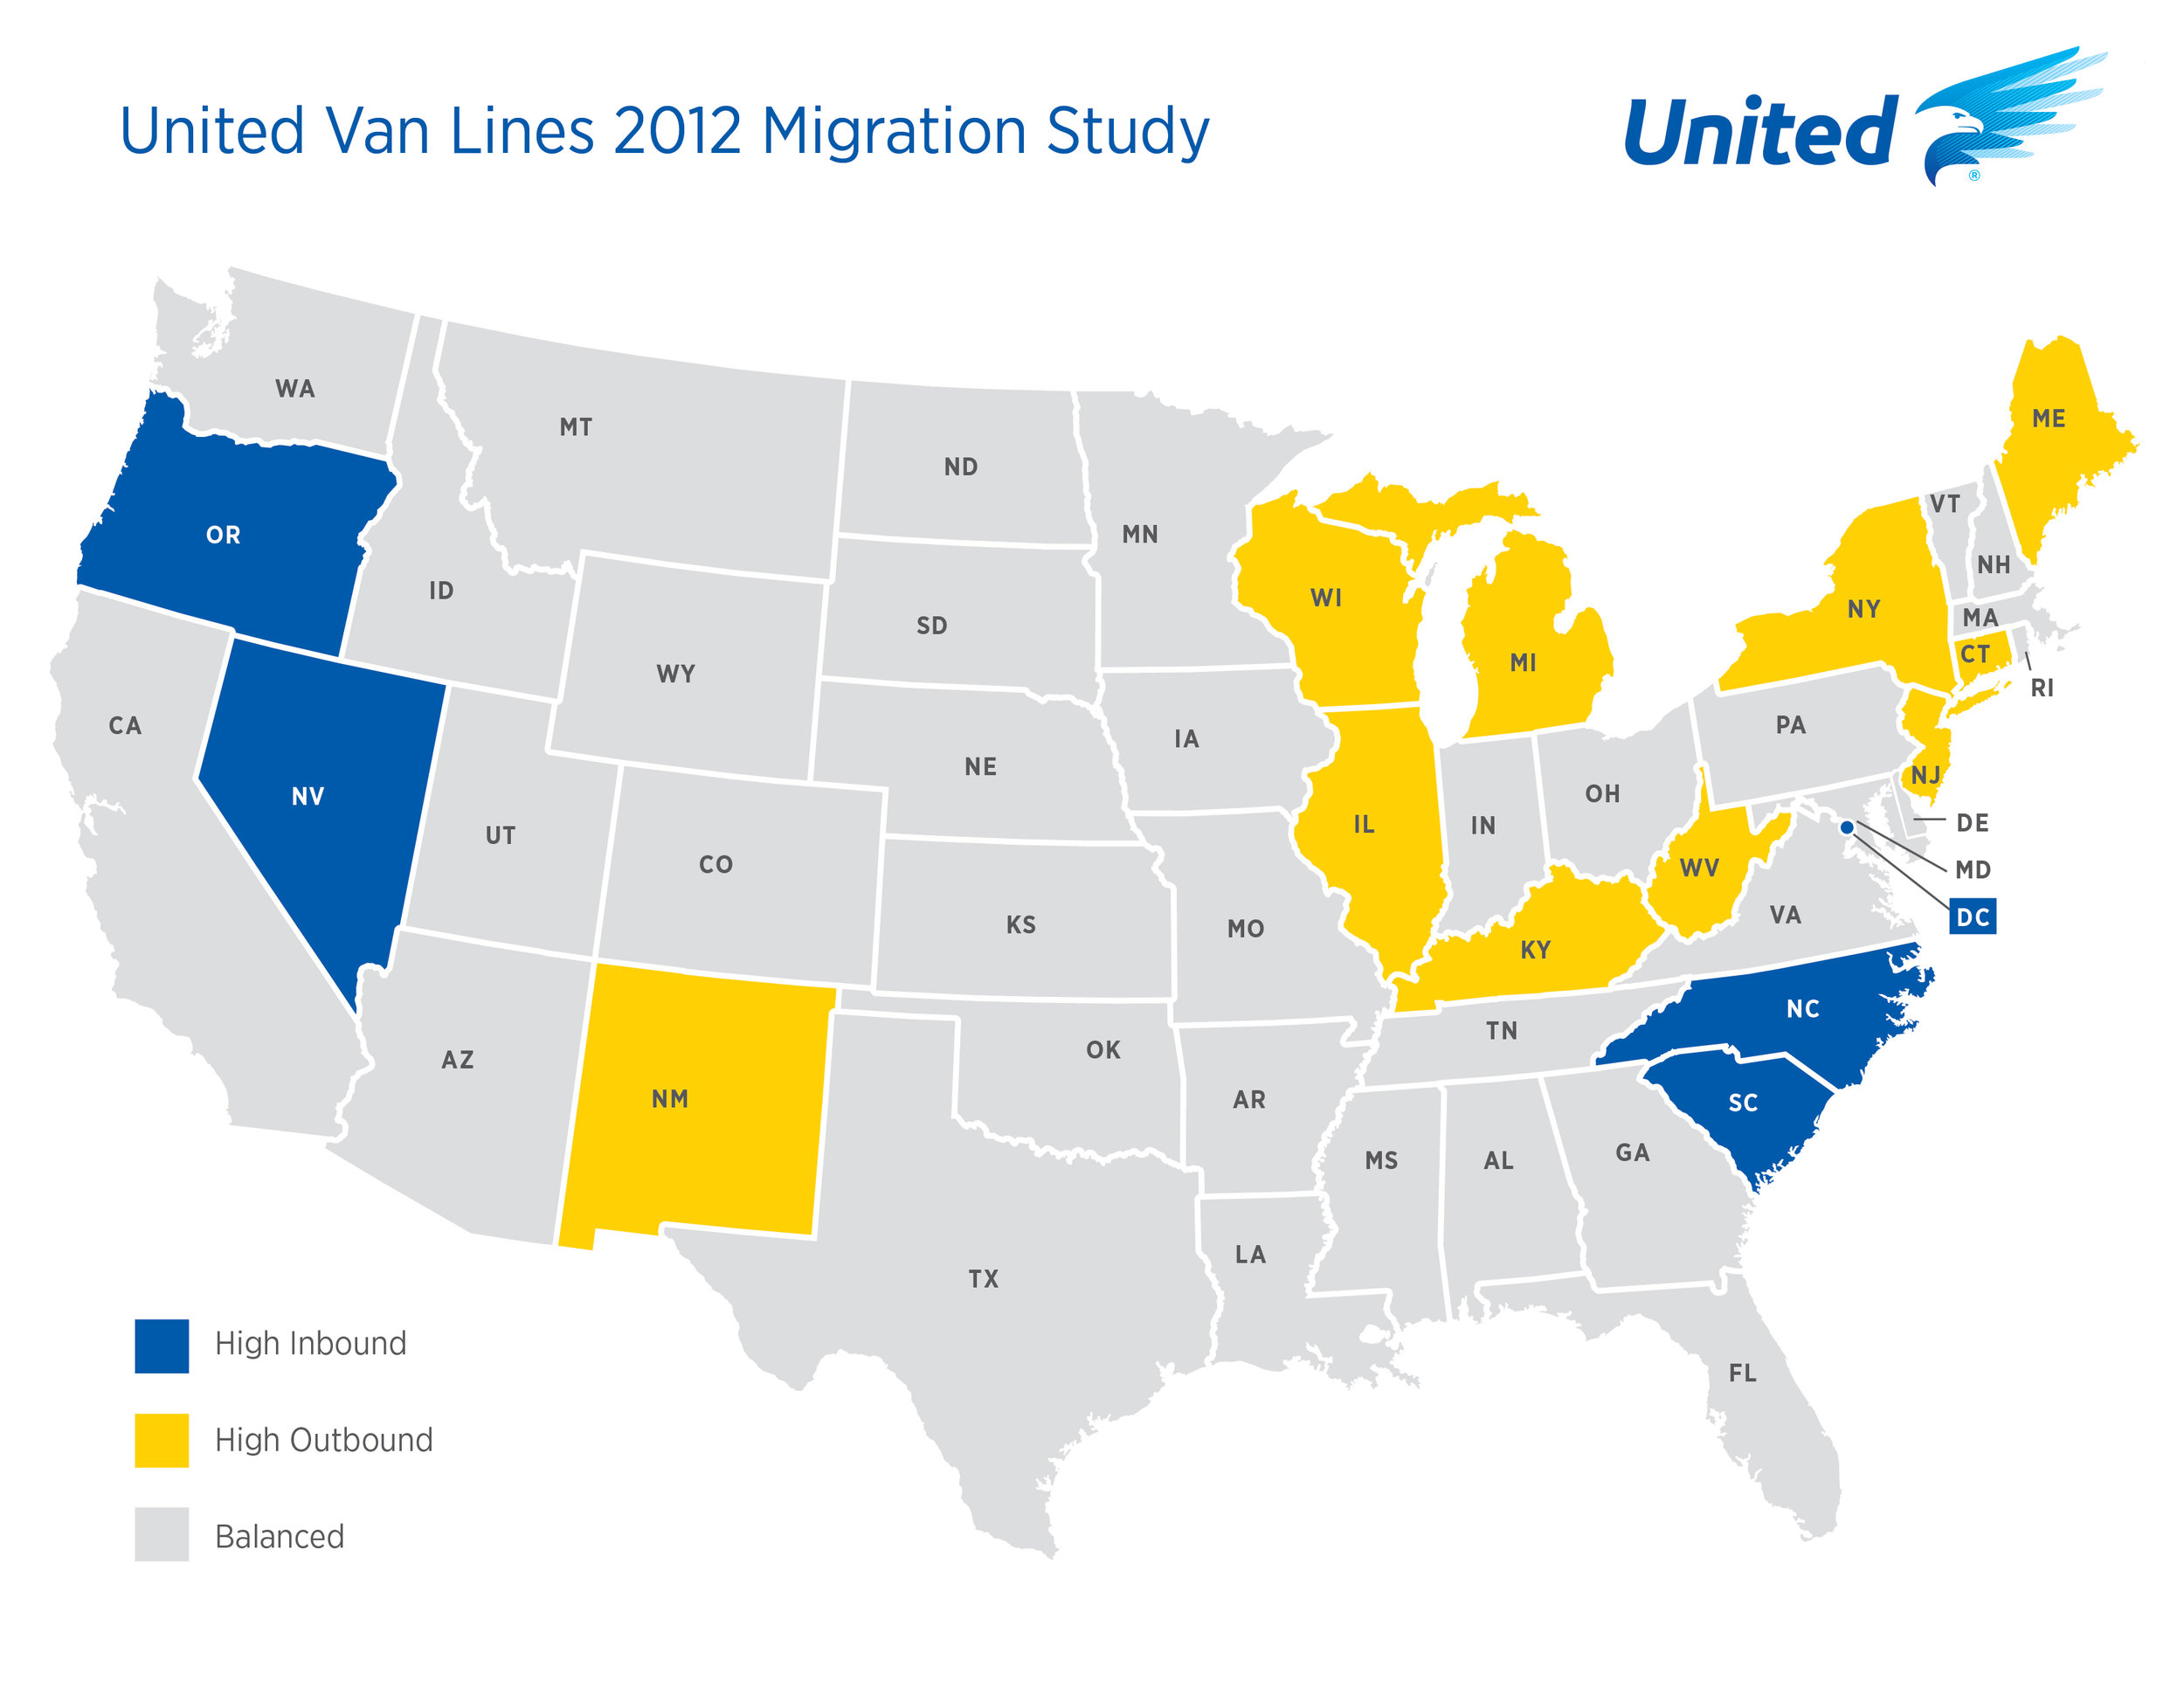
If it’s tough to tell sometimes if you’re coming or going, there is at least one well-known company that keeps close tabs on movement.  United Van Lines, long in the business of moving people from point A to point B, issues an annual “migration study” that tracks where people are moving to, and moving from. In 2012, more folks were going than coming to Connecticut, by a ratio of 56 percent to 44 percent, putting the state squarely among the top 10 outward bound leaders.  The pattern was similar throughout the Northeast.  New Jersey (62 percent) displaced the outbound leader from last year, Illinois (60 percent) reclaiming the top spot for high-outbound migration that it held in 2010.  In addition to New Jersey, New York (58 percent), Maine (56 percent) and Connecticut (56 percent) are also included.

Michigan (58 percent) and Wisconsin (55 percent) along with Illinois represented the Great Lakes region. Michigan fell to the No. 6 from the No. 4 spot it held in 2011. Previously, it had claimed the top outbound spot every year from 2006-2009.  Kentucky (55 percent) joined West Virginia (58 percent) as the only Southern states to appear on the high outbound list. New Mexico (58 percent) was the only Western state to appear on the list. The top 10 outbound states for 2012 were:

  1. New Jersey Migration Map
  2. Illinois
  3. West Virginia
  4. New York
  5. New Mexico
  6. Michigan
  7. Connecticut
  8. Maine
  9. Wisconsin
  10. Kentucky

That’s one list that states would prefer not to be included on.  United has tracked migration patterns  annually on a state-by-state basis since 1977. For 2012, the study is based on all household moves handled by United within the 48 contiguous states and Washington, D.C.  United classifies states as "high inbound" if 55 percent or more of the moves are going into a state and "high outbound" if 55 percent or more moves were coming out of a state or "balanced" if the difference of inbound and outbound is negligible.   The top-five inbound states of 2012 were 1) District of Columbia, 2) Oregon, 3) Nevada, 4) North Carolina and 5) South Carolina.

The Western United States is also represented on the high-inbound list with Oregon (61 percent) and Nevada (58 percent) both making the list. Oregon is number two for inbound migration for the third year in a row. Nevada returned to the high inbound traffic for the second consecutive year. The Carolinas each made the top five with North Carolina at 56 percent and South Carolina at 55 percent inbound moves.

Several states gained approximately the same number of residents as those that left. Those states include New Hampshire from the New England region, and the states of Louisiana, Iowa, Indiana, North Dakota, and Maryland.  This is the fifth consecutive year the District of Columbia (64 percent) was the top moving destination in the United States.  That trend may continue in 2013, what with members of Congress and the Cabinet coming and going.