Student Debt Nationwide Shows Geographic, Income, Racial Divisions; CT in Debt-High Northeast

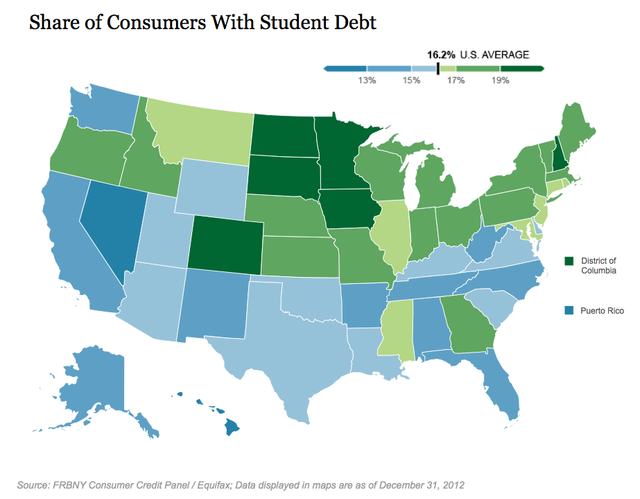
Across the country, an average 16.2 percent of consumers owe some amount of student debt. But if you look at the state level, the country appears split along the Mason–Dixon line, with a higher percentage of the population owing money in northern states than southern states, according to numbers published by the College Financing Group, citing data from the Federal Reserve Bank of New York.

Overall, Hawaii has the lowest share of consumers with student debt, just 12 percent. That’s less than half the rate in Washington, D.C., where 25 percent of the population in Washington, D.C. owes student loan money, according to data compiled through 2012. Connecticut’s rate hovers in the middle, within range of the national average.  Demos debt chart
According to the Federal Reserve Bank of New York, student loan debt is the only form of consumer debt that has grown since the peak of consumer debt in 2008. Balances of student loans have eclipsed both auto loans and credit cards, making student loan debt the largest form of consumer debt outside of mortgages.

The full report also shows that 11.9% of all borrowers are 90 days or more past due on their loans, and the average student debt per borrower stands at $24,810. Interestingly, despite Washington D.C.’s high percentage of people with student loans, it has a lower-than-average delinquency rate of only 7.3%.

In its most recently updated 2013 quarterly report, the Federal Reserve Bank of New York noted that outstanding student loan balances increased to $994 billion nationwide as of June 30, 2013, a $8 billion increase from the first quarter this year.  Other estimates have placed outstanding student debt in excess of $1 trillion.

Life on Hold, Especially Among Lower Income Families

According to a 2012 online web survey conducted by American Consumer Credit Counseling, over 35 percent of respondents reported that they have had to delay saving for retirement because of their student debt, while 27 percent also reported that their ability to buy a car has been impacted, and 29 percent said it has affected their ability to buy a house. Nine percent of respondents said student loan debt has even impacted their ability to get married.

A report this year from Demos, “At What Cost:  How Student Debt Reduces Lifetime  Wealth,” stated that “though a college education remains the surest path to a middle-class life, evidence has begun to mount that student debt may be far more detrimental to financial futures than once thought, particularly for those with the highest levels of debt: students of color and students from low-income families.”  The data used was of 2008 bachelor’s degree recipients.

The Consumer Financial Protection Bureau has reported that the share of young consumers among first-time homebuyers is falling. According to the National Association of Realtors, Americans between the ages of 25 and 34 made up 27 percent of all homebuyers in 2011, the lowest share in the past decade. That percentage represestudent debt mapnts a 25 percent decline year-over-year from 2010.
Young borrowers with student debt are less likely to own a home than those with no debt. According to recent analysis by the Federal Reserve Bank of New York, young borrowers with student debt - historically an indicator of a college education and an accompanying boost in wages - demonstrate a lower rate of homeownership than their peers with no student debt, breaking a decade-long trend.

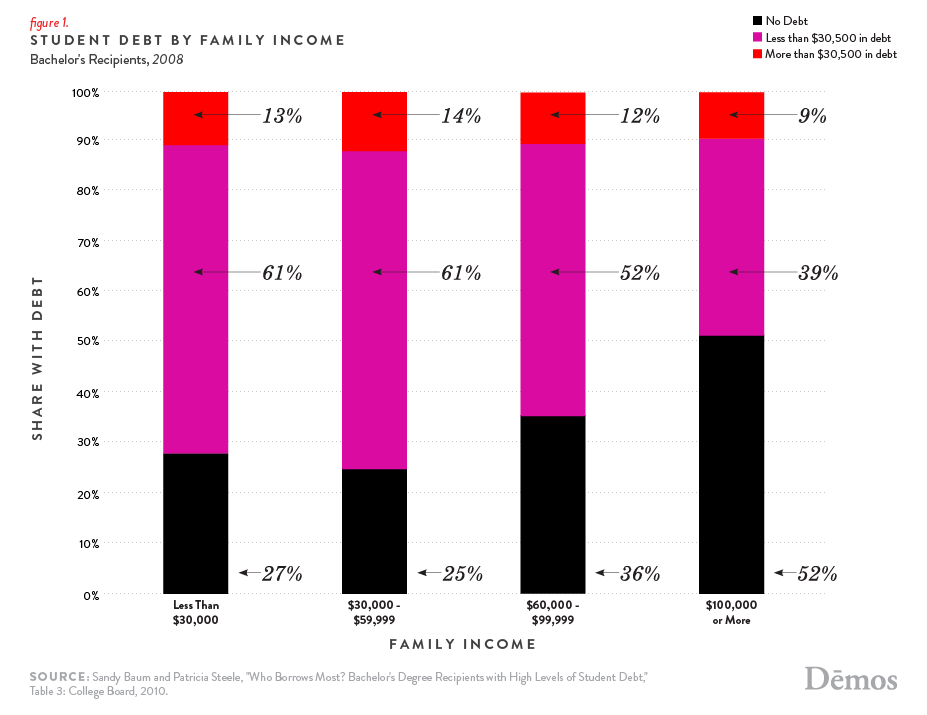
The demos report found that family income has a large impact on the debt levels of college graduates. Seventy-five percent of bachelor’s degree recipients from families with incomes of less than $60,000 graduated with some student loan debt in 2008, compared to just 48% of students whose families earned $100,000 or more. Students from poorer families were also much more likely to graduate with large amounts of debt: 14% of graduates from lower-income families had more than $30,500 in debt, compared to just 9% of students from families who earned $100,000 or more.

A report by the Project on Student Debt in October 2012, an initiative of the Institute for College Access & Success, indicated that Connecticut students graduating in the class of 2011 had the fifth highest average student loan debt in the nation, at $28,783.  That report also indicated that “high debt states are mainly in the Northeast and Midwest, with low debt states mainly in the West and South.”  The report found that 64 percent of graduating students in 2011 had student debt, which ranked Connecticut 15th in the nation that year.

Earlier this year, the Consumer Financial Protection Bureau indicated that 1 in 5 U.S. households have student loans, and the number of student loan borrowers increased 31 percent between 2007 and 2012.  Demos predicting that the “impact on the lifetime assets of indebted households will be nearly four times the amount borrowed.”

Young Adult Unemployment Rates Persist at High Levels, Education Remains Key Factor

Analyzing the enduring economic effects of youth unemployment, a new report by Demos outlines a serious job crisis, especially those with less education and individuals of color.  Surveying a full year of U.S. Bureau of Labor Statistics data from 2012, Stuck: Young America’s Persistent Jobs Crisis shows that 18 to 34 year-olds make up 45% of the total share of the unemployed population nationwide and continue to face a serious jobs gap—with 4.1 million new jobs needed to return to pre-recession levels of employment.STUCK Among the report’s key findings:

  • Young adults gained little ground in 2012. Altogether, there are more than 5.6 million 18 to 34-year-olds, 45 percent of all unemployed Americans, who are willing and able to take a job, but have been shut out of opportunities for employment.
  • Young adult Hispanic workers experience unemployment rates 25 percent higher than those of whites, while African Americans face rates approximately double.
  • The greatest differences were attributed to education: the unemployment rate for 18 to 24 year olds with a Bachelor’s degree was 7.7% compared to 19.7% for those with a high school diploma.
  • In 2012, the labor force participation rate of 18 to 24 year olds declined to its lowest point in more than four decades.
  • Workers with a four-year degree are 9 to 12 percentage points more likely to be in the labor market than workers with a high school diploma in every age group. The unemployment rate for workers with a high school diploma is twice as high as unemployment among workers with a Bachelor’s degreegraph

The findings update data provided in 2012 to the Connecticut Commission on Children and Connecticut Workforce Development Council, which indicated that teenage labor force participation had dropped 48.2 percent over the past 22 years across the US, and employment rates were lowest among teens of color.   The Commission and Council held a public forum on youth unemployment last year, noting that “For young people, the Great Depression isn't a history lesson - it's a current event.  While the overall unemployment rate hovered around 8 percent last summer, it stood at 17.3 percent for those between the ages of 16 and 24.”  The new Demos report suggests that progress has been negligible in the year since.

Demos is a public policy organization “working for an America where we all have an equal say in our democracy and an equal chance in our economy.”  The organization is led by former Connecticut Secretary of the State Miles Rapoport, and has offices in New York, Washington and Boston.   The new report indicates that if job growth continues at 2012 levels,  “it will be another ten years before the country recovers to full employment. Even then, workers under 25 will face unemployment rates twice the national average.”

The Demos report recommends that “Public investment to directly employ young adults—especially young adults of color and those without a college degree—could address the jobs crisis facing this generation, contribute to the recovery through increased consumer spending, and accomplish the kind of strong, stable, and diverse society that we envision for our future.”

Credit Card Debt Increases Among Older Residents

As Connecticut struggles to lift itself from a nagging recession and rebuild a shaky economy and grow jobs, new national data suggest that economic realities plus an aging population are combining to increase the credit card debt among a significant segment of the population. It has been estimated that the state's 65+ population would increase by 69 percent between 2000 and 2030. Middle-income Americans age 50 and older are carrying more credit card debt on average than younger people, according to a National Survey on Credit Card Debt of Low- and Middle-Income Households, released last month by Demos, a national policy think tank and AARP’s Public Policy Institute.

The results of the 2012 survey are a reversal of findings from a survey conducted by Demos in 2008.  It reveals a troubling picture of middle-income 50+ households carrying card debt near or in their retirement years.

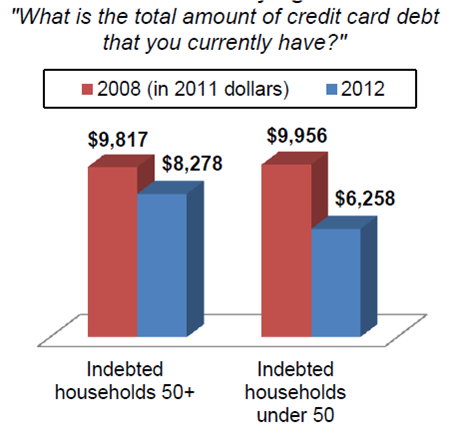
The report shows that nationwide, older households carried an average credit card balance of $8,278 in 2012. For those underlogo 50, credit card debt averaged $6,258. Other key findings for middle-income households that carried credit card debt for three months or more:

  • A third of older households used credit cards to pay for basic living expenses such as rent, mortgage payments, groceries, or utilities.
  • Half of Americans age 50+ carried medical expenses on their credit cards. Prescription drugs and dental expenses were the main contributors.
  • A quarter of older households said loss of a job contributed to their credit card debt in the last three years.
  • Nearly one in five (18 percent) older Americans nearing retirement said they dipped into retirement funds to pay down credit card debt.chart
  • Older Americans were twice as likely as those under age 50 to take on credit card debt to assist other family members (23 percent vs. 11 percent).

This report suggests that credit card debt among older Americans is primarily a reflection of difficult economic times, not a lack of personal financial responsibility.  State-by-state data was not available.

The findings may help to explain the economic challenges facing Connecticut’s citizenry, which is on track to becoming one of the oldest among the states, expected to grow from 470,183 (13.8% of the total state population) in 2000 to 794,405 in 2030, constituting 21.5% of the projected total state population.