Stamford Population Grows as Most Cities See Drop in Past Year
/The growth in Connecticut’s population in recent years is largest in Stamford and across Fairfield County, and Stamford is gaining on New Haven, the state’s second largest city. The U.S. Census Bureau has reported the municipalities in Connecticut that have experienced the largest increases in population last year, and over the past four years, revealing population declines in most of the state's largest cities during the past year. The municipality gaining the most people in Connecticut between July 1, 2013 and July 1, 2014, was Stamford, whose population rose by 1,590 over the period. Stamford was followed by Stratford, with a population increase of 502, Darien (310), Fairfield (230) and East Lyme (222). Between 2013 and 2014, Bridgeport, New Haven, Hartford, Waterbury, Danbury, New Britain, Bristol, and Meriden lost population while Stamford and Norwalk experienced growth, among the state's largest cities.
The estimated population in Stamford, the 208th largest city in the U.S., grew from 122,815 as of July 1, 2010 to 128,278 in 2014. Bridgeport, ranked number 175 in the nation by population and Connecticut’s largest city, grew from an estimated 144,845 in 2010 to 147,612 in 2014, which was a slight drop of 174 residents, from 147,786 in 2013, according to the census estimate data.
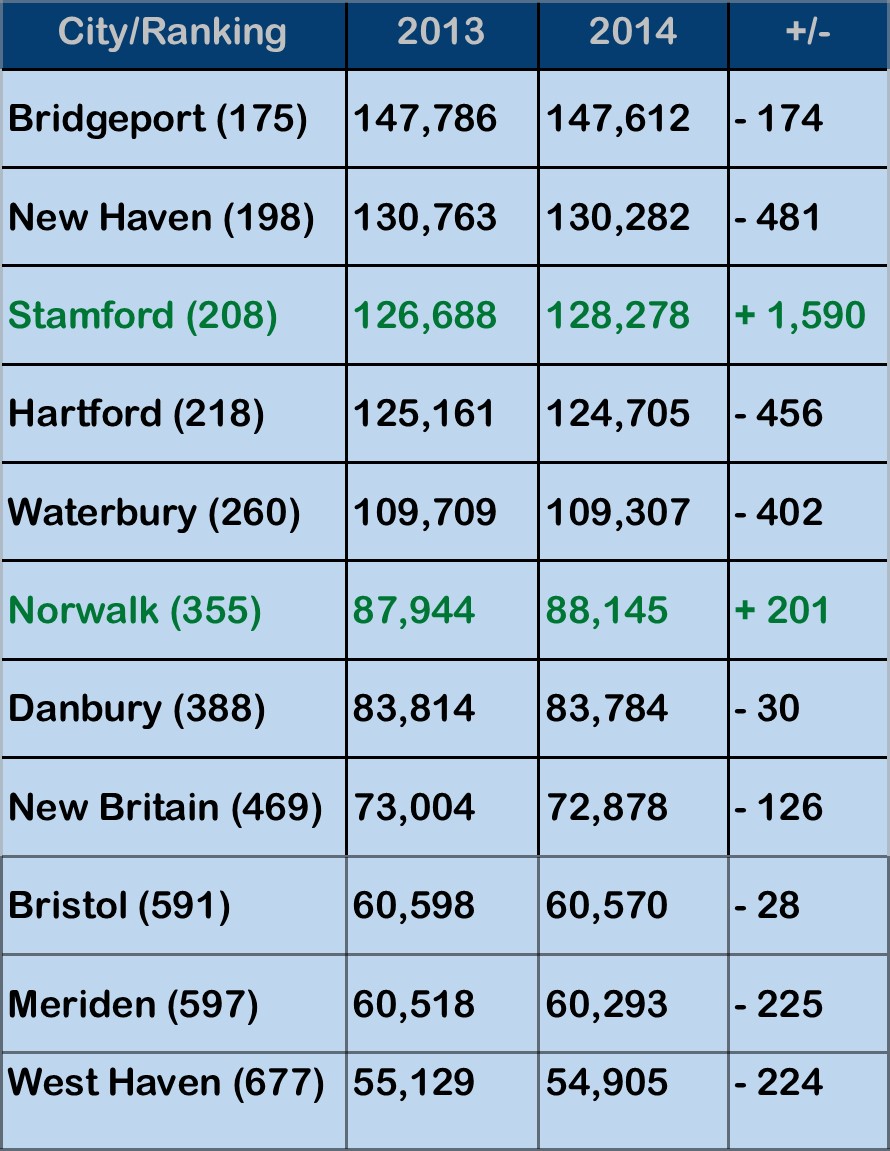 Over the past four years, population also grew in Hartford, New Haven, Stamford, Danbury and Norwalk, but declined in some of the state’s other large municipalities, including Waterbury, New Britain, Meriden and West Haven.
In New Haven, the 198th largest city in the nation, the population increased from 129,890 in 2010 to 130,282 in 2014. Connecticut’s Capitol City and the state’s 4th largest, Hartford, saw population grow narrowly from 124,314 in 2010 to 124,705 last year. Hartford’s population is now ranked #218 in the nation.
As New Haven gained 392 residents during the past four years, Stamford gained 5,463, which narro wed the gap between the two cities to 2,004. Just four years ago, the population differential was 7,075. Stamford passed Hartford to rank as the state’s third largest city three years ago.
Waterbury saw a population decline over the past four years, from 110,331 to 109,307. The Brass City is the nation’s 260th most populous city. Norwalk, the nation’s 355th largest city, saw population growth from 85,992 to 88,145 over the past four years, while Danbury, ranked number 388, experienced an increase in population, from 81,354 in 2010 to 83,784 in 2014.
New Britain, ranked number 469, also experienced a decline in population, from 73,240 to 72,878, 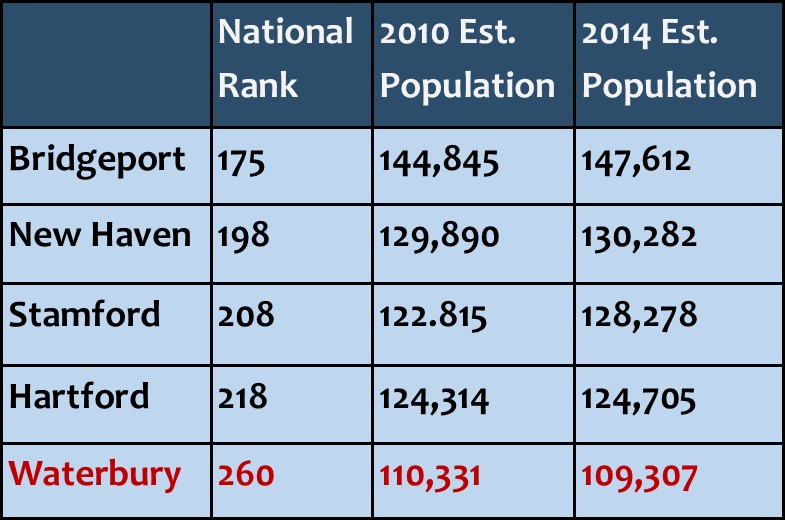 according to the census data, while Bristol (number 591) saw a slight uptick of just under 100 residents, from 60,477 to a 60,570. Meriden (number 597) saw population slip from 60,868 to 60,293. West Haven, the 677th most populous city in the nation, also experienced a drop in populations, from 55,565 to 54,905.
The population estimates are based on annual population estimates since the 2010 Census and the data includes annual estimates each July 1, through July 1, 2014.
San Jose, Calif., is now among the 10 U.S. cities with a population of 1 million or more, according to the new U.S. Census estimates. California has three cities with 1 million or more people (Los Angeles, San Diego and San Jose), tying Texas (Houston, San Antonio and Dallas) for the lead among states.
New York remained the nation’s most populous city and gained 52,700 people during the year ending July 1, 2014, more than any other U.S. city. Rounding out the top ten were Los Angeles, Chicago, Houston, Philadelphia, San Antonio, San Diego, Dallas and San Jose. The other top 20 cities are Austin, Jacksonville, San Francisco, Indianapolis, Columbus, Fort Worth, Charlotte, Detroit, El Paso and Seattle.
The only change in the rank order of the 15 most populous cities between 2013 and 2014 was Jacksonville, Fla., and San Francisco, each moving up one spot to 12th and 13th place, respectively, passing Indianapolis, which fell from 12th to 14th.
For the first time since Hurricane Katrina struck in 2005, New Orleans (384,320) returns to the list of the 50 most-populous cities this year at number 50, with Arlington, Texas, dropping off the list.
Connecticut’s is the nation’s 29th most populous state, with the population in 2014 estimated by the U.S. Census at 3,596,677, an increase from 3,574,096 in 2010. However, the state's population last year was less than the previous year (3,599,341 in 2013), down by 2,664 statewide, according to the U.S. Census data.


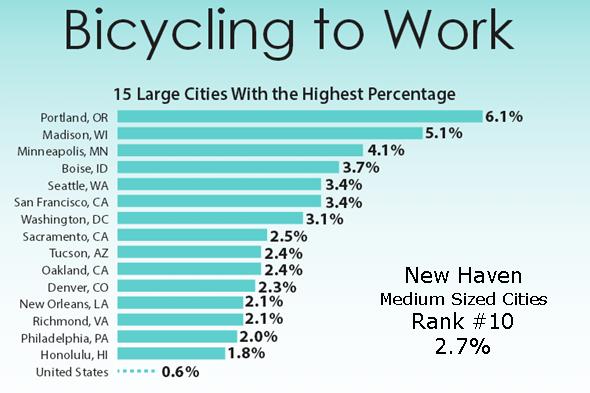 y bicycle remains low, according to the U.S. Census American Community Survey. In 1980, 0.5 percent of workers commuted by bicycle. This rate dropped to 0.4 percent in 1990, where it remained in 2000, before nudging upward in the latest survey.
 Among the nation’s medium sized-cities, (with p
 opulations between 100,000 and 199,999) New Haven ranks at #5 with 12.4 percent walking to work and at #10 with 2.7 percent of the population using bicycles to get to work. Hartford ranks at #10 among the top walk-to-work medium sized cities with 8.2 percent, and did not reach the top 15 in bicyclists.
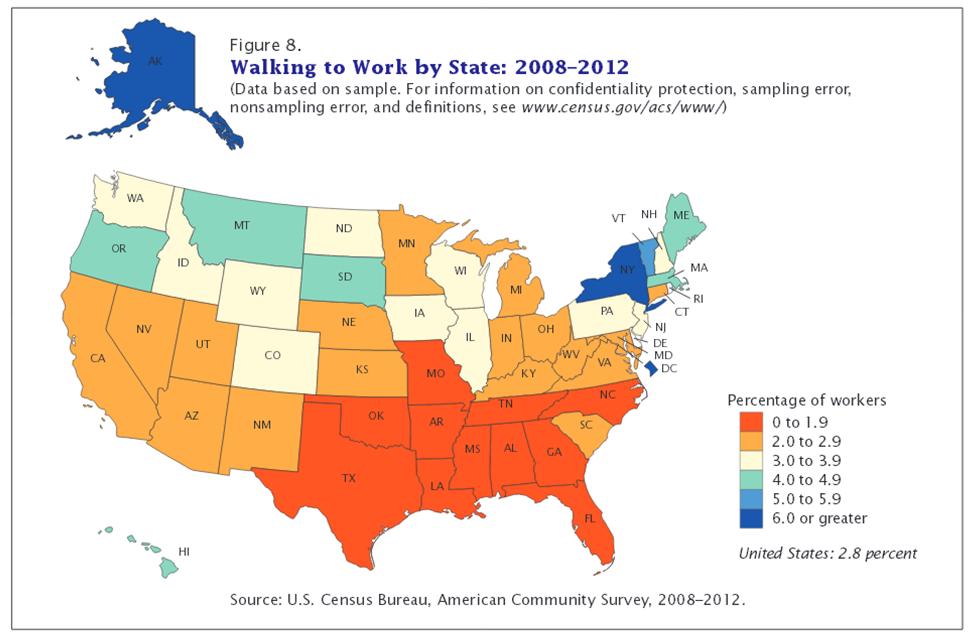 average commute to work in Connecticut is about 25 minutes, ranging from 28 minutes in Fairfield County, 27 minutes in Litchfield County, 26 minutes in Windham County, 25 minutes in Middlesex County and Tolland County, to 24 minutes in New Haven County, 23 minutes in New London County, and 22 minutes in Hartford County.
 013. Only Rhode Island lost population (1,056 people) during the period, and the Southern and Western states accounted for more than 80 percent of the growth nationwide.
 from 114,555,744 in 2010 to an estimated 118,383,453 in 2013. The West was close behind, with a 3.2 percentage-point growth during the period, from 71,945,553 in the 2010 Census to an estimated 74,254,423 in July 2013.


