Gender Disparity Is Alive and Not-So-Well; Particularly in Connecticut, Analysis Finds

Connecticut places dead last among the 50 states in the degree of gender gap in executive positions in the workplace and overall workplace environment for women, according to a new analysis prepared by the financial website WalletHub.  The state also ranked in the bottom ten in the “education and health” category, ranking higher – in the top ten – only in “political empowerment,” despite having fewer women in the state legislature than about a decade ago. Overall, the state ranked 28th among the “Best and Worst States for Women’s Equality.”

The challenges present in Connecticut are true – to varying degrees – nationwide.  In 2016, the U.S. failed to place in the top 10 — or even the top 40 — of the World Economic Forum’s ranking of 144 countries based on gender equality, WalletHub reports.

Among the states, the top 10, with the slimmest inequality gap, were Hawaii, Nevada, Illinois, Minnesota, Washington, Maine, North Dakota, Oregon, Wisconsin, and Vermont.  Among the other New England states, Massachusetts ranked #13, New Hampshire was #16, and Rhode Island was #34.  The widest gaps were in Texas, Virginia and Utah.

"Connecticut ranked below average overall mostly because of its rankings for two of the categories we analyzed, Workplace Environment (50th) and Education & Health (43rd),” WalletHub analyst Jill Gonzalez told CT by the Numbers.  “Connecticut's disparities between women and men are quite pronounced when it comes to the workplace environment. Women earn 23 percent less than men, 9th highest in the country, and Connecticut has the highest gap of women in executive positions. Large differences also appear when looking at higher-income earners, with a 13 percent gap between women and men, and the entrepreneurship gap in Connecticut is at 48 percent, again favoring men."

To determine where women receive the most equal treatment, WalletHub’s analysts compared the 50 states across 15 key indicators of gender equality in three central categories: workplace environment, education and health, and political empowerment  Among the indicators used in the analysis, Connecticut ranked 46th with among the largest educational attainment gap among Bachelor’s Degree holders, 48th in the entrepreneurship gap, 49th in the disparity among higher income wage earners (in excess of $100,000 annually) and 50th with the largest executive positions gap.

According to the National Conference of State Legislatures, just over one-quarter of Connecticut’s legislators are women, at 27.3 percent, compared with the national average among state legislatures of 24.8 percent.  There are 1,830 women serving in legislatures across the country.  In Connecticut, 42 of 151 House members are women, and 9 of the Senate’s 36 seats are held by women.   Among the states with the highest percentage of women in their legislature are Vermont, Colorado and Nevada with 39 percent, Arizona with 38 percent, and Illinois and Washington at 36 percent.  Connecticut’s numbers have declined since 2009, when a total of 59 women held legislative seats, 8 in the Senate and 51 in the House.

The workplace environment category included data on income disparity, the number of executive positions held, minimum wage workers, unemployment rate disparity, entrepreneurship rate disparity and the disparity in the average number of work hours.

The analysis found that in every state, women earn less than men. Hawaii has the lowest gap, with women earning 12 percent less, and Wyoming has the highest, 31 percent. Connecticut ranked 41st.  Rhode Island has the highest unemployment-rate gap favoring women, with 2.4 percent more unemployed men. Georgia has the highest gap favoring men, with 1 percent more unemployed women. The unemployment rate is equal for men and women in Illinois and Idaho.  In Connecticut’s it’s nearly identical, with the 0.3 percent more unemployed men than women, based on the data reviewed.

Women continue to be disproportionately underrepresented in leadership positions nationwide. According to the Center for American Progress, women make up the majority of the population and 49 percent of the college-educated labor force. Yet they constitute “only 25 percent of executive- and senior-level officials and managers, hold only 20 percent of board seats, and are only 6 percent of CEOs.”  In addition, salary inequity continues, and women are underrepresented in government.

The analysis was released to coincide with Women’s Equality Day, which is observed annually on August 26. The U.S. Congress designated the commemoration beginning in 1971 to remember the 1920 certification of the 19th Amendment to the Constitution, granting women the right to vote. The observance of Women’s Equality Day also calls attention to women’s continuing efforts toward full equality, according to the National Women’s History Project.

7,000 Refugees Settle in CT Since 2001; Burma, Congo, Iran, Somalia Most Frequent Origin

The United States has long been the global leader in resettling refugees, defined as people forced to flee their home country to escape war, persecution or violence, explains Smithsonian magazine in a state-by-state comparison. Since 2001, the magazine reports, more than 895,000 refugees have settled in the U.S., typically after being referred by the United Nations and vetted by the State Department in a process that takes at least 18 months. By comparison, a million or so legal immigrants arrive annually. From October 2001 through 2016, Burma, Iraq, Somalia, Bhutan, and Iran are the top five nations that send refugees to the U.S.

Refugees to the United States have come mostly from the Middle East, Asia and Africa. While many immigrants, legal and undocumented, come from Latin America, U.S. regulations make it difficult for Central and South Americans to qualify as refugees, according to Smithsonian.

The magazine developed a series of charts that compare refugee populations resettled in 41 states since October 2001. In depicting the refugees’ nation or origin, the breakdown in each state is limited to nationalities with at least 500 people, and no more than the top 5 nationalities are shown.

The number of refugees from those five nations, as well the total number of refugees is indicated.

For Connecticut, the total number of refugees is 7,144. The largest percentage of refugees come from Burma, Democratic Republic of the Congo, Iran and Somalia.  Those four nations were the home country for 3,824 of the refugees who settled in Connecticut since 2001.

Massachusetts' total is three times Connecticut - 21,441 refugees moving to the Bay State since 2001.

States with the largest number of refugees include California (102,614), Texas (81,765), New York (53,790), Florida (46,553), Minnesota (40,762), Washington (40,111), Arizona (39,031), Michigan (38,175), and Georgia (35,328).

There were nine states that had less than 500 refugees from a single country since October 2001:  Alabama, Alaska, Arkansas, Delaware, Hawaii, Mississippi, Montana West Virginia and Wyoming.


Hartford Whalers (Logo) Headed to Connecticut (Vehicles)

Connecticut drivers may soon see another vanity license plate option if a bill approved by the state legislature is signed into law by Governor Malloy.  A license plate commemorating the Hartford Whalers hockey franchise, which departed the Capital city 20 years ago, gained legislative approval in the final days of the General Assembly session. It is the latest of an ever-growing list of license plates supporting a variety of charitable causes and local organizations that are authorized by the state and raise money for various causes.  The Whalers license plate is to be a fundraising vehicle for the Connecticut Children’s Medical Center.

Stafford Springs State Rep. Kurt Vail, who introduced the bill, said in public hearing testimony earlier this year that “the popularity of the franchise has not gone away.”  He predicted that the license plate would be “a huge hit amongst our citizens.”  House Majority Leader Matt Ritter of Hartford said that “with memories of attending games with my grandfather still fresh…the Whalers continue to have a large and growing following in the city.”

Although the Whalers license plate was created by an act of the legislature, state law allows the Department of Motor Vehicles to issue special background plates on behalf of non-profit organizations. The organization must be non-profit, must submit a copy of the organization’s charter or by-laws, provide a letter of good standing from the State of Connecticut Secretary of State’s Office (if required) and supply any Internal Revenue Service ruling on their non-profit tax exemption status.

The logo production and cost incurred will be the responsibility of the organization. The logo prototype design, preferred in PDF format, must be submitted to the DMV. The logo can be no larger than 2 inches wide and 3.5 inches high. DMV has final approval on all the plate and logo designs.

A liaison for the organization must be appointed. This individual will be responsible for all communications with the DMV as well as certifying and authenticating (by signature) each member’s application, submitting the logo design to DMV for approval, submitting 400 applications with the required fee prior to the manufacturing of the special background plates, and submitting a Special Interest Plate disclaimer.

Many organizations in Connecticut offer license plates to their members and the general public.  General categories include animals, colleges, environment, organizations, police and fire, cities and towns, and recreation.

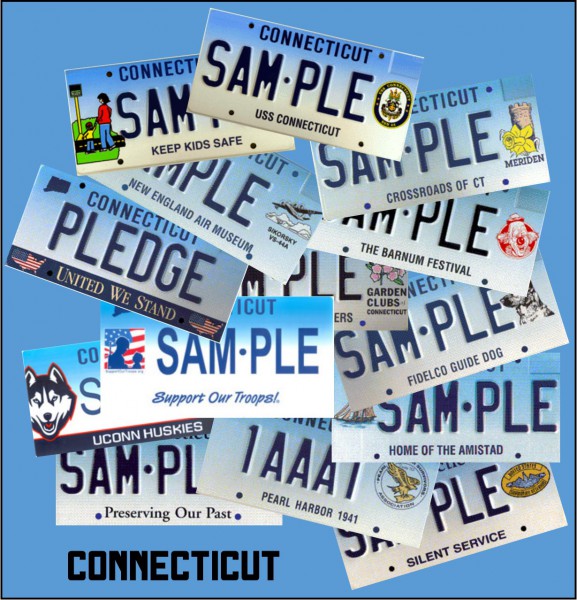
Organization vanity plates include Amistad, Benevolent & Protective Order of the Elks, IUOE Local 478, Grand Lodge of Connecticut, Knights of Columbus, Olympic Spirit, P.T. Barnum Foundation Inc., Preserving Our Past CT Trust for Historic Preservation, Red Sox Foundation, Lions Eye Research Foundation, Special Olympics, Federated Garden Clubs, Fidelco Guide Dog Foundation, Keep Kids Safe, New England Air Museum and the U.S.S. Connecticut Commissioning Committee.

When individuals purchase a Keep Kids Safe plate, a portion of the fee goes to the Keep Kids Safe Fund, which “makes many worthy projects happen for youngsters.”  The fund awards grants to schools, hospitals, municipalities and other non-profit organizations working to make all Connecticut children safer from severe and preventable injuries, according to the DMV website.

In most cases, remake of a current plate is $70; a new vanity plate is $139, a new series plate is $50.  For others, including the UConn Huskies plate, the price tag is somewhat different.  Off-the-shelf license plates cost $55, remake of a current plate is $75, a new vanity plate costs $144, according to the DMV website.

The Support Our Troops plate sends a portion of the fee to provide funding for programs to assist Connecticut troops, their families and veterans. When you buy a Red Sox plate, a portion of the fees support and help fund academic scholarship programs in Connecticut.

Also included are 17 varieties of military specialty plates, including Disabled American Veteran, Gold Star Family, Iwo Jima Survivor, Korean War Veterans Association, Marine Corps League, Laos Veterans of America, Military Order of the Purple Heart, Pearl Harbor 1941, U.S. Submarine Veteran, National Guard Association of Connecticut, First Company Governor’s Foot Guard, First Company Governor’s Horse Guard,

Colleges with designated plates include Central Connecticut State University, Penn State Alumni, University of Hartford, University of Connecticut, and University of New Haven.  Cities with available plates include Meriden, Norwich, and Stafford.

Organizations interested in launching a new special plate, should contact the DMV Special Plate Unit at (860) 263-5154 for further information.

Migration Patterns Show Some Pluses as Population Numbers Decline

Connecticut's total population has declined over the past 3 years.  In fact, in 2016 Connecticut's total population fell below 2010 levels. New England and our neighboring states have also experienced an increase in people leaving. However, Connecticut has fallen the most post-recession, according to an analysis by the Connecticut Data Collaborative. International migration has helped, the data shows, but not enough to offset domestic out-migration.  Average international in-migration has grown 29% post-recession compared to pre-recession, but in terms of overall net migration, the state has seen an increased loss starting from 2012.

The state gains prime working age adults and children and also attracts well-educated international migrants, according to the analysis, and Connecticut loses the smallest percent of graduate degree holders. By income, the largest flows are at the lowest income levels (though largely due to age of earners), though the state is experiencing a slight loss of its highest income earners (incomes of $5 million or more).

Among the factors contribution to the population decline:

  • Post-recession, Connecticut has about 14% fewer births each year compared to pre-recession averages. Increased deaths are also slightly contributing to Connecticut's overall population decline.
  • Average domestic out-migration has increased by 55% post-recession compared to pre-recession, a difference of about 9,200 people.

Young adults move at a higher rate than the rest of the population (larger flows both in and out of Connecticut), and the state is losing young adults on net (18-29 year olds), but gaining working age adults (30-49 year olds), the Data Collaborative analysis shows.

Historically, Connecticut experienced population losses to other regions of the U.S. This is also true of New England in general. However, the recent declines in Connecticut's total population are primarily driven by increasing rates of net domestic out-migration and to a smaller degree a declining birth rate. But there are positive trends.

The state gains prime working age adults and children. Connecticut also attracts well-educated international migrants, and loses the smallest percent of graduate degree holders.  By income, the largest flows are at the lowest income levels (though largely due to age of earners), though the state is experiencing a slight loss of its highest income earners (incomes of $5 million or more).

Connecticut's domestic migration trends are now more like New York and New Jersey.  However domestic out-migration has more than doubled in Connecticut while New York and New Jersey are better than pre-recession, the researchers found.

Flexer Sees Bad Choices Ahead if State Doesn't "Do Something Dramatically Different"

“Connecticut’s got to do something dramatically different,” implored State Sen. Mae Flexer.  Her impassioned comments came as part of a panel discussion at the unveiling of the 2017 Kids Count Policy Report at the State Capitol.  With budget negotiations proceeding in earnest amidst a worsening state fiscal situation, Flexer expressed her concern about the forces driving the conversation at the Capitol, and the long-term implications for residents in the state’s rural and urban communities. “As I think about the days and the weeks ahead, I’m frustrated, because frankly, this building as far as I can tell right now, is being ruled by the voices of the people of the wealthy and suburban communities, and not by the voices of people (in these districts),” she said, following concerns raised by colleagues Rep. Brandon McGee (Hartford, Windsor) and Rep. Susan Johnson (Windham), who had focused on the significant disparities outlined in the report, and the adverse impact on children and families in Connecticut.   

“We’re not winning the battle,” said Flexer, who represents Killingly, Brooklyn, Canterbury, Mansfield, Putnam, Scotland, Thompson and Windham.  “And as I sit here and think about what this data should be leading us to do, and the reality of the choices that we are going to be making in the next couple weeks, we’re going to be making bad choices,” Flexer continued.

The 37-page report, “Race Equity in the Five Connecticuts: A Kids Count Special Report“ provided detailed analysis on the disparities in the state’s differing communities, described based on demographic data as being in one of five categories:  wealth, suburban, rural, urban periphery or urban core.   The report was published by the Connecticut Association for Human Services.

The stark differences, according to Chief Executive Officer Jim Horan, “are reflected not only in disparities in economic well-being, but in education, health, and family and community indicators.” The report found “there are persistent inequities in outcomes along racial and ethnic lines. Poverty rates differ starkly by race and ethnicity, as do other economic indicators, academic achievement (including graduation rates), and health outcomes.”

“We need to do things differently,” Flexer told those attending the May 15 panel discussion, one of two held back-to-back as part of the release of the report  that began with a detailed presentation of the report’s findings.  “The workforce training program (that you’re talking about) – it’s not going to exist in four or five years on the path that we’re taking right now in Connecticut of thinking that we have to do things the same way but not bringing anymore resources into the picture and not thinking of creative ways to allocate those resources is just going to make these statistics worse.  It’s going to make the outcomes for the communities that the three of us represent, worse.  It’s going to drive up rates of poverty, it’s going to make a study like this when it’s done again in five years even more stark of a contrast between the different regions.”

Noting that the towns of Chaplin, Hampton, Windham, Scotland, and Mansfield were one town early in the state’s history, Flexer asked “how much money would that save if that were still the case?  Is looking at our past the solution to what we need to do in the future, in a system with limited resources?”

Reflecting on the budget choices being discussed at the Capitol to reign in the multi-billion dollar deficit, Flexer expressed apprehension at some of the options under consideration.

“There are people who think that the Office of Early Childhood should no longer exist, that your commission [Commission on Children, Women and Seniors] should no longer exist, as a solution to Connecticut’s budget situation.  That throwing more families off of HUSKY insurance coverage is the answer to the problem we’re in the State of Connecticut,” Flexer said.

Flexer’s frustration and apprehension, however, was tinged with optimism.

“I’m so grateful to have this report and to have this conversation. I’m hopeful that people will look at what you’ve put together here and understand that we’ve got to do things differently and we can’t fail folks in … these communities.”


CT-N coverage

Fake News More Believable Than Real News; Researchers Cite Familiarity As Reason

New research from Yale University indicates that fake news flourishes in large measure from its repetition – and can be more convincing than real news. The believably of fake news, according to the just-concluded study, is familiarity. Last year’s Presidential election brought considerable attention to the phenomenon of “fake news,” described as entirely fabricated and often highly partisan content that is presented as factual news. Disinformation of this sort poses a major threat to democracy, the researchers point out, after examining the success of fake news, particularly on social media.

Prior work has shown that familiarity increases perceived accuracy of entirely plausible and innocuous (but not necessarily true) statements. The Yale researchers investigated whether this effect extends to highly implausible and partisan statements.  Alarmingly, they found that it does.

Using actual fake news headlines presented as they are seen on Facebook, their 46-page research paper shows that even a single exposure increases perceptions of accuracy.  The researchers found that “increased perceptions of accuracy for familiar fake news headlines occurs even when the stories are labeled as contested by fact checkers, or are inconsistent with the reader’s political ideology. The effect is also evident when there is no conscious awareness of having previously seen the headline.”

“Collectively, our results indicate familiarity is used heuristically to infer accuracy. Thus, the spread of fake news is supported by persistent low-level cognitive processes that make even highly implausible and partisan claims more believable with repetition. Our results suggest that political echo chambers not only isolate one from opposing views, but also help to create incubation chambers for blatantly false (but highly salient and politicized) fake news stories.”

Three Yale University researchers - Gordon Pennycook a postdoctural fellow in the Department of Psychology, Tyrone D. Cannon, Professor of Psychology and Psychiatry and Director of the Clinical Neuroscience Lab, and David G. Rand, Associate Professor of Psychology, Economics & Management in the School of Management – are raising alarms about the effectiveness of so-called “fake news.”  Their paper, "Prior Exposure Increases Perceived Accuracy of Fake News," appears on SSSN, a site "devoted to the rapid worldwide dissemination of research."

“News stories … were fabricated and promoted on social media in order to deceive the public for ideological and/or financial gain. An analysis of the top performing news articles in the months leading up to the election revealed that the top fake news articles actually outperformed the top real news articles on Facebook (in terms of shares, likes, and comments). Although it is unclear to what extent fake news influenced the outcome of the Presidential Election, there is no question that many people were deceived by entirely fabricated (and often quite fanciful) fake news stories,” the researchers explained.

“These findings have important implications for our society, and the functioning of democracy which relies on an informed electorate. For example, the familiarity effect we demonstrate suggests a potential self-reinforcing cycle of online falsehoods: the sharing of fake news on social media leads to increased familiarity, which leads to increased perceptions of accuracy, which presumably leads to more sharing, which necessarily leads to increased familiarity, which leads to further increases in perceptions of accuracy, and so on.”

They further point out that the “feedback cycle is likely to be particular pernicious when coupled with so-called ‘echo chambers’ in which people mostly interact online with others who share the same political opinions.”  Their results suggest that echo chambers not only isolate one from opposing views, but also help to create “incubation chambers for blatantly false (but highly salient and politicized) fake news stories.”

These findings have implications beyond just fake news on social media, according to the researchers. They suggest that "politicians who continuously repeat false statements will be successful, at least to some extent, in convincing people those statements are in fact true.”


PHOTO: David G. Rand, Tyrone Cannon, Gordon Pennycook


Carolina Attendance Plummets; Proposal for Hartford Region to Buy Back Whalers, Bring 'Em Home

In a press conference on May 6, 1997, team owner Peter Karmanos Jr. said he was moving his hockey team, the Hartford Whalers, to Raleigh and renaming it the Carolina Hurricanes. It has been 20 years, and now there is an effort – voiced by Hartford City Councilman John Gale – to go back to the future, and bring the franchise to Hartford's XL Center.  It is a long-shot, wistful effort that has yet to capture the public imagination in Connecticut, or any apparent interest from Karmanos, despite near constant rumors, and some intimation, that the franchise could be bought, for the right price.  There has been consistent resistance from the NHL to moving the franchise from Raleigh, but no new comment since the latest idea became public.

“This is a market where the people have a good feeling about themselves, have a good feeling about the future,” Karmanos said two decades ago of the Carolina market to which he was redirecting the soon-to-be former Whalers. “I think they want a sports team here as a quality-of-life issue, something they can identify with.”

Now, Gale suggests in an op-ed published by the Hartford Courant, the team ought to return for much the same reason. “What if we could provide the region with an identity, a rallying point; what if there were a way to bring back the Whale and give it a built-in metro area base of support; and we did it all by regionally cooperating,” Gale wrote.

It has been two dec
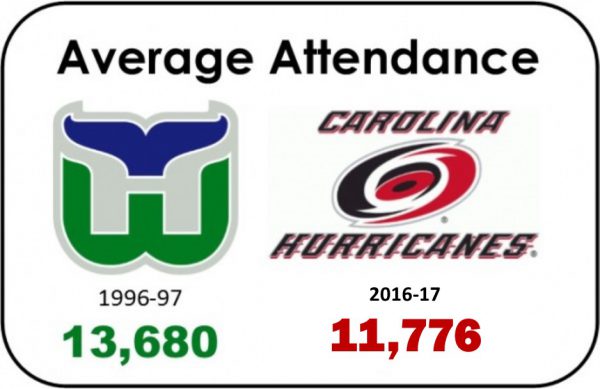
ades of highs and lows as the Carolina Hurricanes – two Stanley Cup appearances, and one win of the Cup in the early years, and the worst attendance in the National Hockey League, or near the bottom, more recently.  In Hartford, the Whalers remain very much a part of the city's consciousness.

The Hurricanes have had the NHL’s worst home attendance in each of the past two years, and attendance at home games has dropped for five consecutive years, averaging 11,776 this season for 41 home games.

In January, NBC Sports reported that team President Don Waddell said Karmanos was not actively looking to sell the team, but that “If someone came along and wanted to buy it, I’m sure we’d talk about it but we’re not actively out there trying to find investors. If someone calls and says, ‘Hey, I want to buy the team,’ we’re taking that call.”  A year ago, there were rumors of a sale and move to Quebec City.

Today, the Hurricanes Executive Vice President and General Manager is Hall of Famer Ron Francis.  The former standout – in Hartford and Carolina – was the first player to have his number retired by the Hurricanes, on Jan. 28, 2006. Francis, captain dubbed “Ronnie Franchise,” saw his No. 10 – the jersey number in Connecticut and Carolina – raised high above the arena.

Earlier this year, NHL Commissioner Gary Bettman was quoted by USA Today as saying "Peter may sell, he may not sell.  He may sell all of it. He may sell some of it. He may sell none of it. There's no formal sale process going on. There's no imperative for the franchise to be sold on any immediate basis, and the franchise is not moving.”

Within weeks of those comments, Gov. Malloy and Hartford Mayor Luke Bronin made a play for the Brooklyn-based New York Islanders, rumored to be seeking a new home due to spotty attendance at the home they share with the Brooklyn Nets.  Those hopes were dashed last month when the team announced they planned to stay in New York, and are considering plans for a new hockey arena on Long Island or in Queens near Shea Stadium.

That effort caught the interest of data-guru Nate Silver, founder and editor of FiveThirtyEight.com, who revived his 2013 study that noted the Hartford-New Haven media market is the largest in the U.S. without a “big four” sports franchise.  He estimated that about 175,000 avid NHL fans live in the Hartford-New Haven metro area. “That sounds bad, though it’s comparable to or slightly better than some of the lower-tier American NHL markets, including Columbus, Raleigh-Durham, Miami and Nashville (and better than Las Vegas, where the NHL is expanding). Furthermore, there’s potentially room for growth. According to our estimates, 7 percent of adults in the Hartford metro area were avid NHL fans in 2013. But the percentage is 13 percent in the New York metro area and 17 percent in the Boston metro area.”  Sliver added that “If the Islanders or another team were to relocate to Hartford, the numbers would probably improve.”

Gale’s proposal: “What if all 38 towns in the Capitol Region Council of Governments banded together to buy the franchise and brought it back to Hartford? Grand lists are representative of the respective wealth of each town. So, the 38 towns would each pay a portion of the purchase price of the Whalers hockey team based on their percentage of the total grand list of all 38 towns. The average per capita cost for all 38 towns is $274 per person.”

In the Whalers’ final season in Hartford, 1996-97, attendance at the Hartford Civic Center had grown to 87 percent of capacity, with an average attendance of 13,680 per game.  Published reports suggest that the average attendance was, in reality, higher than 14,000 per game by 1996-97, but Whalers ownership did not count the skyboxes and coliseum club seating because the revenue streams went to the state, rather than the team.  Attendance increased for four consecutive years before management moved the team from Hartford. (To 10,407 in 1993-94, 11,835 in 1994-95, 11,983 in 1995-96 and 13,680 in 1996-97.)

Carolina’s average home attendance during the just-concluded 2016-17 season was 11,776– the worst in the 30 team league. That was a drop from the 2015-16 average of 12,203, which was lowest in the NHL that year as well.

ESPN reported last year that the Whalers Booster Club remains visible, and Whalers gear continues to sell briskly, in and beyond the Hartford region.

"We always march in Hartford's St. Patrick's Day parade," said Joanne Cortesa, the club's president.  "And every time we hear people chanting, 'Bring 'em back, bring 'em back!' Every place we go, it's 'Bring 'em back!'"

"It's probably not going to happen next week or next month," Bronin told ESPN. "But we'd certainly welcome having the NHL return to Hartford."

Edible Arrangements, Subway Take Steps Forward and Back in Roller-Coaster Economy

Two of Connecticut’s leading food franchise success stories - Edible Arrangements and Subway – have both been in the news in recent days, seemingly moving in opposite directions.  Subway, for the first time in memory, is reducing the number of franchises across the country, while Edible Arrangements is in the midst of extending its brand, as its founder has taken back control of the equity in the business. Subway dropped 359 U.S. locations in 2016, the first time that Subway has had a net reduction. The store count dropped 1.3 percent to 26,744 from 27,103, but Subway remains the nation’s most ubiquitous eatery. (Behind only McDonald’s in sales.) Sales at Subway franchises fell 1.7 percent last year to about $11.3 billion, according to published reports. Subway is still growing internationally, with sales outside the U.S. increasing 3.7 percent to $5.8 billion last year, as the company continued to open locations.

Subway was founded about 52 years ago by Fred DeLuca and Peter Buck in Bridgeport. DeLuca died in 2015, leaving the company in the hands of his younger sister, Suzanne Greco, who became chief executive officer. The chain’s restaurants are entirely owned by franchisees.

Since its founding in 1999 in East Haven, Edible Arrangements has grown to more than 1,300 locations worldwide. Tariq Farid developed a "healthy obsession with fruit," and used his experience in the floral industry insight to develop a new business concept: fruit bouquets. Edible Arrangements began franchising in 2001, according to the company website.

Farid has completed a buyback of equity of the company which had been held by Greenwich private equity firm L Catterton.  The company has entered into a strategic partnership with L Catterton in June of 2012. Farid said the relationship provided assistance during a key growth phase for the brand, a time in which Edible Arrangements expanded into offering fresh fruit smoothies, froyo fruit blends, chocolates and more.

“The timing was right to take back full ownership so that I could be more fully engaged in building the future of the brand with our franchisees," Farid said, adding that "Edible Arrangements finds itself well-positioned for a future that includes exciting new opportunities for our franchises and the brand.”

Edible Arrangements has launched a system-wide conversion of traditional stores to a "whole-store" experience in the Edible To Go platform, featuring fresh fruit smoothies, froyo fruit blends and other fresh fruit treats. The company is coming off a year in which it registered a 27 percent increase over the previous year in both the number of new store openings and signings of new franchise agreements. It was named in Entrepreneur's Top 40 of "Fastest Growing Franchises" and "America's Top Global Franchises" as well as being included among the "Inc. 5000" list of the fastest growing privately-held companies.

"This is an exciting time to be a part of Edible Arrangements," Farid said. "At heart we are really a family of small businesses that have enjoyed incredible growth through a shared passion and willingness to work together towards common goals. Now we can focus all our energy on working together on the next evolution of the Edible Arrangements brand."

Edible Arrangements is headquartered in Wallingford; Subway is headquartered in Milford.

Local College Students Selected by US State Department for Intensive Foreign Language Training

Four University of Bridgeport students have been awarded U.S. Department of State Critical Language Scholarships, among the most competitive in the field, to spend the summer abroad at intensive language programs. The Critical Language Scholarship (CLS) program is part of a U.S. government effort to dramatically expand the number of Americans studying and mastering foreign languages deemed to be of particular importance. They include but are not limited to: Arabic, Azerbaijani, Chinese, Persian, Russian, and Urdu.

Students Ana Rena, Justin Sabo and Fernando Gonzalez have been accepted into the Arabic language study program at a site still yet to be determined in the Middle East.  According to the State Department’s website, Arabic is taught in Amman, Jordan; Meknes, Morocco; Tanfier, Morocco; and Ibri, Oman.

UB student Sung Soon Gavel won a CLS to study Korean at Chonnam National University in Gwangju, South Korea.  The CLS Korean Program in Gwangju, Korea provides students opportunities to learn Korean both inside the classroom and in an immersive cultural setting during an intensive 8-week language program set in Korea’s sixth-largest city located just south of Seoul. Students receive a minimum of 20 hours per week of classroom instruction where they learn the four major skills of speaking, listening, reading and writing in Korean.

CLS Program institutes at 24 locations around the world cover approximately one academic year of university-level language coursework during an eight- to ten-week program and are designed to meet the needs of students from a variety of language levels and backgrounds.

The scholarships are highly competitive; just 10 percent of students who apply to the program are awarded one. But since 2011, eight University of Bridgeport students, including the four 2017 winners, have won them.

“As an application evaluator for the Critical Language Scholarships, I can confirm that the pool of applicants to the program include some of the nation’s brightest students at leading universities across the country. So having one CLS winner, or even having students make it to the final rounds, would be worthy of celebration. The fact that four were granted awards is a phenomenal testament to our students’ hard work.  They make us very proud,” said Brandon LaFavor, director of UB Education Abroad Resource Center.

Formal classroom language instruction is provided for a minimum of 20 hours per week. Extracurricular activities are designed to supplement the formal curriculum, including regular one-on-one meetings with native speaker language partners for conversational practice, as well as cultural activities and excursions designed to expand students’ understanding of the history, politics, culture and daily life of their host country.

In past years, students from institutions including University of Connecticut, Connecticut College, Trinity College, Wesleyan University, Quinnipiac University and Central Connecticut State University have also been selected to participate.  Most recently, a UConn student was selected to learn Hindi in India in 2016, and two Wesleyan students were selected last year to learn Russian and Hindi.

The Critical Language Scholarship Program is a program of the United States Department of State, Bureau of Educational and Cultural Affairs. CLS is administered by American Councils for International Education.

This year’s group of Critical Language Scholars from UB are all enrolled at the College of Public and International Affairs (CPIA) at the University. The school’s six undergraduate and four graduate programs groom students in fields related to diplomacy, including international security and global development. CPIA alumni have gone on to work for the FBI, the Department of State, Defense Department, United Nations, Council of Europe, as well as global NGO’s (non-governmental organizations) and private industry.

https://youtu.be/WUhZlih7hls

Survey Says: Hartford Is Among Nation’s Top Up-and-Coming Cities

What do Milwaukee, Syracuse and Hartford have in common? They are all – believe it or not – the nation’s most notable “up-can-coming place to live,” according to a new national analysis of the top places to live in the U.S.

In calculating the second-annual ranking of the Best Places to Live in the U.S., which evaluates the 100 most populous metro areas in the country based on qualities that Americans care about most, U.S. News looked at affordability, employment opportunities and the overall quality of life in each place.  Hartford’s ranking jumped from number 59 a year ago to number 31 this year, among the largest leaps of any city in the nation.

The leading reason cited by the publication is the increase in jobs.

"The Hartford region has seen some strong employment growth in a number of high-productivity sectors, including professional, technical services, education and health services," said Alissa DeJonge, vice president of research at the Connecticut Economic Resource Center.

The types of job opportunities that are available in the Hartford area tend to pay well, the publication points out, “with residents earning nearly $57,000 per year on average, which is significantly more than the average American's salary of $48,320 per year. United Technologies Corp. provides employment to residents in the manufacturing and engineering sectors, and the region is home to some of the country's largest financial institutions, including Aetna Inc. and the Hartford Financial Services Group.”

"Hartford is known as the 'insurance capital' of the U.S., a title substantiated with Connecticut ranking No. 1 in the U.S. for insurance employment per capita, with many of those employers located in the Hartford region," added Susan Winkler, executive director of Connecticut Insurance and Financial Services. "Connecticut is also home to the highest concentration of actuaries – many located in the Hartford region."

The U.S. News review also notes that the region features a diverse selection of restaurants and cultural attractions. Paul Pita, CEO and executive creative director of Hartford-based digital marketing firm The Pita Group, told U.S. News "Hartford is a great place to live because residents have access to what they need: great options for housing, great educational options and a wide variety of lifestyle options for food, arts, culture, entertainment and outdoor activities."

Syracuse moved from #53 to #28, and Milwaukee climbed from #72 to #47.  The top 10 places to live in the U.S., according to the rankings, are Austin, Denver, San Jose, Washington D.C., Fayetteville, Seattle, Raleigh/Durham, Boston, Des Moines, Salt Lake City and Colorado Springs.  Portland, Maine ranked #26 and Albany ranked #30, just ahead of Hartford.  New Haven ranked #81 in the top 100.

The metro areas included in the rankings were evaluated by U.S. News using data from sources including the United States Census Bureau, the Federal Bureau of Investigation, the Department of Labor and U.S. News' own internal resources. This data was categorized into five indexes – Job Market (including salary and unemployment rates), Value Index (including cost of living), Quality of Life Index (including education, crime, commuting, and health care), Desirability Index, and Net Migration - and then evaluated using a methodology determined by Americans' preferences. The percent weighting for each index was determined by the answers to a public survey in which people from across the country voted for what they believed was the most important thing to consider when thinking about moving, according to U.S. News.