CT Voter Turnout Appears Highest for a Gubernatorial Race Since 1990
/In the early 1990’s, voter turnout in Connecticut’s gubernatorial elections reached 68.2 percent in 1990 and 65.1 percent in 1994. Turnout hasn’t reached that high level in the state’s quadrennial gubernatorial elections since – until Tuesday. The Office of Secretary of the State is reporting, as of Wednesday night, that statewide voter turnout was 66.9 percent. If that turnout percentage stands, it would be the highest turnout in a race for Governor in nearly three decades, since 1990.
 The strong turnout percentage this year is underscored by the fact that the number of registered voters is considerably larger. As of Nov. 2 – not including those individuals who registered and voted on Election Day – the number of registered voters in Connecticut was 2,165,045, according to the Office of Secretary of the State. Back in the ‘90’s, the list of registered voters hovered between 1.7 million and 1.8 million. This year’s election brought a higher percentage of voters to the polls from a larger list of individuals registered to vote.
Voter turnout – the percentage of registered voters who actually vote – was 56.6 in 1998, 56.5 in 2002 when there were 1.8 million registered voters, and 59.8 in 2006 when the voter rolls reached 1.9 million.
The 1990 race featured well-known, high profile candidates for Governor – former U.S. Senator Lowell Weicker, Congressman Bruce Morrison and Congressman John Rowland. The race was won by Weicker, running as a third party candidate. Rowland would go on to win the office four years later, when voter turnout was somewhat lower.
In 2006, when the Connecticut voters considered their choices in a gubernatorial match-up between Gov. Jodi Rell and New Haven Mayor John DeStefano, a U.S. Senate race that featured Sen. Joe Lieberman, Democratic candidate Ned Lamont and republican Alan Schlessinger was also on the ballot drawing considerable interest. Turnout that year reached 59.8 percent.
In 2010, Democrat Dannel Malloy won his first term as Governor, defeating Republican Tom Foley by the relatively narrow margin of 6,404 votes. A third party candidate, Tom Marsh, received 17,629 votes. Voter turnout that year was 57.4 percent.
Voter turnout is consistently higher in presidential election years. In 2016, for the Donald Trump – Hillary Clinton contest, the voter turnout in Connecticut was 76.9 percent. It had been slightly higher in 2008, when Barack Obama was on the ballot here for the first time, at 78.1 percent.
The number of people registered to vote also tends to surge in presidential election years. In 2016 in Connecticut, the voter list included 2.1 million residents. This year’s voter registration numbers, just prior to Election Day, were closing in on that total.
This story was updated at midnight Wednesday to reflect latest turnout percentage provided by the Office of Secretary of the State, which increased slightly throughout the day as additional information was provided by municipalities.

 e the community a better place.”

 That shift of political influence has ramification across the electoral system, and was the impetus for a lawsuit filed this summer against the state of Connecticut by the NAACP to force an end to the practice. It is the first of its kind, and being widely watched.

 American Innovation $1 coins, to be issued at a rate of four new coins per year, will bear a reverse image or images emblematic of a significant innovation, an innovator, or a group of innovators from each of the 50 states, the District of Columbia, and the territories of the United States. Published reports indicate that the $1 coins would sell for more than face value — up to $1.32 — providing a healthy profit for the federal government since the coins cost less than 35 cents to make.

 Her work at C-CHANGE is designed to accelerate and strengthen public education on climate change and pollution issues, bringing the science down to the individual level, highlighting the impacts on people, rather than the planet.

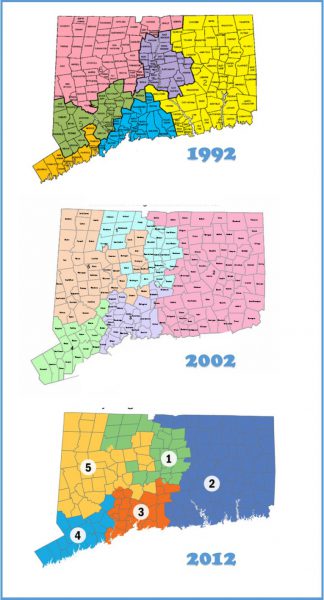
 Using a dataset on the compactness of U.S. House districts—with multiple measures generated by geographic information system (GIS) analyses over two redistricting cycles, UConn Associate Professor Jeffrey Ladewig estimated the effects of congressional district compactness on electoral turnout. The conclusion: compactness matters. The