Greater Hartford Grows as Regional Workforce Ecosystem

It may not be widely recognized, but the Greater Hartford area has become a dynamic, participatory, collaborative regional ecosystem.  And during National Workforce Development Week, which is celebrated nationally this week, that is an especially salient development. What exactly does that mean?  First, the definition: any time that partners within a region come together to solve problems, and meet regularly to answer new challenges, a regional ecosystem in is play.  An “ecosystem” is defined as a system, or a group of interconnected elements, formed by the interaction of a community of organisms with their environment. A “Regional Ecosystem” is just that –specific to a geographic region. WkDevWeek

In North Central Connecticut, the regional ecosystem is helping business grow, and find the talent they need, and it is affecting the greater welfare of society, even in these extremely challenging times with budget deficits, and economic pressures that abound.  So says Thomas Phillips, President and CEO of Capital Workforce Partners, among the drivers of progress underway across the 37-town region.

Regional ecosystems are like a chain of links, he explains, with each link playing a key role in holding the work together.  “In workforce development – the regional ecosystem is comprised of strategic partnerships with industry, education, economic development, community organizations, labor and business-led workforce boards – leading programs that are nimble, flexible, adaptable and generating economic opportunity for business and job seekers.”

Among the leading examples of the local regional ecosystems - focusing on workforce development - which use a set of common goals and outcomes:

  1. MoveUp! – a regional ecosystem addressing the challenges relating to adult literacy, with 26 partners working collectively
  2. Opportunity Youth – a regional ecosystem addressing the challenges of reconnecting out-of-work, out-of-school youth to education, training and careers, with over 50 partners and funders working collectively
  3. Best Chance – a regional ecosystem addressing the challenges of returning citizens – finding sustainable employment for former offenders, with 15 partners working collectivelyworkforce ecosystem
  4. The Hartford Coalition on Education and Talent (soon to be renamed) – a regional ecosystem designed to help more youth complete post-secondary education while closing the gap experienced by employers, with 8+ partners working collectively. “Be on the lookout for the work this group is doing – building pathways of success for the youth in our region,” says Paul Holzer, President of Achieve Hartford, spearheading this effort.
  5. The Knowledge Corridor – a region that crosses the Connecticut and Massachusetts border, this area is also a home to a robust regional ecosystem that includes 64,000 businesses, 41 colleges and universities, a labor force of 1.34 million and an international airport.

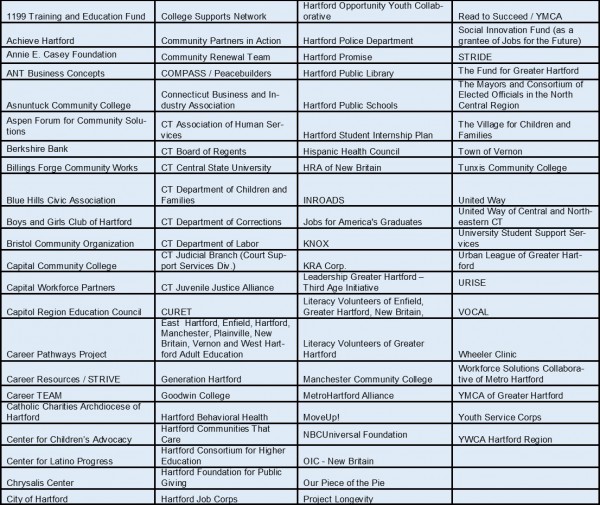
The organizations involved - scores of them - range from well-known names, such as Leadership Greater Hartford, Literacy volunteers, Capitol Region Education Council and the Hispanic Health Council, to those lesser known but just as vital.

“As ‘conveners,’ workforce development boards are often the ‘clasp’ of the chain, keeping all the links together, moving with changes in time,” says Phillips. “That means workforce development, economic development and education are responding collectively to work together toward sustainable jobs, talent creation and business growth.”

The number of organizations that collaborate continues to grow, with different organizations playing a lead role in select initiatives.  But there is definitely strength in numbers, they point out.cwp_logo_large

At the national level, officials note, the U. S. Conference of Mayors (USCM), Workforce Development Council is spearheading an effort to help each region have better access to best practices in building strong regional ecosystems.  The organizations is also working toward building more consistent communications and program focus that is designed to result in better outcomes.

That can best be accomplished region-by-region –addressing local area needs with locally based organizations.

Andrew McGough, Executive Director of the Portland, Oregon Workforce Development Board and Chair the USCM Workforce Development Committee, stresses that “Business-led local workforce boards lead the system through strategic partnerships with industry, education, community organizations, and labor, resulting in greater effectiveness and efficiency in serving businesses and job seekers in our communities.”

The Capital Workforce Partners website includes a list of participating community organizations.

community partners

Meriden Re-Make Continues, Spurred by State Support; Additional Funds Sought to Implement Plan

The City of Meriden is seeking $2 million from the State of Connecticut to improve six roadway sections in downtown Meriden, to improve traffic flow, improve accessibility and increase safety for vehicles, bicyclists and pedestrians traveling within Meriden’s Transit Oriented Development (TOD) zoning district. The grant application is the latest effort as part of the city’s “Meriden 2020 Bringing It Together” initiative, which is focused on transit oriented development to recapture the luster of the “Silver City”  and has received a steady flow of state funds in recent months to boost the effort.

The roadway sections - including Colony Street, West Main Street, State Street, Perkins Square/South Colony and East Main Street - were selected and analyzed for improvements in prior studies and investigations.  The initiative is an outgrowth of a two State of Connecticut TOD Pilot grants, a US Dept. of Housing and Urban Development (HUD) Sustainable Challenge grant and a HUD Choice Neighborhoods Planning grant.Hub_site_Feb_2016

A website, meriden2020.com, highlights the numerous efforts underway to redevelop the city’s central business, including ways to resolve historic flooding issues, repurpose underutilized brownfield sites, remake the rail station area into a modern transportation center, and provide links to the regional trail system.

Meriden’s Transit Oriented Development program seeks to “transform the Meriden Transit Center (MTC) and the half-mile area around it into a vibrant neighborhood that includes new residential and commercial development, public spaces and improved access to public transportation.” Construction of the new transportation center is underway, and local officials recently initiated a study to examine planned ridership and usage by area residents and businesses.

Last week, the Connecticut Housing Finance Authority (CHFA) and Department of Housing (DOH) announced approval funds meriden
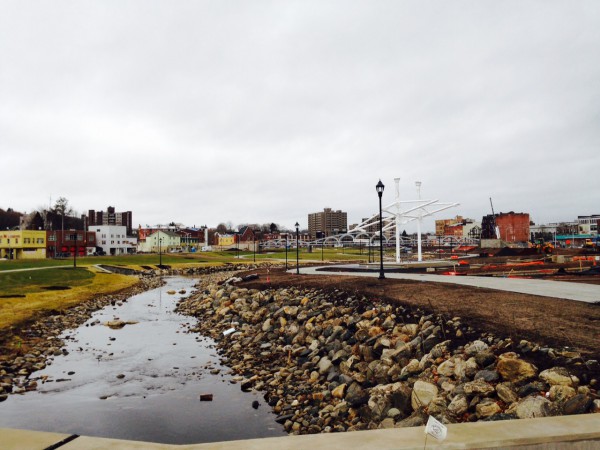
for a proposed mixed use development project at 161-177 State Street, which is phase one of a multi-phase project that includes demolition of the Mills public housing project and implementation of the Harbor Brook Flood Control project north of the Hub site.   The new building will be within walking distance of Meriden`s new Transit center.

The proposed project will have 75-units of mixed-income family housing, with ground level retail space and a preschool. The property will include eight supportive units and 60 units targeted for households with incomes of 60 percent or less of Area Median Income (AMI). In addition, 26 of the 60 units will be supported by project based Section 8.

sealsIn February, the Connecticut Small Business Development Center (CTSBDC), the City of Meriden and The Midstate Chamber of Commerce announced the opening of the newest CTSBDC office, to be located at Meriden City Hall.

The new office is offering professional, confidential business advising to entrepreneurs in every stage of business and all industry sectors in the City of Meriden. “This beneficial partnership between the Connecticut Small Business Development Center and the City of Meriden ensures that entrepreneurs of the city have access to the necessary resources available to assist with starting or growing their business. This allows for economic growth and job creation in this area,” said CTSBDC State Director Emily Carter. CTSBDC also has a “virtual” location at the Meriden Public Library, where individuals can connect with CTSBDC advisors online.

In January, Meriden was awarded $100,000 in state funds to further revitalization and redevelopment in the TOD and Choice Neighborhoods target areas. The funding came through the state Department of Economic and Community Development (DECD) Brownfield Area-Wide Revitalization (BAR) Grant program, a year-old state pilot program that encourages communities to consider areas such as neighborhoods, downtowns, waterfront districts, or other sections with multiple brownfields and develop strategies to assess, clean up, and reuse the parcels for business, housing, and public amenities that will generate jobs and revenues and revitalize the entire area.Transit Center

Weeks later, the Department of Economic and Community Development awarded the Meriden a $2 million grant for the demolition and remediation of the Mills Public Housing Complex.  The city plans to demolish the structures at 144 Mills Memorial as a prerequisite to implementing the Harbor Brook Flood Control Plan at the site.  While the 144 Mills Memorial site will be used for flood control purposes and will not be used for development, officials say the construction of the flood control plan at the site will allow for development to proceed at the adjacent sites, which include the Meriden Hub Site (located at 1-77 State Street) and at the Mills Megablock site (located at 161-177 State Street and 62 Cedar Street).

Meriden officials point out that commuter rail service to Hartford and New Haven is scheduled to begin later this year.  The new commuter rail service is expected to spur significant “transit oriented development” in the city center.  Once the rail service is operational, nearly 140,000 workers located within one mile of a rail station will be able to commute to Meriden within a 40-minute ride, the website points out.

West Hartford’s Newly Developed Complete Streets Policy is #2 in the Nation for 2015

West Hartford’s Complete Streets policy, adopted in 2015, has been named the second best new policy in the nation by Smart Growth America and the Complete Streets Coalition. The coalition highlighted 16 communities nationwide for their outstanding new policies, among 82 communities that adopted Complete Streets policies during the year.  Nationwide, there are now a total of 899 Complete Streets policies in place in all 50 states, the organization announced this month. A Complete Streets approach creates an integrated transportation system that supports safe travel for people of all ages and abilities. This approach redefines what a transportation network looks like, which goals a public agency sets out to meet, and how communities prioritize their transportation spending. A Complete Streets policy is one of the best ways to set this approach into motion, Smart Growth American emphasized.

TOP 10 LIST
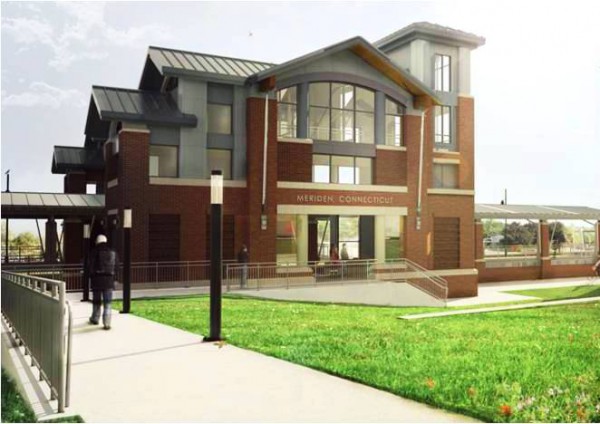
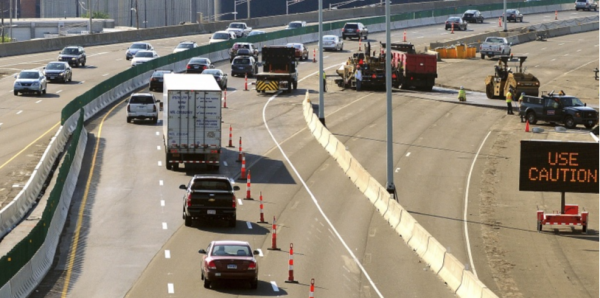
The U.S. Surgeon General and Secretary of Transportation both spoke out for more Complete Streets last year and Congress passed a transportation bill that included Complete Streets language for the first time ever.

The Complete Streets laws, resolutions, agency policies, and planning and design documents establish a process for selecting, funding, planning, designing, and building transportation projects that allow safe access for everyone, regardless of age, ability, income or ethnicity, and no matter how they travel.

Across the country, 32 state governments or agencies, 76 regional organizations, and 663 individual municipalities have all adopted such policies to create safer, multimodal transportation networks.

West Hartford’s policy is the result of a process that began in 2009 with the adoption of the Town’s 2009-2019 Plan of Conservation and Development,” according to town Deputy Mayor Shari Cantor.  She said the plan “promote[s] an integrated and balanced “complete street” transportation system which provides the best possible service, mobility convenience and safety while reinforcing a positive social, economic, and environmental influence on West Hartford.report

“Utilizing a comprehensive public participatory process, guided by the leadership of the Town Council; the advocacy efforts of various community groups in West Hartford including our Bicycle Advisory Committee, and the work of our Town staff; we were able to develop and adopt this tremendous Complete Streets Policy,” said Mrs. Cantor in response to the national recognition.

Each year, the National Complete Streets Coalition analyzes newly passed Complete Streets policies. The Coalition examines and scores policy language using the guidelines laid out in our ideal policy elements. Ideal policies state a community’s vision for transportation, provide for many types of users, complement community needs, and establish a flexible project delivery approach. Different types of policy statements are included in the Coalition’s review, including legislation, resolutions, executive orders, internal policies, and policies adopted by an elected board.

The Coalition ranks new Complete Streets policies to celebrate the people who developed exceptional policy language and to provide leaders at all levels of government with examples of strong Complete Streets policies.

Sixteen agencies led the nation in creating and adopting comprehensive Complete Streets policies in 2015. Topping the list, with the first-ever score of 100, was Reading, PA, followed by West Hartford, Park Forest, IL and South Bend, IN.  Four of the next seven slots went to communities in Massachusetts:  Longmeadow, Weymouth, Ashland, Natick and Norwell.  The others were Omaha, NE and Incennes, IN.

Of the 663 municipalities with Complete Streets policies, 239 (or 36 percent) are suburban communities. Small towns, often in rural areas, have passed 111 policies, or 17 percent of all municipal policies. On the other end of the spectrum, 12 of the 15 most populous cities in the country have committed to Complete Streets with a policy, according to the organization’s 2015 report. Blue_Back_Square_in_West_Hartford,_Connecticut,_August_10,_2008

“A Complete Streets approach is about helping everyone stay safe on the road—no matter if they’re walking, biking, taking transit, using an assistive device, or driving,” said Emiko Atherton, Director of the National Complete Streets Coalition. “Passing a Complete Streets policy is one of the best actions communities can take toward achieving these goals.”

Connecticut became the 10th state in the nation to adopt a Complete Streets law, in 2009.  The law mandates “accommodations for all users shall be a routine part of the planning, design, construction and operating activities” of all state highways. Connecticut’s Complete Streets law has evolved, and now (Conn. Gen. Stat. §13-153f) requires pedestrians, cyclists, and transit users to be routinely considered in the planning, designing, construction and operation of all roads.

In 2014, Bike Walk Connecticut released a first-of-its-kind ranking of the state’s cities and towns on how bike- and walk-friendly they are. Simsbury (1), New Haven (2), New Britain (3), Glastonbury (4), and Middletown (5) claimed top honors as the five most bike- and walk-friendly communities.

Esga-logoarlier this year, the University of Connecticut released a study that shows how shared space, a design concept that encourages all users to share street space, can provide much greater vehicular capacity than conventional intersections and increases pedestrian convenience. The study found that by redesigning streets and intersections as human-scaled places and incorporating shared space concepts, communities of all sizes have successfully encouraged active transportation, stimulated their local economies, reduced accident severity, and lessened their environmental impacts. The study compared actual user delays at six shared space intersections to expected user delays using standard U.S. traffic modeling software.  The state Department of Transportation issued a policy document in 2014 consistent with the law.

The criteria used in the Complete Streets evaluation include:

  1. Vision: The policy establishes a motivating vision for why the community wants Complete Streets: to improve safety, promote better health, make overall travel more efficient, improve the convenience of choices, or for other reasons.
  2. All users and modes: The policy specifies that “all modes” includes walking, bicycling, riding public transportation, driving trucks, buses and automobiles and “all users” includes people of all ages and abilities.
  3. All projects and phases: All types of transportation projects are subject to the policy, including design, planning, construction, maintenance, and operations of new and existing streets and facilities.
  4. Clear, accountable exceptions: Any exceptions to the policy are specified and approved by a high-level official.
  5. Network: The policy recognizes the need to create a comprehensive, integrated and connected network for all modes and encourages street connectivity.
  6. Jurisdiction: All other agencies that govern transportation activities can clearly understand the policy’s application and may be involved in the process as appropriate.
  7. Design: The policy recommends use of the latest and best design criteria and guidelines, while recognizing the need for design flexibility to balance user needs in context.
  8. Context sensitivity: The current and planned context—buildings, land use, transportation, and community needs—is considered in when planning and designing transportation solutions.
  9. Performance measures: The policy includes performance standards with measurable outcomes.
  10. Implementation steps: Specific next steps for implementing the policy are described.

The National Complete Streets Coalition, a program of Smart Growth America, is a non-profit, non-partisan alliance of public interest organizations and transportation professionals committed to the development and implementation of Complete Streets policies and practices. A nationwide movement launched by the Coalition in 2004, Complete Streets is the integration of people and place in the planning, design, construction, operation, and maintenance of transportation networks.

national chart

CT Ranks As 7th Greenest State in the Nation, Analysis Says

Earth Day 2016 – celebrated on April 22 – will be observed in communities throughout Connecticut this weekend, against the backdrop of a new state-by-state analysis that ranks Connecticut as the 7th “greenest” state in the nation. WalletHub’s analysts compared the 50 states across three key dimensions: 1) Environmental Quality, 2) Eco-Friendly Behaviors and 3) Climate-Change Contributions, including 17 key metrics that “speak to the health of the current environment as well as the environmental impact of people’s daily habits.”

Topping the list were Vermont, Washington, Massachusetts, Oregon, Minnesota, Maine, Connecticut, New York, New Hampshire and New Jersey.  The data set ranges from “Total Municipal Solid Waste per Capita” to “Energy Efficiency Score” to “Carbon Dioxide Emissions per Capita.”top 10

Connecticut’s highest ranking in the individual categories was in Water Quality, where the state ranked first.  Other top finished include Energy-Efficiency (6th), Carbon Dioxide Emissions per Capita (6th), and Gasoline Consumption per Capita (12th).

The state ranked in the middle-of-the-pack in Percent of the Population Not Driving to Work (22nd), Air Quality (24th) and Percentage of Recycled Municipal Solid Waste (25th).

In the three overall categories, Connecticut ranked 2nd in Climate Change Contributions, 5th in Environmental Quality, and 23rd in Eco-Friendly Behavior.

At the bottom of the WalletHub ranking were Oklahoma, Nebraska, West Virginia, Montana, North Dakota and Wyoming.


usa map rankings


Greater Hartford Residents Prefer Focus on Vibrant Communities Over Recruiting Businesses

In a time of reduced resources and stark choices for policy makers, a survey of Greater Hartford residents suggests that investments aimed at creating vibrant communities, with the focus on local schools, transportation options, walkable, attractive physical environment is preferred to devoting greater resources to recruiting employers. In a survey for the Hartford Foundation for Public Giving as part of the Metro Hartford Progress Points effort, and conducted by Inform CT, residents of Hartford and Tolland County, by 57 percent to 43 percent, said that investing in communities was a better approach than recruiting businesses.HartfordFoundation

The findings reaffirm one of the key goals in the new three-year strategic plan of HFPG, launched earlier this year, developing vibrant communities.  The plan states that “All of our region’s residents should have the opportunity to live and contribute to strong, safe vibrant communities,” and calls for a “focus on people and places with the greatest need by engaging and supporting partners who promote meaningful civic engagement, safe affordable housing, quality health and mental health care and a rich diversity of cultural and other experiences to improve the quality of life.”

map
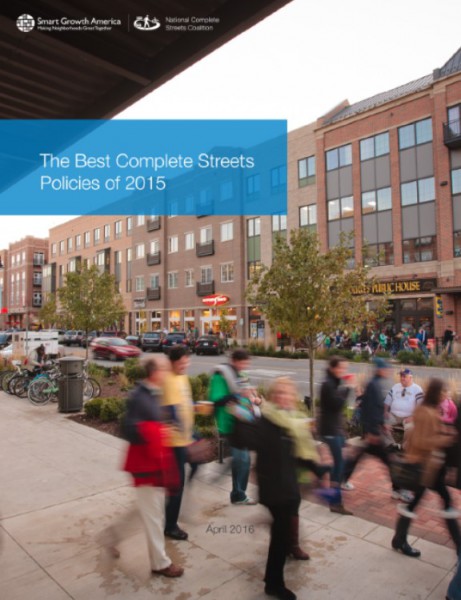
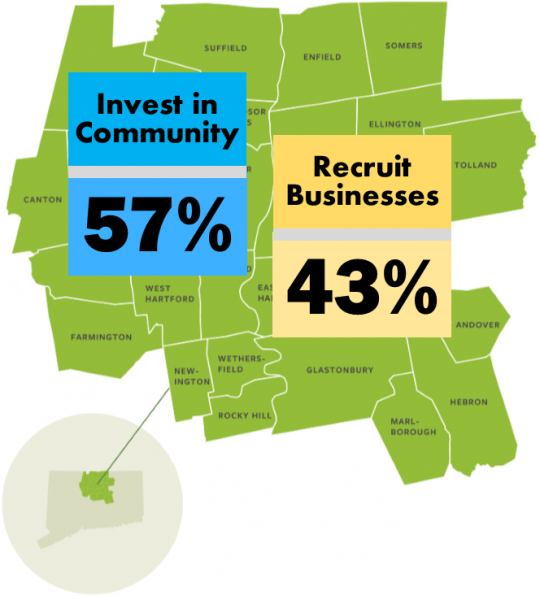
The data from the survey reflect a difference of opinion among older residents of the region.  Individuals over age 46 took the opposite view from younger residents, with a majority expressing a preference for spending skewed toward recruiting companies.   The reversal was dramatic, with two-thirds of those age 36-45 preferring investing in communities, by a margin of 67%-33%, and individuals age 46-55 expressing a preference for resources to be aimed at recruiting companies, with two-thirds holding the opposite view, 63%-38%.

Across all age groups, a majority of homeowners preferred that the emphasis be on vibrant communities, 52%-48%, and an even larger majority of respondents who are not homeowners, 64%-36%, shared the same view.

The preference for policy to be targeted more towards assuring vibrant communities than recruiting companies was consistent across a majority of respondents of various education levels and among white, black and Hispanic residents of the region, according to the survey.  A majority of survey respondents who are currently employed full-time, as well as those working part-time, and those unemployed all expressed a preference for investing in communities rather than recruiting companies.

The Greater Hartford survey results are not inconsistent with data gathered elsewhere.  A March 2014 national survey by the American Planning Association (APA) found that Millennials and Baby Boomers want cities to focus less on recruiting new companies and more on investing in new transportation options, walkable communities, and making the area as attractive as possible. The national survey found that 65 percent of all respondents and 74 percent of millennials believe investing in schools, transportation choices and walkable areas is a better way to grow the economy than investing in recruiting companies to move to the area, according to the APA.mhppLogo

A 2013 study in Michigan, posing similar questions, brought similar results.  In the statewide survey, 64 percent of Michigan citizens said they believed the most important thing state government can do for job creation is to “provide quality education, good roads and transportation, good public services like safety, water, fire, parks and libraries that create an environment in which people want to live, work and run a business.”  This contrasts with 29 percent who said the most important thing state government can do is to “cut taxes for individuals and businesses.”

Earlier this month, at the annual Municipal Collaboration Summit organized by the Hartford Business Journal, one of the session’s was devoted to an exploration of “Building Vibrant Communities,” with observations from representatives of Connecticut Main Street Center, the Partnership for Strong Communities and the Connecticut Economic Resource Center.

The Hartford Foundation for Public Giving serves 29 towns, hundreds of nonprofits and more than 750,000 residents in the Greater Hartford region.  As Greater Hartford’s community foundation, HFPG brings together members of the community to “share information, understand local problems and put resources behind effective solutions.”Print

Developed by a group of key regional stakeholders, Metro Hartford Progress Points is a periodic 'check-up' to build greater understanding about issues facing the Greater Hartford community. The second edition of Progress Points, released late last year, takes a deeper look at key issues impacting our communities and how they are connected, with a particular focus on access to better schools, better jobs and stronger neighborhoods.  Along with the Hartford Foundation, partners include the Hispanic Health Council, MetroHartford Alliance, United Way of Central and Northeastern Connecticut, Urban League of Greater Hartford, Capitol Workforce Partners, Capitol Region Council of Governments, the Center for Urban and Global Studies at Trinity College and the City of Hartford.

The survey was conducted for the Foundation during the 4th quarter of 2015 by Inform CT.

Increased Municipal Burden, Disproportionate Impact on Low-Income Drivers Among Possible Effects of Highway Tolls, Report Finds

If Connecticut opts to introduce a system of tolls on the state’s roads to help fund a significant expansion of transportation infrastructure projects in the years ahead, the toll system instituted could run the risk of causing an increased use of local roadways that “could shift the burden of maintenance and congestion to municipalities,” and lower income residents in the state could be faced with “a higher burden relative to their incomes than wealthier Connecticut residents.” Those warnings to policy makers are included in an Issue Brief  by Inform CT that reviews the various tolling options and respective challenges posed.  Connecticut eliminated tolls more than 30 years ago in the aftermath of a horrific accident at the Stratford toll plaza, and state leaders have been in a “perpetual debate about whether to reinstate them ever since,” the paper points out.issue brief

With overhauling the state’s transportation system is a leading element in Governor Malloy’s agenda to boost the state’s economy, renewed attention is being paid to methods of generating sufficient revenue to support those initiatives, and to issues raised in the 2015 policy brief.  Spurred by advances in technology, the possibility of imposing a system of electronic tolls, such as those in use in other states, are among the considerations, with border tolling, distance tolling and congestion pricing among the options.

920x920The issue brief indicated that a disadvantage of a distance toll system on all limited access highways in Connecticut would be that it “could create an incentive for people to use alternative roadways. The increased use of these roadways could shift the burden of maintenance and congestion to municipalities.” The advantage would be that distance tolls “could help to more efficiently allocate the cost of these roadways to drivers who use them the most.”

In analyzing the potential impact of tolls placed at Connecticut’s borders, the policy paper notes that while such an approach would “help to ensure that out-of-state residents driving through Connecticut pay for their use of Connecticut’s roadways,” border tolls “place a disproportionate burden on residents of Connecticut who commute out-of-state to work. This burden is further amplified if we believe that, on average, these out-of-state commuters use a smaller share of the roadways than their in-state commuting counterparts.”

toll options
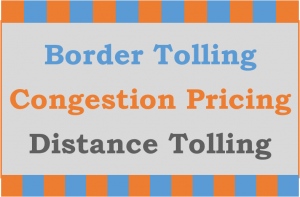
Congestion pricing, which provides for higher toll charges at peak traffic times, “helps to limit traffic on major roadways and create an incentive for people to use more environmentally friendly forms of public transportation,” the policy paper indicates.  However, a congestion pricing system “could polarize roadway use by displacing low income commuters during peak driving hours. Congestion pricing could also create displacement effects whereby the increased use of local roadways could shift the burden of maintenance and congestion to municipalities.”Print

The report suggests that “congestion pricing and distance tolls could become more affordable for low income residents if electronic payment systems were implemented that allow for income-based rate reductions.”

Earlier this year, a study panel recommended installing tolls and raising taxes in order to pay for Malloy's 30-year, $100 billion transportation program.  Legislators have said that any decision on the imposition of tolls is at least a year away, as attention focuses during the current session on establishing a method to assure that money allocated to transportation is not redirected to other areas of government.

The issue brief also stress that “a key consideration when trying to outweigh the benefits and costs of implementing tolling in Connecticut is how the revenue from the tax will be redistributed to the residents of the state.” It goes on to highlight that “as the bill stands, the monies raised would go into the Special Transportation Fund but allocation of the monies from there is not specified. The allocation of these funds is an important discussion that needs to take place before the impact of the legislation can be considered in earnest.”

InformCT is a public-private partnership that currently includes staff from the Connecticut Economic Resource Center and the Connecticut Data Collaborative. The mission of InformCT is to provide independent, non-partisan research, analysis, and public outreach focused on issues in Connecticut, and to act as the convener for fact-based dialogue and action.

CT Ranks 10th in Percentage of Structurally Deficient, Functionally Obsolete Bridges

Of Connecticut’s 4,225 bridges, 357 are structurally deficient (8.4%) and another 1,087 are functionally obsolete.  That’s 34 percent of the state’s bridges deemed deficient by experts – and it ranks Connecticut as the 10th worst state in the nation, by percentage. Worse than Connecticut?  Only Rhode Island, Massachusetts, Hawaii, Pennsylvania, Alaska, New York, West Virginia, New Jersey and Maine.  The data, compiled by the Federal Highway Administration of the U.S. Department of Transportation, reflects information and analysis through December 31, 2015. Picture4

While the number of structurally deficient bridges in Connecticut is the lowest since 2006, the number of functionally obsolete structures has climbed in recent years, and is now the highest since 2010.  The total number of bridges in the two categories has dropped in each of the past three years, but remains at about one-third of the state’s bridges.  Connecticut ranks 26th in the percentage of structurally deficient bridges.

According to the Nation Bridge Inventory Database website, Structurally Deficient is a status used to describe a bridge that has one or more structural defects that require attention. This status does not indicate the severity of the defect but rather that a defect is present. Conditions driving the designation could include the bridge deck, the superstructure or the substructure of the bridge.

The sufficiency rating is calculated per a formula defined by the Federal Highway Administration, which places 55 percent value on the structural condition of the bridge, 30 percent on its serviceability and obsolescence, and 15 percent on its essentiality to public use. According to the Iowa Department of Transportation, “a structurally deficient bridge, when left open to traffic, typically requires significant maintenance and repair to remain in service and eventual rehabilitation or replacement to address deficiencies.”

The category Functionally Obsolete is a status used to describe a bridge that is no longer by design functionally adequate for its task. Reasons for this status include that the bridge doesn't have enough lanes to accommodate the traffic flow, it may be a drawbridge on a congested highway, or it may not have space for emergency shoulders, according to the National Bridge Invencaution
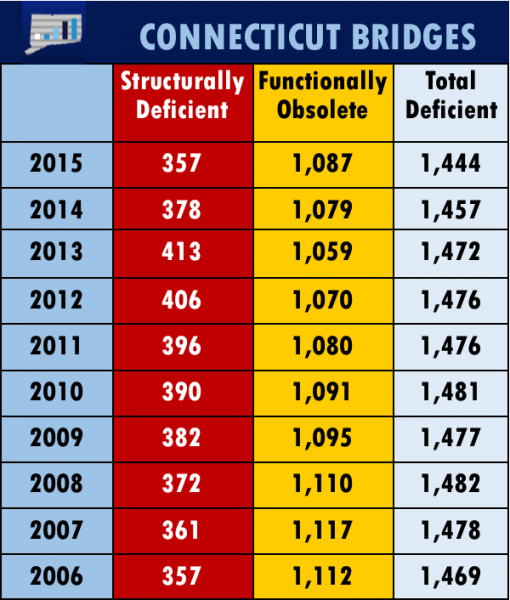
tory Database. Functionally Obsolete does not communicate anything of a structural nature – it may be perfectly safe and structurally sound, but may be the source of traffic jams or may not have a high enough clearance to allow an oversized vehicle.

A year ago, Connecticut has 378 structurally deficient bridges and 1,079 considered functionally obsolete. Two years ago, 413 bridges were defined as structurally deficient and 1,059 were listed as functionally obsolete.

A January 2016 report by the American Road & Transportation Builders Association compiled the most traveled U.S. Structurally Deficient Bridges, and identified the West River Bridge in New Haven, built in 1957, ranked as the 98th most travelled structurally deficient in the nation.  At number 110 on the list was the Yankee Doodle Bridge in Fairfield, also constructed in 1957. At number 148 was the I-95 bridge over the Wepawaug River, south of Route 121 in New Haven, built in 1958.

Also ranking in the nation’s top 200 most travelled structurally deficient bridges were the I-95 bridge in Fairfield over Route 33 at Exit 17 (ranked number 159), the I-91 Bridge over North Front Street and Quinn River in New Haven just north of I-95 (number 160), and the I-95 bridge over Byram River in Fairfield (number 161).  Those bridges were built in 1957, 1964 and 1958, respectively.

bridges by state

Most Expensive State for Car Insurance? Michigan Ranks First, CT is 17th

The most expensive car insurance rates in the nation are in Michigan.  Connecticut ranks 17th.   It is the third consecutive year that Michigan has topped the list. Connecticut’s average of $1,367 is 3 percent above the national average of $1,325.  The average rate in Connecticut jumped by 24 percent from 2015 to 2016, according to the survey.  The Connecticut data was compiled in February.  Among the New England states, Rhode Island was ranked tenth, averaging $1,608, Massachusetts ranked 21st at $1,325. Maine had the lowest rates, at $808 annually.

Insure.com’s 2016 state-by-state comparison of auto insurance premiums found that Montana captured the No. 2 spot for the second year in a row. New Jersey broke into the top five for the first time ever, Louisiana was No. 4, and Oklahoma rounded out the top five.list

On the flipside of the cost coin, Maine led the way for the cheapest car insurance in the country. Maine has been in the top three for the least expensive car insurance for all six years of the study, according to insure.com. This year, Ohio came in No. 2, Wisconsin was three, Idaho took fourth, and New Hampshire earned No. 5.

The annual study compiles rates from six large insurance carriers in 10 ZIP codes in every state. Rates were for the same full-coverage policy for the same driver -- a 40-year-old man with a clean driving record and good credit. The rates are an average for the 20 best-selling vehicles in the U.S. in order to present more accurate rates for the average driver – without high-end sports or luxury cars skewing the data. Each model was rated on its cheapest-to-insure trim level.

map
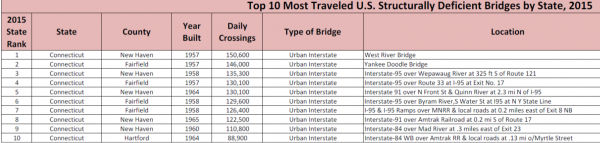
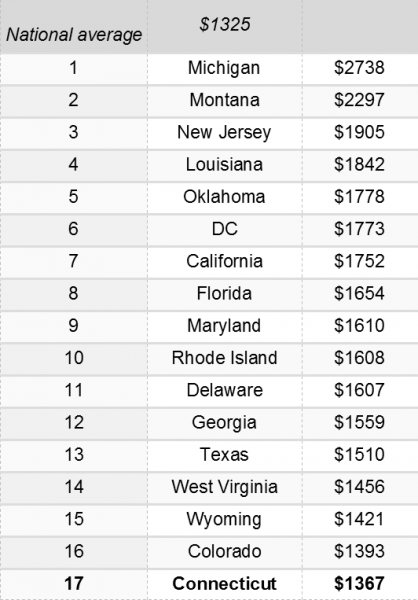
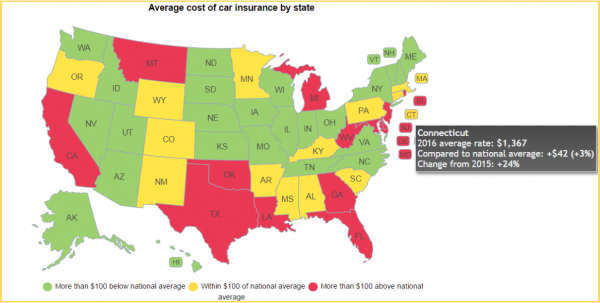
The national average for a full-coverage policy as featured in the Insure.com report came in at $1,325 this year – a slight increase from last year’s average of $1,311. Rates varied from a low of $808 a year in Maine to a budget-busting $2,738 in Michigan. Insurance rates in Michigan are more than double (107 percent) the national average.

Insurance rates are influenced by a number of different factors. Everything from traffic, crime rates, state and local laws, the percentage of uninsured drivers, as well as the number of insurance companies competing in a market can all result in higher or lower insurance premiums in your state.

Insure.com commissioned Quadrant Information Services to calculate auto insurance rates from six large carriers (Allstate, Farmers, GEICO, Nationwide, Progressive and State Farm) in 10 ZIP codes per state. Insure.com averaged rates in each state for the cheapest-to-insure 2016 model-year versions of America’s 20 best-selling vehicles and ranked each state by that average. Rates are for comparative purposes only within the same model year.

Motor Vehicle Deaths Up 14 Percent in CT in 2015, Exceeding National Average

The death toll in Connecticut from motor vehicle accidents increased 14 percent in 2015 from the previous year, consistent with a nationwide increase but higher than the national average.  The increase in Connecticut ranked the state tied for 14th in the percentage increase in motor vehicle deaths from 2014 to 2015. fatalities CT
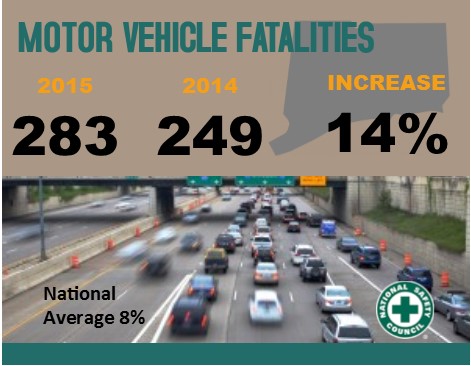
Nationally, 2015 saw the largest single-year percent increase in motor vehicle deaths since 1966. Estimates from the National Safety Council (NSC) show an 8 percent increase in 2015 compared with 2014 – with substantial changes in some states, including Connecticut.  There were 283 motor-vehicle related deaths in Connecticut last year, compared with 249 in 2014 and 276 in 2013.

While many factors likely contributed to the fatality increase, a stronger economy and lower unemployment rates are likely at the core of the trend.  The National Safety Council estimates 38,300 people were killed on U.S. roads, and 4.4 million were seriously injured, meaning 2015 likely was the deadliest driving year since 2008. The annual total of motor vehicle fatalities for 2014 was 35,398.

Over the last year at the state level, the National Safety Council estimates Vermont (30 percent), Oregon (27 percent), New Hampshire (24 percent), Georgia (22 percent), Washington (21 percent) and Florida (18 percent) experienced the largest percentage increase in fatalities, while only 13 states showed improvement. Among them were New Mexico (-20 percent), Kansas (-7 percent) and New Jersey (-2 percent).

Increases were also in Arizona (15%), Colorado (17%), Idaho (17%), Montana (17%), Maine (16%), Maryland (16%), and South Carolina (16%).  Also seeing 14 percent increases along with Connecticut were Arkansas, Minnesota, Missouri, and Nevada.  nsc_logo

“These numbers are serving notice: Americans take their safety on the roadways for granted,” said Deborah A.P. Hersman, president and CEO of the National Safety Council. “Driving a car is one of the riskiest activities any of us undertake in spite of decades of vehicle design improvements and traffic safety advancements. Engage your defensive driving skills and stay alert so we can reverse this trend in 2016.”

From 2013 and 2015, Connecticut had a 3 percent increase in traffic fatalities, according to the data.

The estimated cost of motor-vehicle deaths, injuries, and property damage in 2015 was $412.1 billion, according to NSC.  The costs include wage and productivity losses, medical expenses, administrative expenses, employer costs, and property damage.

The estimate is subject to slight increases or decreases as data mature, according to the National Safety Council. NSC has issued annual traffic fatality estimates since 1921. Over the last three years, preliminary estimates have fallen within 1 percent of final counts.

Average gas prices were 28 percent lower in 2015 than in 2014 and are projected to continue dropping this year, making driving more affordable for many Americans, NSC pointed out, noting that the U.S. Department of Transportation estimates a 3.5 percent increase in the number of miles driven in 2015 compared to 2014.

To help ensure motor vehicle accidentsafety, the National Safety Council recommends drivers:

  • Make sure every passenger buckles up on every trip
  • Designate an alcohol and drug-free driver or arrange alternate transportation
  • Get plenty of sleep and take regular breaks to avoid fatigue
  • Never use a cell phone behind the wheel, even hands-free
  • Stay engaged in teens’ driving habits, as teens are three times as likely to crash as more experienced drivers
  • Learn about vehicle safety systems and how to use them, including features such as adaptive cruise control, blind spot warning systems and backup cameras.

Founded in 1913 and chartered by Congress, the National Safety Council, nsc.org, is a nonprofit organization whose mission is to save lives by preventing injuries and deaths at work, in homes and communities, and on the road through leadership, research, education and advocacy.

Federal Transportation Funds to Increase As Connecticut Considers Long-Term Plan

As Connecticut policy makers consider a long-term infrastructure investment in Connecticut’s transportation system, they do so just months after the federal government, after years of inaction, adopted the FAST (Fixing America’s Surface Transportation) Act at year’s end.  It is the first comprehensive transportation law since 2005, according to Connecticut’s Office of Legislative Research (OLR). The act includes $225.2 billion for highway investment, $61 billion for federal transit programs, and $10 billion for the Federal Railroad Administration and Amtrak.  States will get about a 5.1 percent increase in funding in FFY 16 and annual increases ranging from 2.1 percent to 2.4 percent in subsequent years, according to OLR.fast-act

State lawmakers are considering Governor Malloy’s proposed $100 billion, 30-year Let's Go CT! program, unveiled earlier this month, which included a call to enact a constitutional amendment creating a financial lockbox to protect transportation funds. Officials have said that 47 percent of state-maintained roadways are in “less-than-good condition”, and 35 percent of Connecticut's bridges are functionally obsolete or structurally deficient.  The Connecticut Business and Industry Association has said that 42 percent of businesses think the state's road congestion hinders their opportunities and growth.

As a result of the FAST Act, Connecticut will receive about $3.5 billion over five years, or about $700 million annually, for highway and transit programs, which is about $62 million more per year than Connecticut received in 2015.  The state Department of Transportation says the act’s importance isn’t in the amount of money it provides, which does not change dramatically from previous levels, but in the predictability and assurance of funding it provides, OLR Principal Analyst Paul Frisman points out in a report to state legislators. ct usa

The FAST Act’s transfer of the $70 billion into the federal Highway Trust Fund (HTF) was essential to keep the fund solvent. The federal government has not increased the federal 18.4 cent gas tax in more than 20 years, and this has reduced the HTF’s purchasing power and reduced its ability to keep pace with rising infrastructure costs and inflation. Decreased revenues because of more fuel efficient vehicles and the popularity of alternative fuel vehicles also cloud the HTF’s future, the report indicates.  There continue to be concerns that if revenues going into the fund are not increased, insolvency may await, as soon as 2020.

The FAST Act also includes two new freight initiatives, including a National Freight Program which authorizes $6.2 billion over five years for national and state projects to improve highway freight transportation. The OLR report indicates that to participate, a state must complete a State Freight Plan, which it must update every five years. The American Road and Transportation Builders Association (ARTBA) has said that participating states will be able to obligate up to 10 percent of this funding to improve freight rail services or ports, which may be of particular interest to Connecticut.  The other new program is aimed at highway, bridge, rail-grade crossing, intermodal, and freight rail projects that cost at least $100 million, improve movement of both freight and people, reduce bottlenecks, and improve connectivity.

The FAST Act also makes changes to several highway funding programs, with a focus on surface transportation, local roads and bridges, transportation alternatives such as bicycling.  To increase efficiency and speed up the project review process, ARTBA reports that the FAST Act encourages the use of a single environmental review document throughout the entire review process, instead of the current practice of having each agency involved in a project conduct a separate review.

cars connecticutThe OLR report also indicates that a Federal Highway Administration pilot program permits up to three states to toll existing Interstate highways that they could not otherwise adequately maintain or improve, and increase funding available for public transportation initiatives.  In addition, $2.6 billion is provided to Amtrak’s Northeast Corridor (and $5.4 billion to other Amtrak lines) over five years. It separates the Northeast Corridor, from Boston to Washington, D.C, from other Amtrak accounts to ensure that the amounts assigned to that Corridor are used there, OLR reports.

Even with the additional funding nationwide, transportation officials in Connecticut and around the country continue to warn that “long-term, sustainable funding for transportation is yet to be achieved,” as described by the American Association of State Highway and Transportation Officials.