Bradley Ranks Last in Passengers’ Satisfaction Rating of 21 Mid-Sized U.S. Airports

Air travelers ranked Connecticut’s Bradley International Airport last among 21 medium-sized airports in a passenger satisfaction survey.  The airport fell from a second-to-last ranking in a similar analysis done at the end of last year, to the bottom rung of the latest ratings. Sacramento International Airport ranks highest among medium airports, with a score of 810. Indianapolis International Airport (807) ranks second, and Ted Stevens Anchorage International Airport (806) ranks third, in the survey by J.D. Power.

Bradley’s score of 742 was an improvement from 724 last year, but did not prevent the drop to the bottom of the category.  Just ahead of Bradley were Cleveland Hopkins International Airport (754) Kahului Airport (758), and San Antonio International Airport (761).  In last year’s survey, Bradley was tied for second-to-last with Kahului; Cleveland finished last.  Both passed Bradley in the latest rankings.  The medium airport average score was 781 in the survey released this month.

Connecticut Airport Authority Executive Director Kevin Dillon told the Hartford Business Journal, "We're pleased that our score has increased from last year and that our score is the highest among competing airports in the region."  He added that “we know that there are areas that need to be addressed, such as enhancing our concessions and terminal facilities. We have already introduced a number of new concessions over the last year and have made major updates to our terminal, and we have an ambitious plan for further upgrades over the coming months and years."

Nationally, overall traveler satisfaction scored a 749 out of 1,000 points, an 18-point increase from last year’s survey.  Among the nation’s largest airports, Orlando International Airport received a score of 778 out of 1,000, beating out the runner up, Detroit Metropolitan Wayne County Airport, which received a 767 score.

Newark Liberty International Airport in New Jersey received the lowest ranking among “Mega” airports, earning a score of 686. LaGuardia Airport, in New York City, ranked worst among “Large” airports, with a score of 654.

The survey ranked airports across the U.S. based on several key factors: accessibility, check-in and baggage check process, security screening, shopping, terminal facilities and baggage claim.

Airports were broken down into three categories based on size. “Mega” airports were defined as those handling more than 32.5 million annual passengers. The “large” category included airports with 10 million to 32.4 million passengers and “medium” airports, including Bradley, are those with between 3 million and 9.9 million passengers.

The J.D. Power analysis indicated that “with nearly every airport in the country dealing with challenges of high passenger capacity and ongoing construction projects to address increased demand, technology is helping to directly address these issues.”

“The trifecta of a steadily improving economy, record passenger volume and billion-dollar renovation projects unfolding in airports across the country has created a challenging environment for customer satisfaction,” added Michael Taylor, Travel Practice Lead at J.D. Power.

Now in its 12th year, the study is based on responses from 34,695 North American travelers who traveled through at least one domestic airport with both departure and arrival experiences (including connecting airports) during the past three months. Travelers evaluated either a departing or arriving airport from their round-trip experience. The study was conducted from January through August 2017.

Neighboring States Bring in Millions in Toll Revenue; CT Remains Toll Free

The Connecticut House of Representatives debated for nearly six hours the issue of reinstating tolls on Connecticut highways, but did not vote.  Connecticut remains a toll-free state, for residents and those driving through the state. How much money might the state receive in toll revenue if tolls were imposed?  The Office of Legislative Research, responding to a legislative inquiry, has surveyed neighboring states and issued a report this past week.

Toll revenue ranged from $20.4 million in FY 16 (Rhode Island) to $1.57 billion in calendar year 2016 (New Jersey), according to the legislature’s research office. In Massachusetts in FY2016, toll revenue was $395 million; in Maine $133.8 million in calendar year 2016; in New Hampshire a total of $130.7 million. 

The New York Thruway Authority and New Jersey Turnpike Authority each collect tolls on their respective highways, the Office of Legislative Research (OLR) report noted. In addition, the Port Authority of New York and New Jersey collects tolls on its bridges and tunnels connecting those two states (the George Washington, Goethals, and Bayonne bridges, the Outerbridge Crossing, and the Lincoln and Holland tunnels). In calendar year 2016, the Port Authority collected $1.86 billion in toll revenue.

Tolls were eliminated by lawmakers more than three decades ago in 1983, following a horrific accident at the then-Stratford toll booths, in which six people were killed. The last Connecticut highway toll was paid at the Charter Oak Bridge in Hartford on April 28, 1989.

In their final year of operation in the mid-‘80’s, Connecticut Turnpike tolls brought the state $56.4 million, the Merritt and Wilbur Cross Parkways 11.3 million, and the three bridges in the Hartford area, $4.7 million, according to a previous OLR report issued in 2009.

Technology, however, has made traditional toll booths obsolete, and Massachusetts recently removed its toll booths, switching to an overhead electronic system – thus maintaining the revenue without extending the dangers and the highway back-ups inherent with the toll plazas.  Connecticut residents driving through Massachusetts on the MassPike have noticed the striking difference.

Despite projections of budget deficits in coming years, the legislature did not vote on imposing tolls as a means of raising revenue this year.    It was estimated that 30 percent of the tolls would be paid by out-of-state drivers and 70 percent by Connecticut residents.  Federal rules require that toll revenue from interstate highways must be used for maintenance or improvements on those highways.  The legislature’s Transportation Committee had voted 19-16 in favor of the tolls bill, which led to the House debate on the proposal.  It was pulled before a vote could be held.

The 2009 OLR Report also noted that according to annual data compiled by the Federal Highway Administration, in 2007 almost 32.5 percent of all the vehicle miles traveled (VMT) in Connecticut occurred on its Interstate highways. Nationally, only 24.4% percent of all VMT occurs on Interstate System. Connecticut's Interstate VMT percentage is higher than many other states, including, at the time, Massachusetts, New York, New Jersey, and Pennsylvania.

The most recent OLR Report did not estimate what Connecticut might earn in toll revenue; it merely reported on the most recent earnings of neighboring states that impose tolls on their major roadways.

Best Run Cities in USA? Not in Connecticut, Study Finds

A new analysis of the best run among the 150 largest cities in America shows that Connecticut’s three largest fail to make the top half of the list, with Bridgeport coming closest. Bridgeport is ranked #77, New Haven is #122, and Hartford ranked #145. 

In order to determine the best- and worst-run cities in America, WalletHub’s analysts compared 150 of the most populated cities across six key categories: 1) Financial Stability, 2) Education, 3) Health, 4) Safety, 5) Economy and 6) Infrastructure & Pollution.

The top ten best run cities are: Nampa, ID; Provo, UT; Boise, ID; Missoula, MT; Lexington, KY; Las Cruces, NM; Billings, MT; Bismarck, ND; Fort Wayne, IN and Louisville, KY.

For each city, the analysts constructed a “Quality of City Services” score – comprising 33 key performance indicators grouped into six service categories – that was then measured against the city’s total per-capita budget.  The website evaluated those dimensions using 33 relevant metrics, with each graded on a 100-point scale, with a score of 100 representing the highest quality of service.

In the “financial stability” ranking, only four cities ranked lower than Hartford, which was #146.  New Haven was #143 and Bridgeport #128 in that category.  In the education ranking, New Haven was #115, just ahead of Bridgeport at #116 and Hartford at #121.

Bridgeport reached the top ten nationally in the “health” category, at #8.  Hartford was #42 and New Haven #56.  The cities were again bunched toward the bottom of the list of 150 cities in the “economy” category, with Bridgeport at #142, New Haven #143 and Hartford #146.

Connecticut largest cities fared better in the “infrastructure and pollution” category, with Hartford ranked #36, New Haven #60, and Bridgeport lagging at #115.

Hartford, New Haven, Bridgeport Among Highest in US for Households That Don’t Own Cars

Whether it is good news or bad news may be in the eye of the beholder.  The percentage of households without a motor vehicle in Hartford is 10th highest in the nation.  New Haven (24th) and Bridgeport (49th) also make the top 50. Some would suggest that lack of car ownership is a reflection of poverty.  Others may point to millennials and others who choose an urban lifestyle specifically because car ownership is less necessary.

In Hartford, 35.7 percent of households do not own cars.  In New Haven it is 29.2 percent; in Bridgeport, 21.2 percent, according to data compiled by Governing magazine, using data from the Census Bureau's 2010-2013 American Community Survey.

Taking cars off streets yields a number of benefits for cities, including helping to attract young people, limiting pollution and facilitating safer roadways for both drivers and pedestrians, explains Norman Garrick, who studies urban planning at the University of Connecticut. That’s part of the reason “cities are really doubling down and trying to reduce use of cars,” he pointed out to Governing magazine in 2015.

Nationwide, about 9 percent of U.S. households didn’t have access to a car in 2013, according to Census data analyzed by Governing -- a figure that has been relatively stable.  Garrick’s past research in Hartford, for example, found 71 percent of employees drove alone to work for an insurance company that charged for parking. Rates for other downtown Hartford employers offering free parking were between 83 and 95 percent.

Among the other Connecticut communities reviewed in the analysis (% of households without cars, ranking):

  • Waterbury          18.2 of HH           69th
  • New Britain        17.7% of HH        74th
  • East Hartford     15.9% of HH        87th
  • West Haven       11.9% of HH        151st
  • Stamford             11.8% of HH        156th
  • Meriden              11.4% of HH        169th
  • Norwalk               9.4% of HH          262nd
  • Danbury               9.3% of HH          271st

Census estimates suggest there were about 1.8 vehicles per U.S. household in 2013. This ratio varies greatly across cities and larger regions. As one would expect, suburban jurisdictions tend to have greater car ownership than more densely-populated cities. Data was included for all cities (794) with at least 50,000 residents.

New School Year Approaches Without Seat Belt Requirement on School Buses

June 7 was the final day of the regular legislative session in Connecticut.  It was also the day following the signing of a new law to require seat belts on school buses – in Nevada. Gov. Brian Sandoval signed legislation, approved overwhelmingly by his state’s legislature, which requires that any new school bus purchased by a school district on or after July 1, 2019, be equipped with a shoulder-harness-type safety belt assembly for passengers.

There was no similar bill signing in Connecticut.  Legislation that would have imposed a similar requirement in Connecticut, effective in 2022, failed to get out of the Transportation Committee after a public hearing months earlier.  The new school year approaches with no requirement in Connecticut, and no change in policy on the horizon, despite years of efforts.

Nevada joins only six other states — California, Florida, Louisiana, New Jersey, New York and Texas —in enacting laws requiring seat belts. In Louisiana and Texas, however, the requirements are contingent upon funds being appropriated by the state, which has yet to occur.

The Connecticut legislator leading the unsuccessful effort says cost, rather than safety, drove the result.

"While the bill did not get voted out of the Transportation Committee, it was given a public hearing and received some favorable comments from committee members,” Rep. Fred Camillo told CT by the Numbers this week.  “The main hold up continues to be funding, something that will take out of the box concepts as the state fiscal situation has not been resolved. I look forward to continuing the effort until our goal is achieved."

It has been elusive here, and elsewhere, despite a change in position by the National Highway Traffic Administration, more than a year ago.  The federal agency previously viewed school buses as safe without seat belts, because of their construction.  That changed in 2015.  Since then, as Connecticut’s Office of Legislative Research noted last year in a report to the legislature, “NHTSA has been exploring ways to make seat belts on schools buses a reality.”

The Connecticut Association of Public School Superintendents testified against the measure, calling for approval to be “postponed” until a series of questions – ranging from the use of bus monitors to the cost of seat belt maintenance to district liability from unused seat belts – could be answered.

The Connecticut Association of Boards of Education (CABE) – representing local elected school boards across the state – also voiced their opposition at the January 30 public hearing.  CABE officials expressed concern about “years of busses” that would “need to be replaced or retrofitted.”  They also noted that lap belts “would not work best for 5-year-olds and 18-year-olds alike.”  In addition, questions were raised about students who might “unclick the belt” and the liability of bus drivers if they did.

Camillo initially proposed the bill in 2011 after a Rocky Hill student was killed in a school bus crash.   earlier this year, in March, after a school bus accident in Canterbury sent five students to the hospital, public discussion on the pending proposal was renewed, but the legislature did not take action.  “This accident today is just another reminder that we really need to do something regarding this issue. We don’t want to wait for another tragedy to occur,” Camillo told the Norwich Bulletin.  Later that month, five people were injured after a crash involving a school bus in North Haven.

Federal law doesn’t require seat belts on the “big yellow school buses” that most students ride, Stateline reported earlier this year. The buses are designed to protect riders through “compartmentalization,” structural safety features such as high, energy-absorbing seat backs and closely spaced seats so children are kept snug like eggs in a carton, Stateline reporting explained.

However, published reports indicate that those features don’t necessarily protect children during side-impact crashes or high-speed rollovers because passengers don’t always remain within their seating compartment, according to the National Transportation Safety Board, which has recommended for nearly two years that three-point seat belts be included in new buses.

Over the past 10 years, NHTSA reports, 6.2% of fatal injuries in school bus related crashes were school bus occupants.

The American School Bus Council, urging people to “support the school bus,” points out that “students are about 70 times more likely to get to school safely if they ride in the school bus instead of a car.”

Danger in CT: Not Buckling Up in Rear Seat is Hazardous to Your (and Others) Health

Twenty-nine states require passengers riding in a vehicle’s rear seat to buckle up with a seat belt.  Connecticut is not among them. A new survey from the Insurance Institute for Highway Safety highlights the common misperception that buckling up is optional – as well as the potential life-threatening hazards to rear and front seat passengers if those in the back seat opt not to buckle up.

"People who don't use safety belts might think their neglect won't hurt anyone else. That's not the case," indicates Jessica Jermakian, an IIHS senior research engineer and a co-author of the study. "In the rear seat a lap/shoulder belt is the primary means of protection in a frontal crash. Without it, bodies can hit hard surfaces or other people at full speed, leading to serious injuries.”

Among adults who admit to not always using safety belts in the back seat, 4 out of 5 surveyed say short trips or traveling by taxi or ride-hailing service are times they don't bother to use the belt.  Nearly 40 percent of people surveyed said they sometimes don't buckle up in the rear seat because there is no law requiring it. If there were such a law, 60 percent of respondents said it would convince them to use belts in the back seat. A greater percentage said they would be more likely to buckle up if the driver could get pulled over because someone in the back wasn't buckled.

Connecticut considered such a requirement in this year’s legislative session.  Urging legislators to approve the requirement, Julie Peters, Executive Director of the Brain Injury Alliance of Connecticut, said “In the event of a crash, unbelted back seat passengers become bullets, putting not only themselves, but everyone in the vehicle at risk. That's because unbelted back seat passengers continue to move at the same rate of speed as the vehicle they are riding in until they hit something -- the seat back, the dashboard, the windshield, the driver or another passenger. It's also not uncommon for unbelted passengers to be thrown from a vehicle and either crushed by that vehicle or another on the road.”

The new survey reveals that many rear-seat passengers don't think belts are necessary because they perceive the back seat to be safer than the front. This shows a clear misunderstanding about why belts are important, no matter where a person sits in a vehicle.

"For most adults, it's still as safe to ride in the back seat as the front seat, but not if you aren't buckled up," Jermakian said. "That applies to riding in an Uber, Lyft or other hired vehicle, too."

Except for New Hampshire, all states and the District of Columbia require adults in the front seat to use belts. All rear-seat passengers are covered by laws in 29 states and D.C. Of these laws, 20 carry primary enforcement, meaning a police officer can stop a driver solely for a belt-law violation. The rest are secondary, so an officer must have another reason to stop a vehicle before issuing a safety belt citation, the IIHS reported.

Rep. Mitch Bolinsky of Newtown, who advocated for passage of a Connecticut law this year, said in February that “Front seats have become much safer but that’s not the case in the back seat. Without the use of seat belts, we needlessly lose lives every year. Those souls should still be with their families.” He cited National Highway Transportation Safety Association (NHTSA) data that unbelted rear seat passengers are three times more likely to die than those who are buckled at the time of a serious impact.

AAA reported last year that three decades ago, Connecticut “moved ahead of the curve nationally with the passage of one of the nation’s first mandatory seat belt laws.”  AAA pointed that that estimates are that each year in Connecticut more than 120 adults are injured and approximately five adults die who were unbelted rear seat occupants. Dating back to 1995, AAA noted, that equates to close to 100 deaths and 2,500 injuries.  A survey of AAA members (AAA Allied Group and AAA Northeast) found that 7 in 10 members believe seat belts should be mandatory for back seat passengers, regardless of age.

The Governors Highway Safety Association issued a report in 2015, "Unbuckled In Back," analyzing the difference in highway fatalities between states that require rear seat passengers to buckle up and those that do not, the Hartford Courant reported.  At a Connecticut legislative hearing that year, the paper noted, state Transportation Commissioner James Redeker said that everyone in a passenger vehicle should buckle up, saying statistics show "people become projectiles because they're not strapped in a safety device."

Legislation has been introduced annually in recent years in Connecticut to require use of seat belts in the back seat.  Earlier this year, state Public Health Commissioner testified in support (HB6054 and HB6269), stressing that “adult seat belt use is the single most effective way to save lives and reduce injuries in crashes.”

Safety belts are credited with having saved 13,941 lives during 2015, the National Highway Traffic Safety Administration estimates. If everyone buckled up, an additional 2,800 deaths could have been prevented, the data indicated. More than half of the people who die in passenger vehicle crashes in the U.S. each year are unbelted.

IIHS surveyed adults 18 and older by cellphone and landline nationwide between June and August 2016. Of the 1,172 respondents who said they had ridden in the back seat of a vehicle during the preceding six months, 72 percent said they always use their belt in the back seat, while 91 percent said they always use their belt when seated in front. This is in line with the 2015 nationwide observed belt use of 75 percent for adult rear-seat occupants and 89 percent for drivers and front-seat passengers.

https://youtu.be/bdW_3oQFO0c


CBIA to Women: Drive a Truck

The Connecticut Business and Industry Association’s Education and Workforce Partnership is turning its attention to the state’s increasing demand for drivers of trucks, buses, and heavy equipment – a demand which is expected to grow to 30,000 by 2024. And the focus of their attention is women, urging them to consider careers in transportation. In an effort to showcase well-paying jobs in the industry, the partnership teamed up with Workforce Solutions Collaborative of Metro Hartford to create a video that highlights this growing industry.

Ellen Underwood, who now drives for the state Department of Transportation’s bridge crew, explains in the video that driving was a “natural pathway” because she enjoyed being outdoors, and driving.  She’s been at it for 20 years, with a number of different employers, including a local municipality.  She says state polices “make it easier for a woman to be treated as an equal,” adding that “if you’re willing to work hard and learn new things, you can do anything.”

A contract driver for CNS Transportation, Karen Roderick, says her career began “as a challenge to see if I could do it.”  She recalls being “the only female” in truck-driving school.  She has since earned Connecticut Driver of the Year, the only woman to do so.

CBIA notes some key facts about women in transportation:

  • Women in historically male-dominated jobs earn an average of 25 percent more than women in historically female-dominated jobs.
  • Women consistently do better with their paperwork, take better care of their trucks, and are often better with their customers.
  • Women, especially when compared with young men, are generally safer drivers.
  • There’s a huge shortage of heavy and tractor trailer drivers yet only 6 percent of truck drivers are female.

Daiana Soto, featured in the video, drives a big rig, and launched her career just four months ago.  “My truck is my office,” she explains. The limited number of women in the field is quite evident, and Soto says it is a challenge she’s ready to take on. “You can do the same job (as men)… and maybe better.”

Ezzie Williams, a professional motorcoach driver for Town & Country in New Britain, began as a school bus driver. She says young people should consider the field, so that they can “get a career and make money.”

Two versions of the video are available—one a full-length video with interviews with six women in six different transportation careers and the other is a one-minute highlight reel.  The project was supported by the Walmart Foundation. The Transportation partnership (Transportation, Logistics, and Distribution Partnership – TDL), convened by the CBIA Education & Workforce Partnership, aims to strengthens the transportation workforce pipeline, support on-the-job training, and improve retention rates among new hires.


https://youtu.be/pNRpQ16ZRNU

Public Transit Commutes Double, Triple Driving Time in CT Cities

People who take public transportation to get to work in the Bridgeport-Stamford-Norwalk area will have a commute nearly three times longer than those who drive to work.  In New Haven, the commute via public transportation is twice as long. Data compiled by Governing magazine indicate that across the nation’s largest metropolitan areas, public transportation riders spend significantly longer traveling to work than those who drive.  Data was compiled for the 25 largest metro areas, including New Haven-Milford and Bridgeport-Stamford-Norwalk.

Bridgeport-Stamford-Norwalk area public transportation commuters spend an average of 69.2 minutes traveling to work. By comparison, it takes those who drive 24.9 minutes.  The 44,742 estimated public transportation commuters account for 10 percent of commuters, according to the data.

New Haven-Milford area public transportation commuters spend an average of 48.4 minutes traveling to work. By comparison, it takes those who drive alone 23.9 minutes.  The 17,504 estimated public transportation commuters account for 4 percent of all commuters.

In nearly every metro area, driving to work remains far quicker than using a bus or train, taking less than half as long in some places.  Across the country, Governing reports, transit systems are seeking to attract new customers as the latest national statistics show stagnant ridership. Cutting down on commute times represents an opportunity to serve more riders who otherwise have a choice in how to get to work.

“Operating speed is going to be important for customers, so if they want to compete in that market, they need to be more competitive,” says Steven Polzin of the Center for Urban Transportation Research. “Time is important to folks across the full economic spectrum.”

Governing compiled the most recent Census survey data measuring total commute times, including travel to stations and the time spent waiting for buses or trains. In the 25 metro areas where public transportation accounts for the largest share of all commuting, riders reported commute times an average of 1.9 times greater than those who drove alone. Similar gaps exist in regions where public transportation isn’t as prevalent.

A metro area’s overall commute times partly reflect its different types of transit. Commuter rail passengers spend an average of 69 minutes traveling to work, far longer than those taking bus or light rail. Accordingly, areas relying more on heavy rail, like Bridgeport-Stamford-Norwalk, report lengthier commutes overall, Governing points out.

On average, the latest Census suggest Americans who drive alone spend an average of nearly 25 minutes traveling to work. The national average for bus commuters is 45 minutes, while those who ride subways or streetcars spend an average of 47 minutes traveling to work. For those who primarily walk to work, commute times average only 12 minutes.

College towns are about the only areas where public transportation commute times mirror those for auto commuters, according to the data compiled by Governing.

Connecticut and TESLA: The Battle Lines Expand

It was a one-two punch from Connecticut aimed at Tesla, in the marketplace and in the boardroom. On Tuesday, at the company’s annual shareholder meeting at the Computer History Museum in Mountain view, CA, a shareholder resolution advocated by the Office of State Treasurer Denise Nappier was on the agenda.

And on Wednesday, the Connecticut legislature concluded the 2017 regular session, leaving behind a proposal that would have enabled Tesla to sell cars directly to Connecticut consumers, as is done in many other states.  It was the third consecutive year that the plan did not receive approval from legislators, in the face of strong opposition from the Connecticut Automotive Trades Association.

The Tesla proposal was approved by two legislative committees - Transportation and Finance, Revenue, and Bonding - but was never voted on by House or Senate members in their respective chambers.  The bill pitted the state’s longstanding car dealers against the new model that Tesla prefers.

The Connecticut Retirement Plans and Trust Funds shareholder resolution called for the declassification of Tesla’s board and for the annual election of all of Tesla’s directors.  The $32 billion Connecticut Retirement Plans and Trust Funds (“CRPTF”), of which Treasurer Nappier is principal fiduciary, owned 32,837 shares of Tesla, Inc. common stock with a market value of $11.6 million as of June 6, 2017.

Tesla’s board currently is classified, which means that each year only a portion of the directors are elected by shareholders.  This year shareholders had the opportunity to vote on three of Tesla’s seven directors. The company’s board recommended that “our stockholders vote against this proposal.”

“Independent shareholders gave Tesla a clear message: it's time to sharpen the company's governance profile and strengthen board member accountability to shareholders, whose interests they are elected to represent,” Nappier said after the shareholder vote.

Connecticut’s resolution, the first ever filed to declassify Tesla’s board, received an estimated 47 percent of the votes not controlled by directors and officers, indicating strong support for the annual election of directors, according to the Treasurer’s Office.  Representing the Connecticut Treasurer’s Office at the annual meeting, and presenting the proposal, was Aeisha Mastagni, a Portfolio Manager in the Corporate Governance Unit of the California State Teachers’ Retirement System. Overall, according to a U.S. Securities & Exchange Commission filing, 74.7 million shareholders voted against the proposal, with 32.7 million voting in favor.

“And now that Tesla has joined the ranks of the Fortune 500, we encourage the company to take particular heed of the recent vote,” Nappier added, “given that most of its largest U.S. company peers have already embraced annual election of directors.  It should reconsider its opposition to this fundamental provision of good governance.”

“At the end of the day, Tesla has and will continue to develop and deploy new technologies and products that will be an important part of the global economy’s clean energy future.   The company’s corporate structure should likewise evolve toward a more accountable governance framework that will fortify its bottom line and sustainable value,” said Nappier, a veteran shareholder activist.

In the aftermath of the Connecticut legislative session, a spokesman for Tesla told CT NewsJunkie that the company wasn’t quite ready to give up on the state. Tesla is allowed to sell direct to consumers in most jurisdictions in the U.S. and around the world. They are prohibited from selling directly in Connecticut, Michigan, Texas, and West Virginia, according to the company.

“The residents of Connecticut overwhelmingly want Tesla to be able to freely operate in the state, and despite inaction during this session,” a company spokesman said.  There are approximately 1,300 Tesla vehicles registered in Connecticut.

Hartford Whalers (Logo) Headed to Connecticut (Vehicles)

Connecticut drivers may soon see another vanity license plate option if a bill approved by the state legislature is signed into law by Governor Malloy.  A license plate commemorating the Hartford Whalers hockey franchise, which departed the Capital city 20 years ago, gained legislative approval in the final days of the General Assembly session. It is the latest of an ever-growing list of license plates supporting a variety of charitable causes and local organizations that are authorized by the state and raise money for various causes.  The Whalers license plate is to be a fundraising vehicle for the Connecticut Children’s Medical Center.

Stafford Springs State Rep. Kurt Vail, who introduced the bill, said in public hearing testimony earlier this year that “the popularity of the franchise has not gone away.”  He predicted that the license plate would be “a huge hit amongst our citizens.”  House Majority Leader Matt Ritter of Hartford said that “with memories of attending games with my grandfather still fresh…the Whalers continue to have a large and growing following in the city.”

Although the Whalers license plate was created by an act of the legislature, state law allows the Department of Motor Vehicles to issue special background plates on behalf of non-profit organizations. The organization must be non-profit, must submit a copy of the organization’s charter or by-laws, provide a letter of good standing from the State of Connecticut Secretary of State’s Office (if required) and supply any Internal Revenue Service ruling on their non-profit tax exemption status.

The logo production and cost incurred will be the responsibility of the organization. The logo prototype design, preferred in PDF format, must be submitted to the DMV. The logo can be no larger than 2 inches wide and 3.5 inches high. DMV has final approval on all the plate and logo designs.

A liaison for the organization must be appointed. This individual will be responsible for all communications with the DMV as well as certifying and authenticating (by signature) each member’s application, submitting the logo design to DMV for approval, submitting 400 applications with the required fee prior to the manufacturing of the special background plates, and submitting a Special Interest Plate disclaimer.

Many organizations in Connecticut offer license plates to their members and the general public.  General categories include animals, colleges, environment, organizations, police and fire, cities and towns, and recreation.

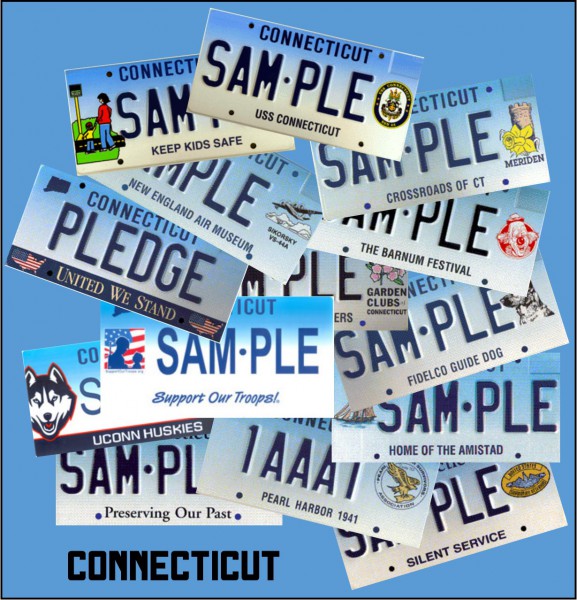
Organization vanity plates include Amistad, Benevolent & Protective Order of the Elks, IUOE Local 478, Grand Lodge of Connecticut, Knights of Columbus, Olympic Spirit, P.T. Barnum Foundation Inc., Preserving Our Past CT Trust for Historic Preservation, Red Sox Foundation, Lions Eye Research Foundation, Special Olympics, Federated Garden Clubs, Fidelco Guide Dog Foundation, Keep Kids Safe, New England Air Museum and the U.S.S. Connecticut Commissioning Committee.

When individuals purchase a Keep Kids Safe plate, a portion of the fee goes to the Keep Kids Safe Fund, which “makes many worthy projects happen for youngsters.”  The fund awards grants to schools, hospitals, municipalities and other non-profit organizations working to make all Connecticut children safer from severe and preventable injuries, according to the DMV website.

In most cases, remake of a current plate is $70; a new vanity plate is $139, a new series plate is $50.  For others, including the UConn Huskies plate, the price tag is somewhat different.  Off-the-shelf license plates cost $55, remake of a current plate is $75, a new vanity plate costs $144, according to the DMV website.

The Support Our Troops plate sends a portion of the fee to provide funding for programs to assist Connecticut troops, their families and veterans. When you buy a Red Sox plate, a portion of the fees support and help fund academic scholarship programs in Connecticut.

Also included are 17 varieties of military specialty plates, including Disabled American Veteran, Gold Star Family, Iwo Jima Survivor, Korean War Veterans Association, Marine Corps League, Laos Veterans of America, Military Order of the Purple Heart, Pearl Harbor 1941, U.S. Submarine Veteran, National Guard Association of Connecticut, First Company Governor’s Foot Guard, First Company Governor’s Horse Guard,

Colleges with designated plates include Central Connecticut State University, Penn State Alumni, University of Hartford, University of Connecticut, and University of New Haven.  Cities with available plates include Meriden, Norwich, and Stafford.

Organizations interested in launching a new special plate, should contact the DMV Special Plate Unit at (860) 263-5154 for further information.