Number of Special Education Students in CT Schools Continues to Increase, Data Shows

The number of Connecticut students in kindergarten through 12th grade with disabilities eligible for special education and related services has increased by nearly 6,000 between the 2008-09 school year and the current school year, as the overall student population has dropped by more than 32,500 students in that time. Data included in a new website developed by the Connecticut State Department of Education indicates that the prevalence of special education in Connecticut schools has increased from 11.6 percent of students to 13.4 percent of students over the past seven years.stat

The prevalence of autism has doubled in the overall school population, from eight-tenths of one percent in 2008-09 to 1.6 percent in the current year.  The percentage of students with learning disability has also increased, while the percentage with speech or language impairment has dropped, as a percentage of the overall student population.

Overall, the Special Education K-12 count in 2008-09 was 64,187 students.  In the 2015-16 school year, the number has climbed to 70,055, an eight percent increase, even as the total student count has gone from 555,411 to 522,906.

The website points out that “Prevalence rate is a statistic about the identification of students with disabilities eligible for special education and related services,” adding that “Connecticut has seen increases in the number and percent of students with disabilities statewide over the last five years.”

The site also notes that the overall decreasing public school enrollment causes the prevalence rate to appear to grow at a must faster rate than one would perceive from actual special education count data.web FT

Connecticut State Department of Education Commissioner Dianna R. Wentzell launched the new website, www.edsight.ct.gov, in late April.  It is designed to strengthen transparency and streamline online access to important school and district information.  The site integrates information from over 30 different sources – some reported by districts and others from external sources.

“The launch of our new data portal is a critical step in our mission to ensure all Connecticut students have access to the kind of high-quality education that prepares them for success in college, career and civic life,” Commissioner Wentzell said.

Over the coming months, additional information and reports will be made accessible to the public through this portal. The site is the culmination of more than two years of work and development by the Department with support from important partners, including the state Department of Administrative Services.

The Department also joined the world of social media last week with the launch of an official Facebook page and Twitter account. The Department’s Facebook page address is http://www.facebook.com/ctdepartmentofeducation. On Twitter, the Department is @EducateCT.

SpedTable_Prev


CT Is National Microgrid Leader, Seeking Electricity Resiliency

The cover story in this month’s edition of State Legislatures magazine, published by the National Conference of State Legislatures, examines new technologies that are keeping the lights on when disasters strike the electric grid.  And it turns out that New England – especially Connecticut – is showing the way for states across the country in one of the new approaches, the electricity microgrid. The sit-up-and-take-notice event that has sent state legislature scurrying to act was SuperStorm Sandy, which knocked out power to nearly 8 million people across 15 Eastern states, including wide swaths of Connecticut.  One of the primary responses aimed at making the electric system more resilient has been the development of microgrids, and Connecticut has been swifter than most in seizing the technological advance. Cover_May2016_240

Microgrids are an example of how state legislators are seeking to make the electrical grid more reliable and resilient through strategies that strengthen infrastructure and shorten the time it takes to restore power, reporter Dan Shea explained in the article.  The whole idea is to minimize the damage and disruption of a disaster.

The article was drawn from research for the NCSL report, State Efforts to Protect the Electric Grid, published in April.  The report points out that nearly 40 percent of the U.S. population—over 123 million people—live in coastal shoreline counties, according to U.S. Census Bureau data.

“We had Irene. We had Sandy. We had a snowstorm that went on forever. We had people in the dark, substations threatened by flooding and power out for eight, 10, 12 days,” Connecticut State Representative Lonnie Reed (D-Branford) told the publication. “We began to see just how vulnerable the whole interconnected system is.”

Many Northeastern states have taken action on microgrids, but the Connecticut General Assembly has been the most active legislative body, Shea reports, passing or updating microgrid-inclusive bills in each of the past four years (2012-2015). These laws offer a range of options for potential microgrid developers—and could even incentivize distributed generation developers to expand their projects to incorporate microgrid technologies.

The three main incentives are:

  • A microgrid grant and pilot program;
  • The Connecticut Green Bank’s commercial sustainable energy program;
  • And municipal energy improvement districts.microgrid image

The Connecticut General Assembly passed legislation enacting a microgrid pilot program in 2012 – the first in the nation according to the Connecticut Department of Energy and Environmental Protection (DEEP). Initially, the program granted $18 million to nine projects. The initiative was later extended and given an additional $30 million to expand microgrid deployment, Shea reports.

Eligibility was extended to municipalities, electric distribution companies, municipal electric companies, energy improvement districts and private entities. On March 6, 2014, Wesleyan University in Middletown became the first of the CT microgrid projects to come online, according to the DEEP website.

The State Legislatures article reports that in 2015, lawmakers in 17 states, including New York and New Jersey, introduced more than two dozen bills on microgrids, six of which have been enacted. Several pending bills direct state agencies to study microgrids, while at least six states are considering legislation that would offer grants, loans or other incentives to develop them. Microgrids, although growing most rapidly in the Northeast, are taking root elsewhere, including California, State Legislatures reports.

In addition, a growing number of businesses and organizations are also investing in resilient systems that allow them to operate independently whether the grid is up or down.

“You’re really talking about having an economic leg up if you have the capacity to stay open and operational when others aren’t,” Reed told State Legislatures.

The state legislature has also directed the Connecticut Green Bank to include microgrid projects within its definition of “energy improvements” that the bank is authorized to make appropriations and issue bonds or other obligations to help finance.

The legislature has also authorized any municipal government to establish an energy improvement district by vote of its legislative body. The state statute outlines how the district’s affairs will be managed and authorizes a board to fund the development of energy improvement projects within the district.

Nationally, more than a dozen states introduced legislation in 2015 that calls for greater diversity in power sources—from expanding renewables to supporting nuclear and fossil fuels.  The State Legislatures report indicates that those efforts are likely to intensify in the years ahead, as weather events are predicted to become more frequent and more severe.

image


PERSPECTIVE: Driven by Discovery

by Dr. France A. Córdova You deserve hearty congratulations for this remarkable achievement. This is an important milestone – you now have a degree, and all the expertise and knowledge that slip of paper implies, and you are charged with venturing out into a big world – full of possibilities. After all, you are ENGINEERS – you design and make things. The world is open to your creativity.

This is also a particularly special milestone for your University, since you are UConn Engineering's centennial graduating class. You join a long lineage of top-flight engineers, including the man this very arena is named after, Harry A. Gampel.CT perspective

I'm not sure that Harry, a 1943 civil engineering major, knew what a powerhouse the Huskies would become when he pledged to help build this arena. But I guarantee he would be disappointed if I did not also congratulate the men's and women's basketball teams on another spectacular year.

Gampel Pavilion has become a home of excellence: the men's team with another appearance in the national tournament, and the women's team undefeated for a record-breaking fourth year. For some of you, they have been national champions every year of your time at UConn Engineering! It may seem inevitable at this point, but I can promise you nothing about being a champion is inevitable.

It takes teamwork and dedication, early mornings and late nights, risk and redemption. It takes, in other words, the same qualities you will have to demonstrate as engineers.

quote 1Nothing is inevitable about being a scientist or an engineer – and that's one of the most frustrating and wonderful things about our chosen field. Experiments fail and hypotheses crumble. Data might not be as neat, as revealing as you'd hoped, technology might break at the worst moment, you might spend years chasing a question only to have the answer continually slip away. But then there are wonderful moments of discovery -- and I promise you the euphoria makes up for all the frustration.

I am driven by discovery. As a young girl, I wanted to be a detective. Parents – think Nancy Drew – I wanted to be Nancy. I love a difficult problem, putting the puzzle pieces together. This passion drew me to astronomy, a field with lots of Big Mysterious Questions: What are the origins of stars? Does life exist on distant planets, and what might it look like? Surely not like you or me! What is the nature of 95% of the mass energy content of the universe? It turns out that we know so little…

It took me a while to actually get to astronomy – the path of a scientist or engineer is always more of a random walk than people think – but once I got my own science degree, my own entry into the "real world," all I wanted to do was be a cosmic detective.

As a Ph.D. student I studied x-ray astronomy, then a nascent field. I used a high-energy satellite, controlled by the Goddard Space Flight Center, to collect data on close binary stars. One night I got word that one of these stars had gone into visual outburst. I ran to my thesis advisor and told him we must stop the satellite scanning and point it directly at the star.

My advisor asked me if I was absolutely sure I would detect something extraordinary – after all, pointing that satellite was an expensive proposition. I took a deep breath, crossed my fingers behind my back and said without pause, "Absolutely."

Graduates, remember this – because one day you will be asked the question by your boss, “Are you sure [you want to do that]?” You’ll have to rely on all your reading, your knowledge, your experience, and your intuition before you respond. I said “Absolutely” and I was rewarded. When I received my data, there it was, a beautiful signal: the first-ever detection of rapid x-ray pulsations from a collapsed star accreting matter from a normal star like our Sun.

It was a message that had traveled thousands of light years, through space and time, to me. That discovery remains one of the highlights of my life.

You will make your own discoveries, suffer your own frustrations. Prepare for them, as best you can. UConn has already done an exemplary job of preparing you for the hard work it takes to be a discoverer, an inventor, a champion.quote 2

You are graduating at an exciting time in engineering. The field is becoming increasingly intertwined with other disciplines. STEM fields are melding together, creating a rich breeding ground for new discoveries and new inventions. The grand challenges of our time – building smarter cities, improving access to clean water, harnessing sustainable energy – will be tackled by engineers like you, working in concert with designers, social scientists or computer scientists or biologists. A team of new discoverers and inventors.

For any team, the road to success is not an easy one. From my own experiences, ones that led me to become head of NSF, I have learned this: find great people to be a part of your team, those you can depend on. Find a mentor/coach who will continue to teach you how to navigate high-risk and high-reward career plays. Find someone who will become your number one fan in your personal cheering section. And find worthy opponents – those real and abstract – who challenge you, keep you guessing, and drive your passion.

As I close my remarks I want to leave you with a quote from my virtual mentor, Einstein. … Actually, my favorite quote from him is “Gravity cannot be held responsible for people falling in love.” But that really has nothing to do with my narrative today, so, I’ll leave you with this one instead: Einstein said "I have no special talents. I am only passionately curious."

I encourage you to always be passionately curious, for this leads to discovery, to invention. Know that you are in control: technology will continue to shape our lives, but you – our future engineers – can shape technology to better human life. We are counting on you!

______________________________

Dr. France A. Córdova is Director of the National Science Foundation.  These remarks were delivered to the graduates of the University of Connecticut School of Engineering at commencement ceremonies on May 7, 2016.

Dr. Córdova, was sworn in as director of the National Science Foundation (NSF) on March 31, 2014. Nominated by President Barack Obama to head the $7.2-billion independent federal agency, she was confirmed by the United States Senate. Córdova is president emerita of Purdue University, where she served as president from 2007 to 2012. Previously, she led the University of California, Riverside, as chancellor and was a distinguished professor of physics and astronomy. From 1993 to 1996, Córdova served as NASA's chief scientist.

PERSPECTIVE commentaries by contributing writers appear each Sunday on Connecticut by the Numbers.

LAST WEEK: An Intervention in History

Noah and Sophia Were CT's Most Popular Newborn Names in 2015

Connecticut’s most frequent names for newborns in 2015 were Noah and Sophia, according to the Social Security Administration.  Nationwide, Noah topped the list for boys, but Emma was number one for girls. Among the baby girls, Connecticut’s top three names selected were Sophia, Emma and Olivia.  Nationwide, the names were the same but the order was different – Emma, Olivia and Sophia.usa baby

Among the boys, Mason was number 2 in Connecticut and number 3 nationwide. Alexander, Connecticut’s third most popular name for boys, placed eighth nationally.

In 2014, Mason and Olivia topped the list of most popular baby names in Connecticut, with Noah, Alexander, Emma and Sophia not far behind.  In 2013, Olivia again was atop the girls list, but William ranked first among the baby boys.

The source of the data is a 100 percent sample based on Social Security card application data.

The top 10 names for boys in Connecticut in 2015 were Noah, Mason, Alexander, Liam, Benjamin, Jacob, William, Michael, Logan and Matthew.  For girls, Connecticut’s top 10 were Sophia, Emma, Olivia, Isabella, Ava, Mia, Charlotte, Emily, Abigail, and Madison.CT most popular

Since the beginning of this decade, as most elementary school teachers can likely attest, the most popular boys names in the U.S. are Jacob, Noah, Mason, William and Ethan; for girls, the leaders have been Sophia, Emma, Isabella, Olivia and Ava.  In the first decade of this century, the top names were Jacob, Michael, Joshua, Matthew and Daniel for boys; Emily, Madison, Emma, Olivia, and Hannah for girls.

A century ago, the list was very different.

The top girls names between 1900 and 1909 were Mary, Helen, Margaret, Anna, Ruth, Elizabeth, Dorothy, Marie, Florence, and Mildred: among the boys it was John, William, James, George, Charles, Robert, Joseph, Frank, Edward and Thomas.

baby booties

CT Has Nation's 11th Lowest Adult Obesity Rate, Survey Says

One quarter of Connecticut’s adult population is obese, according to data compiled by Gallup, the 11th lowest rate in the nation.  The state-by-state analysis indicates that at 18.5 percent, Hawaii has the lowest adult obesity rate in the U.S., closely followed by Colorado at 19.8 percent. They are the only two states in which the obesity rate is below 20 percent. On the other end of the spectrum, West Virginia has the highest adult obesity rate, at 37.0 percent. In addition to West Virginia, at least one in three adults are obese in Mississippi, Delaware, Arkansas and Oklahoma. The obesity rate exceeds 30 percent in 18 states.high low CT

Of the 18 states with obesity rates of at least 30.0 percent, all but one are located in the South or Midwest. Meanwhile, all 11 states with obesity rates below 25.0 percent are located in the Northeast or West.

These data, from daily interviews conducted January through December 2015 as part of the Gallup-Healthways Well-Being Index, are based on U.S. adults' self-reports of their height and weight, which are then used to calculate Body Mass Index (BMI) scores. Americans who have a BMI of 30 or higher are classified as obese.

The national obesity rate reached a new high of 28.0 percent in 2015, up significantly from 25.5 percent in 2008, when Gallup and Healthways began tracking obesity. Fourteen states had statistically significant increases in their obesity rates from 2008 to 2015, while obese
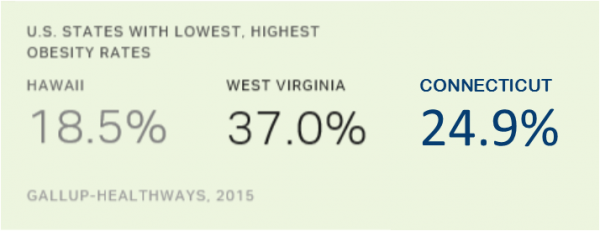
no state registered a statistically significant decline. Maine, West Virginia, Idaho and Oklahoma experienced the sharpest upticks in obesity.

Gallup calculated the incremental cost of healthcare per year for each state by multiplying the estimated number of obese people in the state's population by the annual incremental $1,573 cost of obesity per person.

chart
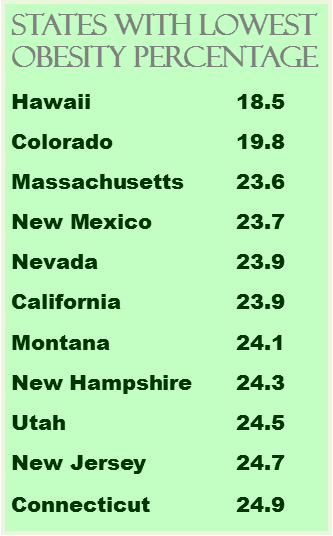
In the five most obese states, the annual incremental cost of obesity per 100,000 residents averages $54 million. By contrast, the average cost is $34 million in the five least obese states. In other words, per capita medical costs attributable to obesity are about 1.6 times higher in the five states with the highest obesity rates than in the states with the five lowest rates.  The cost in Connecticut for the obese adult population was estimated at $39 million, for the entire adult population, $1.07 billion.

map


Tourism Awards Recognize Diligence in Promoting State

The 2016 Connecticut Governor’s Tourism Awards — individuals and organizations "who go above and beyond to enhance both the appeal of our state as well as the health of our economy," were presented at the 2016 Governor's Conference on Tourism, held in Hartford.  Sessions at the day-long conference included Using Creativity to Reimagine Tourism, Digital Marketing, Social Media Practices, and Innovative Trends in Cultural Tourism.

The  ctvisit.com website was also highlighted, and key stats reflecting the success of the state's Still Revolutionary campaign were promoted.  Among them:  3 million visits to the tourism website, 250,000 followers on social media, 25 percent visited Connecticut after seeing an ad, summer tourism was up 12 percent last year, leaf-seaon visits were up 16 percent, hotel occupancy was up 4 percent and room tax revenue up 7 percent.  Total economic impact is $14 billion.

Award recipients recognized during the conference include:

CTC_Logo_260px

Tourism Volunteer of the Year - Jeffry and Maryan Muthersbaugh, Nehemiah Brainerd House B&B

As valuable members of the Central Regional Tourism District’s Board of Directors and members of the Executive Committee, Jeff and Maryan are tireless in their efforts to support statewide and regional tourism marketing. In addition to being owners and operators of the Nehemiah Brainerd House B&B in Haddam, CT, Jeff also serves as the Vice President of the CT Lodging Association and Chairman of the Bed & Breakfast Association. They have been instrumental in forming the CT Bed & Breakfast Association under the CLA umbrella.

Tourism Rising Star Award - Regan Miner, Norwich Historical Societyimpact

At the age of 23, Regan has already accomplished more in the area of regional tourism than some seasoned professionals. A life long native of Norwich, she worked with Norwich Historical Society to unite the city’s many historical entities into a comprehensive destination, securing a grant to open the Norwich Heritage and Regional Visitors Center on the Norwich town green in 2015. Ms. Miner has also developed a series of “Walk Norwich” trails and seasonal events hosted by volunteers and supported by a strong social media presence.

Tourism Partners of the Year Award - Carmen Romeo, Fascia’s Chocolates and Howard Pincus, Railroad Museum of New England

Fascia’s Chocolates and the volunteer-run Railroad Museum of New England have truly laid the track for a sweet collaboration. They’ve joined forces to operate special train tours, including a wine-and-chocolate-themed sunset ride and Halloween event for families, and are adding a regularly scheduled “Chocolate Train” in 2016 to market to charter groups such as bus tours. This partnership has resulted in a unique experience that has attracted high interest at recent ABA and NTA conferences and is a model for other partners statewide.Tourism_Conference_high_res_01

Leader of the Year - Stephen Tagliatela, Saybrook Point Inn, Marina & Spa

An influential proponent for the tourism industry as a board member of the Connecticut Restaurant Association, Lyme Academy College of Fine Arts and University of New Haven, Stephen is a strong advocate for arts and culture, education, and both historic and environmental preservation in the state. Under Stephen’s direction, The Saybrook Point Inn, as well as Spa and Marina, have won numerous awards for its often best-in-class green practices, including the first Connecticut hotel to be named a Certified Energy Hotel in 2007.

  Tourism Legacy Leader John Lyman III, Lyman Orchards

John Lyman is a member of the 8th generation of the Lyman family to farm the land in Middlefield, CT. An early proponent of what has become known as “agritourism,” he has helped to steer his 275-year-old family business toward becoming one of Connecticut’s leading tourist destinations, attracting more than 600,000 visitors a year. Fostering working partnerships with other tourism leaders in the state and region, John initiated cause marketing with unique Sunflower and Corn Mazes, contributing $1 to charitable causes for every person who “gets lost” in the maze, currently surpassing $500,000.

https://youtu.be/-5Nc59LkxqI

https://youtu.be/PnG7hmhpDLg

204,000 Self-Employed in CT; Freelancers Increasing Nationwide

The ranks of the self-employed are growing in Connecticut, as the number of freelancers continues to expand nationwide.  In Connecticut, there are now an estimated 204,000 individuals who are self-employed, more than 11 percent of the state’s workers, which exceeds the national average. As of March 2016, approximately 15.3 million people in the United States designated their employment status as “self-employed,” according to the U.S. Bureau of Labor Statistics, and increase of about 700,000 since May 2014, just over 10 percent of all U.S. employment.state stat

In 2015, 29 states and the District of Columbia had self-employment rates below the U.S. rate of 10.1 percent, and 21 states had rates as least as high. Montana had the highest rate among states, 16.1 percent, followed by Maine (15.4 percent), Vermont (14.4 percent), and South Dakota (14.2 percent). The lowest rates were in the District of Columbia (7.1 percent), Delaware (7.2 percent), and Alabama (7.5 percent), according to BLS data.

Additionally, published reports last fall indicated that 54 million individuals report doing freelance work, either full-time or on the side, in the U.S., representing about one-third of the nation’s workforce.  That is an increase of 700,000 since 2014, according to a comprehensive study conducted by the independent research firm Edelman Berland.

“Americans who are freelancing already contribute more than $700 billion to our national economy and help U.S. businesses compete and find the skills that they need,” said Fabio Rosati, CEO of Elance-oDesk, which commissioned the survey with Freelancers Union.  The study identified five freelancer segments:stats

  • Independent Contractors (36% of the independent workforce / 19.3 million professionals)
  • Moonlighters (25% / 13.2 million)
  • Diversified workers (26% / 14.1 million)
  • Temporary Workers (9% / 4.6 million)
  • Freelance Business Owners (5% / 2.5 million)

In its scale, scope, and complexity, the transformation (of the workforce) will be unlike anything humankind has experienced before," Klaus Schwab, founder and executive chairman of the World Economic Forum, which organized the Davos gathering,  wrote earlier this year. "The speed of current breakthroughs has no historical precedent. ... These changes herald the transformation of entire systems of production, management, and governance."

2014 2015
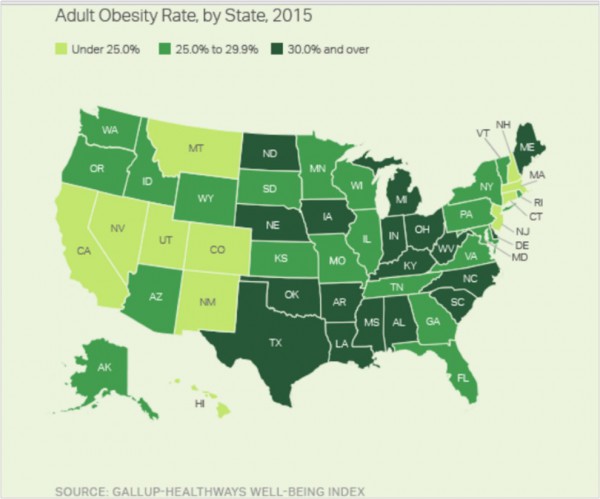
Already, 2.9 million freelancers earned more than $100,000 last year, up from 2 million who hit the six-figure mark just four years earlier, according to MBO Partners.  The report indicated that 60 percent of freelancers surveyed said they started freelancing by choice—up from 53 percent last year—and 67percent of freelancers agree that more people are choosing to work independently today compared to three years ago.

The survey commissioned by Freelancers Union and Upwork in 2015 found that than one-third of freelancers report that demand for their services increased in the past year, and 3 in 4 non-freelancers are open to doing additional work outside their primary jobs to earn more money, if such an opportunity was available.  The report stated that “freelancing is becoming a more prevalent, viable option for workers—a trend that spans across borders, industries and occupations.”

Chronic Absenteeism Declining in CT Schools, Except Among African-Americans

Chronic absenteeism in Connecticut schools declined overall between 2011-12 and 2014-15, but increased among African American students, according to data from the State Department of Education (SDE). In the four-year period, chronic absenteeism among white students dropped statewide from 8.1 percent to 7 percent, among Hispanics from 18.4 percent to 18 percent and among Asians from 7 percent to 6.1 percent.  Hispanic students had the highest chronic absenteeism rate all four years.

Among African American students, the percentage of students chronically absent climbed from 15.2 percent in 2011-12 to 16.1 percent in 2014-15. chronic

Chronic absence is defined as missing 10 percent, or more, of school days for any reason, including excused, unexcused and disciplinary absences. The statistics are included in the Connecticut Department of Education’s new data website, www.edsight.ct.gov

Chronic absenteeism is declining among both male and female students, with males maintaining a slightly higher percentage (one-tenth of one percent) in the 2011-12 and 2014-15 school years as both rates declined.

While English-Language-Learners had a consistently higher percentage of chronic absenteeism than non-English Language Learners, the percentage was dropped at a higher rate, one percentage point versus four-tenths of a point.

The only other sub-category of students to see a higher percentage of chronically absent students when comparing the 2001-12 and 2014-15 school years, in addition to African American students, was Special Education students, according to the data.  In 2011-12, 18.6 percent of special education students were chronically absent.  By 2014-15 the percentage was 19 percent, which was, however, lower than the two previous years (19.4 percent and 19.1 percent).

school hallOverall in Connecticut, the chronic absenteeism rate dropped from 11.1 percent in 2011-12 to 10.6 percent in 2014-15.  The State Department of Education website explains that “improving and sustaining good attendance requires the active engagement of district and school-based leaders and administrators along with a clear articulation of roles and responsibilities.”

In comprehensive guidance provided to local school districts nearly three years ago, the state Department of Education explained that “chronic absenteeism is also emerging as an early indicator of future academic difficulty. Children who are chronically absent in both kindergarten and first grade are much less likely to read proficiently by the end of third grade.”

The guidelines also indicated that “If chronic early absence is not addressed at the elementary level, then it may worsen in the higher grades (Chang and Romero, 2008). By sixth grade, chronic absence is a key early indicator of dropout from high school (Baltimore Education Research Consortium, 2011). By ninth grade, attendance may be a better indicator of dropout than eighth-grade test scores (Allensworth and Easton, 2007).”SDE

The 17 pages of guidelines, which outline how various absences are defined, documented and prevented in accordance with “nationally recognized best practices,” aimed to serve “as a valuable resource to help decrease rates of chronic absenteeism and enhance student outcomes,” former commissioner Stefan Pryor said in a memo to school superintendents and principals in May 2013.

Public Act 15-225, passed by the legislature a year ago, requires schools to track and publish chronic absenteeism data. Schools and districts that exhibit a certain percent of chronic student absenteeism must institute Student Attendance Review Teams (or use an existing body for this purpose), to coordinate interventions for students who are chronically absent.  The legislation requires SDE to help develop prevention and intervention plans for districts in tackling chronic absenteeism.

PERSPECTIVE: An Intervention in History

by the Equity Task Force of Wesleyan University In recent years, due to the increasing corporatization of universities across the nation, and the pressures of the economy, campus cultures have become more fragmented as students negotiate learning, professionalization, and community engagement.

Wesleyan’s mission as a transformative liberal arts education begins with a “holistic review” of potential applicants who are, in many ways, already fragmenting under these pressures. Moreover, the well-being of students is increasingly affected. We need a sustainable and integrative educational approach that is mindful of the uneven impact of these pressures.CT perspective

The overcommitted student does not have time for thinking. In Spanish there is a saying, “Hay que darle tiempo al tiempo,” we must give time the time. Learning is a process and contemplation is an integral component. Our institutional pedagogy should recognize and inspire a more present, civic-minded, and active learner. It may also serve to counteract the academic, personal, and social dissonance in students’ lives.

Considering this as we forge ahead, it is imperative that we reassess our scholastic values. Indeed, after a period of capitulation to the market, quote 2the University must reaffirm and recenter itself on our source of pride, our intellectual mission. Although it is a sign of our times, opting for digitization and screen culture has only encouraged students (and not only students) to view faculty as “resources,” reducible to delivery mechanisms; the result is no longer contemplative learning, but the passive quantifiable consumption of information without attentiveness to pedagogy.

This growing trend, doomed to become our Achilles’ heel, grossly undermines faculty-student relations and the creativeness and possibilities in the exchange of knowledge. An educational mission is not the provision of consumer-centered services. The consumer model that has allowed the institution to compete is leading us astray from our very educational standards.

Students are not partners in transactions, and faculty and staff also require work environments with boundaries, protection, and inspiration. We must work diligently together to reconcile the disjuncture between our branding and reality as we recommit to an integrative and non-instrumental style of learning, based on the twin strengths of Wesleyan’s scholar-teachers and its dynamic staff.

Moreover, it should not be taken for granted that Wesleyan’s known history of activism (especially during the 1960s-90s) continues toquote 1 determine the campus climate or that it gives students the same sense of belonging as their non-activist peers.  Although students have demonstrated over the years and waged campaigns such as Diver$ity Univer$ity, AFAMIsWhy, Trans/Gender Group, and WesDive$t more recently, in the last decades, evident commitment to social justice on a global scale has been waning on this campus, just as it has nationally.

While recent events indicate a resurgence of some awareness, we must admit and confront the shifting generational tendency towards insularity and the interpersonal, which threatens to diminish cognizance and interest in international matters.

Global strife resonates at all levels, and as such is not unrelated to political struggles at home. And with the pervasiveness and persistent power of structural racism, Wesleyan needs the institutional will and commitment from members of its community to ongoing reflection and engagement.

quote 3Therefore, effective and sustainable solutions will not arrive from above. Students, staff, and faculty together must create a campus environment of mutual respect. That environment depends on shared and deliberately articulated community principles. In this regard, on the one hand, the Office of Equity and Inclusion needs to better define, articulate, and communicate the institutional commitment to diversity, equity, and inclusion. That office should also provide a clear policy framework. On the other hand, that environment will be shaped most powerfully by our collective community practices.

As we reel in the wake of the 2015, we must ask ourselves what we want our relationship to this historical moment of crisis to be. Our view is that we must seize this time as an opportunity to intentionally shape Wesleyan’s future narrative…we should consider which aspects of our history continue to serve our progress, and which condemn us to repeat the past.

_____________________________________

This excerpt is from the Final Report of the Equity Task Force of Wesleyan University in Middletown, issued this past week.  The Task Force was created by President Michael S. Roth, and seeks to “address persistent problems of inequality and structural racism that are endemic both in our society at large and at Wesleyan.” The report makes three major recommendations:

  • develop a Center with an “intellectually grounded mission in Social Justice and a focus on intercultural development and literacy.”
  • devote significant resources toward redressing long-term issues of discrimination and marginalization, especially as this affects the composition of faculty and staff as well as the development of the curriculum.
  • establish a standing institutional committee to coordinate, communicate and support change in these areas.

President Roth said this week that Wesleyan “will move forward immediately on all three recommendations.”  Task Force members included Gina Athena Ulysse (Faculty and Tri-Chair), Elisa Cardona (Staff), Antonio Farias (Staff and Tri-Chair), Matthew Garrett (Faculty), William Johnston (Faculty), Makaela Kingsley (Staff), Caroline Liu (Student), Henry Martellier, Jr. (Student), and Shardonay Pagett (Student and Tri-Chair). 

PERSPECTIVE commentaries by contributing writers appear each Sunday on Connecticut by the Numbers.

LAST WEEK: Every Generation Has Something to Teach