PERSPECTIVE: The Connecticut Job Swap – An Economy in Transition

by Derek Thomas and Ray Noonan During the past 15 years, Connecticut’s economy has experienced a “job swap” – jobs lost in high-wage industries were replaced with jobs gained in low-wage ones.

q2As a result, from 2001 to 2015, the share of Connecticut’s private sector jobs in low-wage industries increased by 20 percent, while the share in high-wage industries decreased by 13 percent. This helps explain why a growing number of families, even after a full week of hard work, are forced to choose between groceries and rent, or between childcare and transportation costs.

Why did this shift occur? Like many Northeastern and Midwestern states, Connecticut lost tens-of-thousands of manufacturing jobs before the recession, as a result of several factors, including currency manipulation and technological improvements in response to global competition. Although jobs in manufacturing industries accounted for 15 percent of Connecticut’s private sector jobs in 2001, they accounted for two-thirds of net losses in high-wage industries from 2001–2007. The nearly 22,000 jobs lost in high-wage manufacturing industries during this period dwarfed the growth of less than 1,500 jobs added in the financial and insurance industry.

chart1During the recession, industries across all wage categories experienced net losses with a total net loss of more than 85,000 jobs – nearly 6 percent of total private sector jobs. More than 97 percent of total losses were in mid- and high-wage industries. Manufacturing continued to experience disproportionate losses, accounting for almost 30 percent of all jobs lost during this period. The construction industry accounted for another 20 percent, with administrative and waste services industries (composed largely of janitors, laborers, office clerks) accounting for 13 percent of losses.

This leaves us where we are today. The most recent data, from 2015, indicates that 24.5 percent of Connecticut’s private sector jobs are in low-wage industries, paying on average less than $15 per hour ($31,200 annually). That’s barely enough tCT perspectiveo be considered a living wage for a single adult in Connecticut, let alone enough to support a family. These jobs are concentrated in the food services, social assistance, and retail industries, and they offer fewer benefits, predictability, and flexibility as well as little opportunity for career growth.

Jobs in high-wage industries, paying at least $33.95 per hour ($70,616 annually) on average accounted for 31.4 percent of total private sector jobs in 2015. Since 2001, the state experienced a net loss of 66,000 positions in these industries, including 33,225 jobs before and 38,617 jobs during the recession.chart-2

The good news is that, in spite of the high-wage for low-wage job swap, the share of mid-wage industries in Connecticut has remained constant over the last 15 years – accounting for 44.1 percent of total private sector jobs in 2015.

Other recent trends are also encouraging. As of 2015, the rate at which jobs in high-wage industries declined as a share of all private sector jobs was closer to zero last year than at any point since 2010. Similarly, the rate at which jobs in low-wage industries grew as a share of all private sector jobs was near zero in 2015. These trends, along with recent announcements from Electric Boat, Pratt & Whitney, and Sikorsky suggest the 15-year trend could be reversing.

 These recent trends also demonstrate that, in spite of the shifting economy, a strong foundation of mid- and high-wage jobs exists moving forward: as a result of investments in human capital, the state still boasts a high-quality workforce. Moreover, a greater share of the state’s workforce participates in the labor force (meaning they are working or looking for work) than the U.S. and all peer states. Our workers are the fourth most productive in the nation.q1

Nonetheless, this decade-and-a-half long swap should be matched with equivalent policy responses. For starters, lawmakers should give careful consideration to workforce investments that stimulate growth in high-wage industries when setting upcoming budget priorities. In addition, to help working families close the gap between low wages and the cost of supporting a family, lawmakers should strengthen investments in childcare, restore the state’s full EITC, and raise the minimum wage to $15 per hour. Lastly, scarce resources mandate that state spending of more than $7 billion on tax expenditures should be evaluated and subject to routine public scrutiny  just as it is for spending on schools, transportation and services.

________________________________________

Derek Thomas is the Fiscal Policy Fellow at Connecticut Voices for Children. Ray Noonan is an Associate Policy Fellow at Connecticut Voices for Children. Their research is focused on how Connecticut’s fiscal policies and budget trends affect children and families. This article is based on their work on the “State of Working Connecticut” report. All the data is available at Connecticut Voices for Children’s website.

chart3


PERSPECTIVE commentaries by contributing writers appear each Sunday on Connecticut by the Numbers.
CT Has Nation's 10th Lowest Rate of Cigarette Smoking

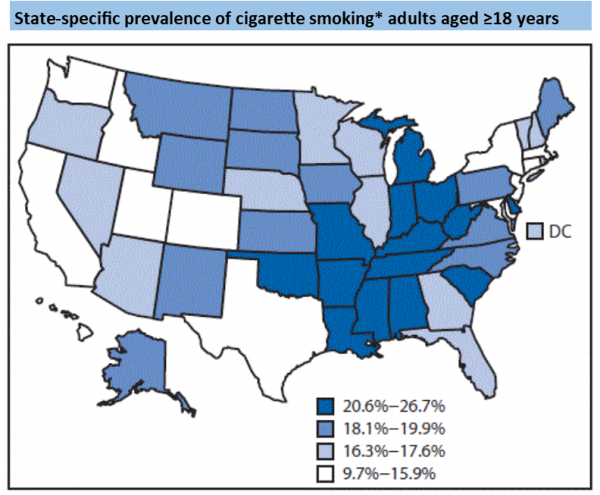
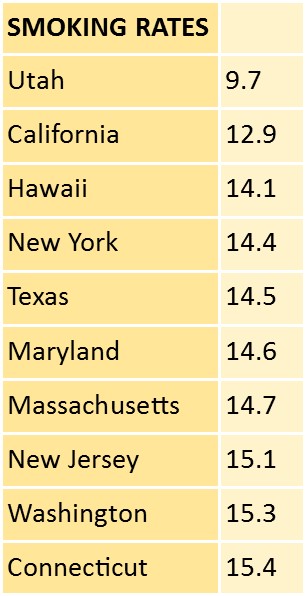
West Virginia had the highest prevalence of cigarette use in the United States, according to a new CDC study.  Utah had the lowest, and Connecticut had the 10th lowest rate. Using data from the 2014 Behavioral Risk Factor Surveillance System, CDC determined that the prevalence of cigarette use in West Virginia was 26.7%, while the lowest rate was 9.7% in Utah.  In Connecticut the rate of cigarette use was 15.4 percent.map

CDC recommended that continued implementation of proven population-based interventions, such as increasing tobacco product prices and enforcing comprehensive smoke-free laws, and increasing access to evidence-based clinical interventions can help reduce tobacco use.

"These findings highlight the importance of enhanced implementation of evidence-based strategies to help smokers and other tobacco users quit completely," CDC said.

Cigarette smoking was significantly higher among males than females in 34 states. Among males, cigarette smoking ranged from 11.2% (Utah) to 27.8% (West Virginia), and among females, from 8.2% (Utah) to 25.6% (West Virginia).

The report also indicated that the prevalence of smokeless tobacco use ranged from 1.4% (Hawaii) to 8.8% (Wyoming). It was 1.8 percent in Connecticut.

ratesPrevalence of any cigarette and/or smokeless tobacco use ranged from 11.3% (Utah) to 32.2% (West Virginia).  Connecticut was 15.3 percent.

The CDC also indicated that the prevalence of any cigarette and/or smokeless tobacco use differed significantly by race/ethnicity in 21 states. Prevalence was highest among whites in eight states (Arizona, Delaware, Georgia, Maryland, New York, North Carolina, Texas, and Virginia), followed by adults of non-Hispanic other races in six states (Arkansas, Florida, Kansas, Nebraska, Oklahoma, and South Carolina), blacks in five states (California, Illinois, Indiana, New Jersey, and Wisconsin), and Hispanics in two states (Connecticut and Michigan).

The report was issued last week from the CDC.  The report concluded that “continued implementation of proven population-based interventions, including increasing tobacco product prices, implementing and enforcing comprehensive smoke-free laws, warning about the dangers of tobacco use through mass media campaigns, and increasing access to evidence-based clinical interventions (including behavioral counseling and FDA-approved medication), can help reduce tobacco use, particularly in populations with the highest use prevalence.”

smoke-that-cigarette


Obesity Rate Climbs in Connecticut, Is Among the Nation's Lowest

Connecticut now has the 10th lowest adult obesity rate in the nation, according to The State of Obesity: Better Policies for a Healthier America. Connecticut's adult obesity rate is currently 25.3 percent, up from 16.0 percent in 2000 and from 10.4 percent in 1990.42

reportAccording to the most recent data, adult obesity rates now exceed 35 percent in four states, 30 percent in 25 states and are above 20 percent in all states. Louisiana has the highest adult obesity rate at 36.2 percent and Colorado has the lowest at 20.2 percent.

U.S. adult obesity rates decreased in four states (Minnesota, Montana, New York and Ohio), increased in two (Kansas and Kentucky) and remained stable in the rest, between 2014 and 2015. This marks the first time in the past decade that any states have experienced decreases — aside from a decline in Washington, D.C. in 2010.

The data, released in September 2016 by the Trust for America’s Health and the Robert Wood Johnson Foundation, reflects information compiled nationwide in 2015.

Connecticut’s childhood obesity rates are 15.8 percent for 2-to-4 year olds from low-income families, 15 percent of 10-17 year olds, and 12.3 percent of high school students.

Regarding obesity-related health issues, Connecticut ranked 31st among the states in the current adult diabetes rate, which is 9.3 percent, and 30th in hypertension at 30.4 percent of the population. rate

In 1985, no state had an adult obesity rate higher than 15 percent; in 1991, no state was over 20 percent; in 2000, no state was over 25 percent; and, in 2006, only Mississippi and West Virginia were above 31 percent.  Nationwide, obesity rates are higher among women (40.4 percent) compared to men (35.0 percent).


Efforts to Improve Math Education in CT Don't Yet Add Up, Report Finds

If Connecticut students are to excel in math, it will take a concerted effort at the state and district level, revised curriculum by state colleges preparing math teachers, and greater community involvement.  That overall effort, according to a new state report, still has a ways to go. The 30-member Commissioner’s Council on Mathematics report, issued last week, outlines recommendations for educators, policy leaders, and community members to improve K-12 mathematics education in the state.  The report stresses several recommendations that are grounded in the lessons learned regarding strong leadership, quality professional development, dedicated time, and effective collaboration within, among, and beyond school districts.report

The council outlines several specific actions for the State Department of Education, individual school districts, higher education, and the community in the report that are distilled into four broad recommendations. Each recommendation is evidence-based, actionable, inclusive of all stakeholders, and measurable.

The four broad recommendations are:

  • develop a clear and consistent understanding of the Connecticut Core Standards-Mathematics (CCS-M) at the classroom, school, district, and state levels;
  • provide the support and training necessary to effectively implement the mathematics standards with fidelity in all classrooms, schools, and districts;
  • implement appropriate interventions and acceleration to support the needs of a diverse group of learners; and
  • engage all stakeholders in the process of putting the Connecticut Core Standards-Mathematics into practice through effective communication that keeps teachers, parents and community members informed and participating in the process.

kids-in-class“Every student deserves the opportunity to receive a math education that is rich and rigorous, and equips them with the skills needed to graduate from high school prepared to be successful in both college and career,” said Commissioner Wentzell. “These recommendations by the Council on Mathematics have created a clear path that will help the State Department of Education take the steps needed to ensure that every student in our state receives a high-quality mathematics education.”


Next steps identified in the report include that “all stakeholders need to work and learn more in the area of mathematics education,” specifically as it relates to the following:

  • instructional support necessary for students with special needs to access the standards;
  • instructional support necessary for English learners to access the standards;
  • interconnectedness of curriculum, instruction, and assessment; and
  • teacher evaluation and certification requirements.

The framework for the recommendations was a logic model described as four buckets: Deep Knowledge of the CCS-M, Curriculum Development and Implementation, Intervention and Acceleration, Community and Family Engagement.

The Commissioner’s Council on Mathematics was initiated by Commissioner Wentzell in 2015 in response to the Smarter Balanced test results in mathematics. The council was convened to spearhead the state’s efforts to improve supports in mathematics by identifying best practices and exploring promising innovations in mathematics instruction.

Communities are urged, in some of the recommendations, to establish partnerships with local districts to create internships for high school students with businesses that require mathematics skills, use social media and distribution lists to promote the importance of the CCS-M, and urge community members to attend and participate in state- and district-provided workshops that deliver information about the standards.

Among a series of recommendations aimed at higher education, colleges are urged to:kids-computer

  • Increase mathematics coursework for elementary pre-service teachers.
  • Increase coursework that focuses on the mathematical practices at all levels.
  • Collaborate with district partners to ensure that pre-service teachers’ field experience is with a teacher who exhibits conceptual understanding, deep content knowledge, and effective use of the practices.
  • Mentor teachers and provide training specific to mathematics content and pedagogy to teachers who will be assigned a pre-service teacher.
  • Create professional learning workshops for in-service teachers to interact with professors at the university to make the connections of what is being taught at the K-12 level and how it is used in higher education.
  • Build relationships with high schools by promoting early college experiences in high schools
  • Require coursework in family engagement strategies for pre-service teachers.

math-quizCouncil members included parents, teachers, curriculum specialists, principals, superintendents, board of education members, higher education professors, business leaders, and State Department of Education staff members with the purpose of closely examining the current state of mathematics education in Connecticut.
The Commissioner selected the members through recommendations made by various stakeholder groups across the state, including the Connecticut Parent Teacher Association (CT-PTA), the American Federation of Teachers-Connecticut (AFT-CT), the Connecticut Education Association (CEA), the Connecticut Association of Schools (CAS), the Connecticut Business & Industry Association (CBIA), and the Connecticut State Department of Education (CSDE).  They met monthly from February 2016 to June 2016, and the recommendations were developed with the input of local school districts, higher education, and experts in family and community relations, according to the report.

CT Families Continue to Struggle Financially, United Way Report Reveals

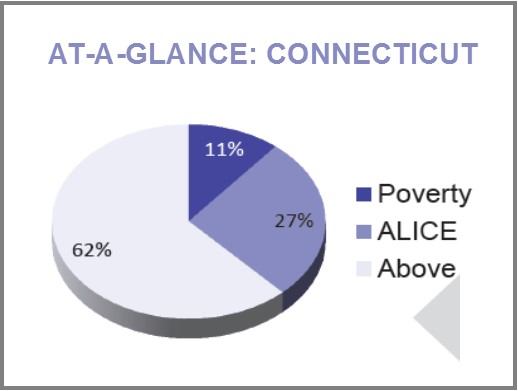
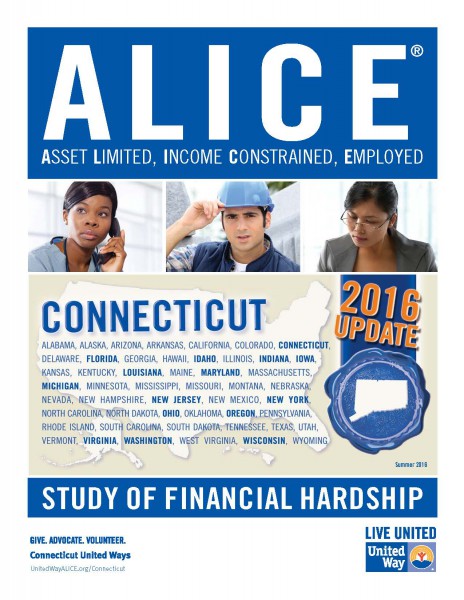
More Connecticut households are struggling to pay for their most basic needs, according to a new report from United Way.  More than one out of four households - in one of the wealthiest states in the U.S. - are employed, yet still fall below what is needed to thrive financially.  That is an increase in both the number and percentage of such households in 2014 as compared with 2012, according to the updated ALICE report. Two years ago, United Ways introduced ALICE, which stands for - Asset Limited Income Constrained Employed - to place a spotlight on a large population of residents who are working, but have difficulty affording the basic necessities of housing, food, child care, health care and transportation.pie

In those two years, the problem has grown worse, even has the recession has given way to a slow economic recovery, in Connecticut and nationwide.  ALICE and poverty households combined account for 38 percent of households in the state that struggle to make ends meet.

A total of 361,521 Connecticut households fall into what the study describes as the ALICE population. These are households earning more than the official U.S. poverty level, but less than the basic cost of living. This is more than 2.5 times the number of households that fall below the federal poverty level. ALICE households make up 20% or more of all households in 114 (67%) of Connecticut’s 169 cities and towns.

The highest levels (ALICE and poverty households) were in Hartford (74%), New Haven (65%), Waterbury (63%), Bridgeport (63%) and New Britain (63%).  Also above 50 percent are Meriden, West Haven, East Hartford and New London.  From 2007 to 2014, two cities, Danbury and Waterbury, saw their total household population decrease, by 7 and 9 percent respectively, while the rest experienced an increase in households, with the largest increase of 8 percent in Stamford, according to the report. The number of household below the ALICE Threshold increased in every one of the nine largest cities and towns with Norwalk seeing the largest percent increase (38 percent).

2016-alice-report-update-coverWhile the prevalence of low-wage jobs still defines Connecticut’s economy for ALICE, for the first time in the past decade, the percent of jobs paying less than $20 per hour fell below 50 percent of all jobs.  The report also highlights a number of trends in Connecticut, including:

  • The population is aging, and many seniors do not have the resources they need to support themselves.
  • Differences by race and ethnicity persist and ethnicity persist, creating challenges for many ALICE families, as well as for immigrants in Connecticut.
  • Low-wage jobs are projected to grow faster than higher-wage jobs over the next decade.
  • Technology is changing the workplace, adding some jobs, replacing many others, while also changing where people work, the hours they work, and skills required. The report notes that technology creates opportunities as well as challenges for ALICE workers.

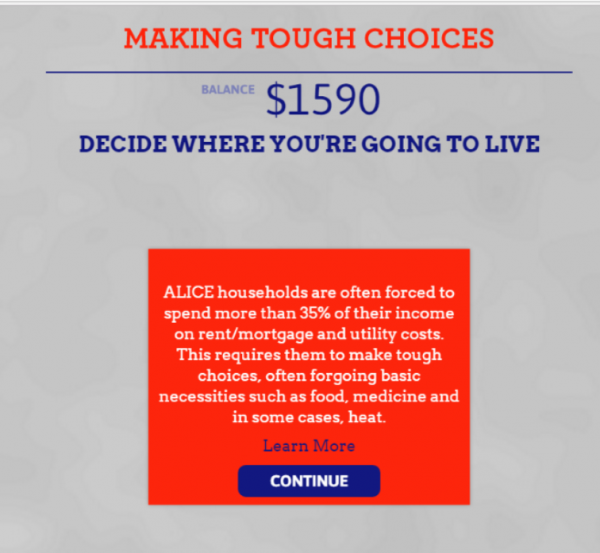
For the first time, an online simulator is also available to experience the financial challenges that ALICE households in Connecticut face at www.MakingToughChoices.org.  The updated Report uses data from a variety of sources, including the U.S. Census and the American Community Survey to provide tools that quantify the number of households in Connecticut's workforce that are struggling financially. The updated United Way ALICE Report reveals:

  • The composition of the ALICE population is men and women, young and old, of all races.
  • The breakdown of jobs in Connecticut by hourly wage (51% of jobs pay more than $20/hour) compared to what it costs to survive for a family of four (2 adults, 1 infant, 1 preschooler) - $70,788.
  • Every city and town in Connecticut has ALICE households. More than two-thirds of Connecticut's cities and towns have at least 1 in 5 households that fit the ALICE definition for financial hardship.cropped-alicemicrositelogo2

Poverty and ALICE households exist in every racial and ethnic group in Connecticut, but the largest numbers are among White non-Hispanic households. There were about one million White households in 2014, compared to 328,000 households of color (Figure 4 shows the populations of color for whom there is income data: Hispanic, Black and Asian). However, these groups made up a proportionally larger share of households both in poverty and ALICE: 64 percent of Hispanic households, 58 percent of Black households, and 30 percent of Asian households had income below the ALICE Threshold in 2014, compared to 31 percent of White households.

The largest population of color in Connecticut, Hispanics, has been growing since 2007, totaling 156,837 households in 2014, a 25 percent increase. As the number of Hispanic households increased, so did the number and proportion of Hispanics living below the ALICE threshold. The percentage of Hispanic ALICE households rose from 34 percent in 2007 to 39 percent in 2010 and then to 43 percent in 2014. Together Hispanic households in poverty and ALICE made up more than two-thirds of Hispanic households in 2014.

making-tough-choicesThere are some signs of improvement in the education gap among racial and ethnic groups, suggesting that some structural changes are occurring in Connecticut. In K-12 education, the Education Equality Index (EEI) shows that the achievement gap – the disparity in educational measures between socioeconomic and racial or ethnic groups – narrowed slightly between 2011 and 2014 in Connecticut.

Achievement gaps impact graduation rates and college performance. Among the Class of 2013, 64 percent of Black students and 59 percent of Hispanic students in the state went on to college within a year after graduating from high school, compared to 78 percent of White students. They also had lower 6-year college graduation rates: While 54 percent of White students got a college degree within 6 years, only 24 percent of Black students and 21 percent of Hispanic students did the same (Connecticut State Department of Education, 2015).

The updated ALICE Report recommends both short-term and long-term strategies to help ALICE families and strengthen our communities. United Ways work with many community partners to provide support to ALICE families to help them get through a crisis and avoid a downward spiral into even worse circumstances such as homelessness as well as assisting with financial literacy, education and workforce readiness.

Further, United Ways in Connecticut have invested more than $8.5 million in child care and early learning; $1.3 million in housing and homeless prevention work; $5 million in basic needs programs; and, have assisted working families in obtaining nearly $40 million in EITC and tax refunds and credits in 2016.

The updated Connecticut ALICE Report was funded by the 16 Connecticut United Ways. For more information or to find data about ALICE in local communities, visit http://alice.ctunitedway.org.  Connecticut United Ways are joining with United Ways in fifteen other states to provide statewide ALICE Reports. The updated Connecticut ALICE Report provides analysis of how many households are struggling in every town, and what it costs to pay for basic necessities in different parts of the state (Household Survival Budget).

https://youtu.be/u7gPJGu2psw

 [2014 ALICE introductory video]

PERSPECTIVE: New Economic Perspectives on the I-91 Knowledge Corridor

by Don Klepper-Smith Today, as I look out over our economic landscape in mid-2016, and given recent developments, I believe there is enough evidence to suggest that the odds of a U.S. recession over the next 12-18 months have risen to roughly 30-40 percent.

During our last recession, the National Bureau of Economic Research (NBER) did not make the official call until December 2008, a full year after the recession began, and after the November 2008 presidential election. So given the 2016 presidential election and the current political environment, it is highly unlikely that the so called "R- word" will be formally uttered by NBER before the end of 2016.CT perspective

If there's one thing I've learned in my 35 years of being a professional economist, it's that once the dominos start falling in a given direction, either to the upside or the downside, expect them to do more of the same. In other words, the economic status quo always perpetuates itself.

Good news begets good news, and bad news begets more bad news. The trick is in discerning the "turning point", which has so many intangibles attached to it. Bottom line: We are clearly starting to see cracks in our economic recovery, but recession is not a foregone conclusion.

q1Essentially, structural change relates to those factors within the domestic economy which are NOT related to, and operate independent of, the U.S. business cycle. Structural changes have to be understood in their scope and magnitude in impacting today’s economy because many of these same factors will also be affecting future levels of growth.

Often unappreciated by federal and state policymakers, these structural changes have had profound and significant effects on levels of economic growth and have vastly reshaped our economic landscape over time. As a result, policy options are far more complicated and challenging.

The good news is that the current U.S. expansion is seven years old this summer, a bit longer than the average post-war recovery of five years. Despite all the rhetoric and cheerleading, the domestic economy grew just 1.7%, 2.4% and 2.6% respectively over the last three years, about a half a percent below our long-term average. In fact, the last time we saw “average growth of 3%” was in 2005. Today, the economic fundamentals clearly argue for another year of “modest growth” in the range of 2%, but red flags are starting to appear.

Importantly, the traditional tools for stimulating the domestic economy - monetary and fiscal policy - have either been exhausted, or are politically unpalatable as of mid-2016.  Here’s the bottom line:  With little means to stimulate the U.S. economy, the overall economy is poised for just modest, below-average, real GDP growth in the 2%-2.5% range for both 2016 and 2017.

In Connecticut, there's clearly been an escalating "crisis of confidence" in the state's business community that's been long ignored, and it's not going to turn around quickly. Research shows that both business confidence and consumer confidence don't turn on a dime, and that it takes many years to rebuild confidence once it's lost.

The present lack of fiscal discipline in state and local finances is clearly one contributing factor. With State and local budgets climbing three, four and five percent annually, and those on fixed incomes earning one to two percent, it doesn't take a degree in math to understand that "mounting fiscal stress" is already baked into Connecticut's fiscal picture over the next ten to fifteen years.

Inform CT is a public-private partnership that provides independent, nonpartisan research, analysis and public outreach.  Highlights of the August 2016 Inform CT survey results include:

  • 40% of the state’s residents say they are likely to move out of state within the next five years.
  • More significantly, more than half of those between 18-25 also said they will leave in the coming years, adversely impacting the local labor supply in the years aheadq2

The issues cited include lack of economic growth, lack of jobs, health insurance costs, declining business conditions, high S&L taxes, and a transportation system that cannot support the needs of its workforce.

Look at the key economic metrics, Connecticut vs. Massachusetts:

  • Unemployment: CT at 5.6% in August 2016; MA at 3.9%; US at 4.9%
  • Unemployed: CT up 5,500 over last year; MA down 30,300
  • State Tax Revenue: CT up 0.8%; MA up 1.9%
  • Single Family Housing Sales: CT up 9.9% year-to-date; MA up 14.2%

The Connecticut economy is expected to see growth of about 1%-1.5% in both 2016 and 2017, well below our long-term average annual growth rate of 2.5%.

Four recommendations for Connecticut:

  1. To promote fiscal discipline, adopt a state spending cap tied to the CPI-U with accountability, adhere to the present spending cap laws on the books, which has been circumvented, and seek full accountability and visibility, making it known to the public when spending caps are exceeded.
  2. Privatize where it makes sense.
  3. Reconfigure wage and benefit packages for state and local workers to reflect what the private sector is paying.
  4. Promote regionalism and the sharing of resources with the idea of increasing productivity.

If the region wishes to be competitive in a global marketplace that is increasingly competitive and subject to profound structural changes, then emphasis on the STEM skills- science, technology, engineering and math provides a gateway for growth.

STEM skills set the table for expansion in our manufacturing sector, which carries significant economic multipliers. It’s manufacturing which begets non-manufacturing, not the other way around. For every manufacturing job created, there are another 1.5 jobs created elsewhere in the local economy.

_______________________________________

Don Klepper Smith is Chief Economist & Director of Research at DataCore Partners LLC and Economic Advisor to Farmington Bank.  This is adapted from his presentation to the New England Knowledge Corridor Mayors’ Economic Forum on October 5, 2016. 

PERSPECTIVE commentaries by contributing writers appear each Sunday on Connecticut by the Numbers.

First Niagara Transitions to KeyBank This Weekend

For customers of the soon-to-be-history First Niagara Bank, this will be a holiday weekend of banking transition, as KeyBank becomes the new name on the door on Tuesday morning after a host of changes inside. First Niagara branches, converting to KeyBank, will close at 3 p.m. Oct. 7 and reopen for business the morning of Oct. 11, the day after Columbus Day. The company promises a smooth transition, and has been providing customers of the bank’s more than 60 branches in Connecticut with step by-step previews of what to expect. The changes represent the completion of the $4.1 billion KeyCorp purchase of First Niagara.logo-lockup

“As KeyBank and First Niagara come together you can continue to bank as you currently do, using your same account number, checks, debit card, ATM card, credit card, telephone banking, online access and branches,” the company website points out.

First Niagara has 65 branches in Connecticut that will be transitioned to KeyBank branches. There were no existing KeyBank branches in the state prior to the merger, so there was no overlap that required branch closings, as is often the case with bank mergers.

Headquartered in Cleveland, KeyBank’s footprint includes 15 states via a network of more than 1,200 branches and more than 1,500 KeyBank ATMs. The company’s roots trace back 190 years to Albany, New York. Since then, KeyCorp has grown into one of the nation's largest bank-based financial services companies, among the top 15, with assets of approximately $135 billion, according to the company.

keybank-mapIn recent months, First Niagara did consolidate five Connecticut branches (Woodstock, Dayville, Hamden, East Haven and Madison), and all of the employees who worked at those branches were offered positions within the bank, officials indicated, and no layoffs were associated with that consolidation.

"By asset size, this is the largest bank merger since the financial crisis,” Beth E. Mooney, Key’s chairwoman and CEO, told the Buffalo News last month, during a visit to Key’s Northeast regional headquarters in Buffalo, which had been First Niagara’s corporate headquarters.

“So there is a significance and an importance for us to do it well that’s critical for our communities, our clients, our employees and our shareholders. But from an industry perspective, this is actually one that there’s a fair amount of eyes on us, as well.”

The conversion of First Niagara accounts and services to KeyBank will begin at with a 3 p.m. close of business on Friday, October 7.  Due to Online Banking updates, customer balances that appears online on Thursday, October 6 at 11:59 p.m. will not change until Saturday, October 8, at 6 a.m., so any purchases or deposits made during that time will not be reflected on online balances until Saturday. Customers can continue to use current First Niagara ATM/debit card, account numbers and PINs will not change.

The acquisition of First Niagara by Keycorp was announced on Oct. 30, 2015, and includes the addition of approximately 300 First Niagara branches in New York, Pennsylvania, Connecticut and Massachusetts.  First Niagara had entered the Connecticut market in 2011 with the purchase of New Alliance Bank.

Global Health and Innovation Conference, World's Largest, in New Haven in April

The Innovation Prize is a $10,000 and a $5,000 cash prize that is awarded to the two best social impact pitches that are presented at the 2017 Global Health & Innovation Conference, to be held in New Haven at Yale University on April 22-23, 2017. The Global Health & Innovation Conference (#GHIC) is the world's leading and largest global health conference as well as the largest social entrepreneurship conference, with 2,200 professionals and students from all 50 states and more than 55 countries, according to conference organizers.

The conference was developed by Unite for Site, a 501(c)(3) nonprofit global health delivery organization that is free of commercial interests and committed to promoting high-quality health care for all. GHIC 2017 will be Unite For Sight's 14th annual conference, having grown from a conference of about 100 participants in its first year.unite-for-sight-logo

Unite For Sight, headquartered on Church Street in New Haven, supports eye clinics worldwide by investing human and financial resources in their social ventures to eliminate patient barriers to eye care. Unite For Sight applies best practices in eye care, public health, volunteerism, and social entrepreneurship to achieve our goal of high-quality eye care for all. The programs are locally led and managed by ophthalmologists at Unite For Sight's partner eye clinics.

unite-2Unite For Sight's international eye care services with partner local eye clinics are provided year-round and are comprehensive, including examinations by local eye doctors, diagnosis and care for treatable conditions, education, and preventative care. The organization’s website indicates that Unite For Sight has provided eye care services to more than 2.1 million people worldwide, including more than 93,166 sight-restoring surgeries.

The conference is expected to include 300 speakers, including keynote addresses from:

  • Vanessa Kerry, Founder and CEO, Seed Global Health
  • Jeffrey Sachs, PhD, Director of Earth Institute, Columbia University; Quetelet Professor of Sustainable Development, Professor of Health Policy and Management, Columbia University; Special Advisor to Secretary-General of the United Nations Ban Ki-moon
  • Sonia Sachs, Director, Health Sector, Earth Institute, Columbia University; Health Coordinator, Millennium Village Project
  • Leana Wen, Baltimore City Health Commissioner

Unite for Sight was founded in 2000 by Jennifer Staple-Clark, then a sophomore at Yale University, in her dorm room. Unite For Sight is now a leader both in global health education and in providing cost-effective care to the world's poorest people. Staple-Clark, the organization’s Chief Executive Officer, is being honored in November by the Greater New Haven Chamber of Commerce as a Millennial Move Maker.unite

She is the recipient of the 2011 John F. Kennedy New Frontier Award, presented by the John F. Kennedy Library Foundation and the Institute of Politics at Harvard's Kennedy School of Government to "an individual whose contributions in the realm of community service, advocacy or grassroots activism have elevated the debate or changed the landscape with respect to a public issue or issues." In 2015, Middlebury College's Center for Social Entrepreneurship presented Jennifer with the Vision Award "to recognize leadership and vision in the world of social entrepreneurship."

Topics at the April conference will also include design thinking; education and school-based programs; environment health, energy, food and agriculture; healthcare delivery, university education initiatives; health policy, mental and neurological health; patient-centered initiatives; marketing communications; social entrepreneurship; surgery & global health; technology in global health; and non-communicable diseases.

unite-3The conference also includes Social Impact Labs, which provide an opportunity for selected speakers to present their new idea in the format of a 5-minute pitch. All of the presentations are ideas that are being developed, meaning that the ideas are in the brainstorming, early development, or early implementation stage.  Following each presenter’s 5-minute pitch, there is a 15-minute period for discussion and coaching with two expert speakers, questions, answers, and feedback from the audience.
For Innovation Prize at the 2017 GHIC, there are two categories: Early Stage (idea, program, or organization is less than 3 years old, and ideas in the brainstorming stage are also eligible) and Established Stage (program or organization is 3-6 years old). A newer program (0-6 years old) that is within an established (7+ year old) organization qualifies for the Social Impact Lab category as well.

https://youtu.be/Lt818tE5AUc

https://youtu.be/NtTtFAv-uTQ

Ridgefield, Wilton, Weston Are Connecticut's Safest Communities, Analysis Says

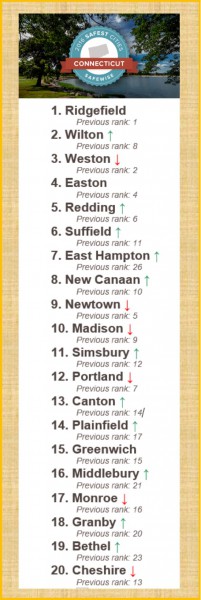
Ridgefield, Wilton, Weston, Easton and Redding top the list of Connecticut’s safest communities, according to an analysis from Safewise.  Rounding out the top 10 are Suffield, East Hampton, New Canaan, Newtown and Madison. The analysis explains that “one of Connecticut’s positive attributes is a relatively low crime rate.” Based on the most recent FBI Crime Report, the violent crime rate in Connecticut is nearly 40 percent lower than the national average and the property crime rate is over 25 percent lower, according to the Safewise report.

listIn 2014, roughly 30 out of every 1,000 people across the U.S. were victims of crime, while Connecticut’s crimes affected only 21 out of 1,000 people. Among the state’s 20 safest cities, however, only about three crimes were reported for every 1,000 citizens.

Ridgefield topped the list for the second consecutive year.  Among the biggest jumps on the list was East Hampton, which moved from #26 to #7.

According to the data, 70% of the 20 safest cities in Connecticut reported less than five violent crimes and 55% reported less than 100 property crimes. These figures are especially impressive considering the average population of the cities on our list is almost 19,000.

To identify the 10 safest cities in Connecticut, Safewise reviewed the most recent FBI Crime Report statistics from 2014, along with population data. Eliminated from the analysis were communities with fewer than 5,000 residents as well as any cities that failed to submit a complete crime report to the FBI.

Connecticut’s cities ranked at the bottom of the list.  Between #85 and #91 were New Britain, New London, Bridgeport, Waterbury, New Haven and Hartford.  Also among the towns ranked towards the bottom of the list were Derby, Plainville, Manchester, West Haven, and East Windsor.

SafeWise is a home security and safety brand committed to increasing safety education, awareness, and preparedness in American communities.

State Resident Published by National Magazine Concludes "Connecticut's Bad for Business"

The headline in the story posted over the weekend at the National Review website says simply, “Connecticut’s Bad for Business.” The article explains that “the state’s perpetual budget crisis has continued unhindered, with no resolution on the horizon,” and points to “a long list of causes” for the adverse business climate: “burdensome regulations, the second-highest tax burden in the country, restrictive zoning rules, high costs of labor, a lack of meaningful regional cooperation, clogged highways, crowded trains, and overall inadequate public transportation.”

The National Review focus on Connecticut launches into a discussion of “the educational disparities that characterize the school systems” including this spending review:national-review

“New Haven, featuring a perpetually beleaguered and fairly depleted school system, spends $17,200 per student. Fairfield, the wealthy town right next door to Bridgeport, actually spends less — just under $16,000. Waterbury, one of the poorest cities in the state, spends $15,000 per student; West Hartford, regarded by all as some sort of suburban Zion, spends $500 less. Hartford spends $19,400 per student, more than the New York exclaves of New Canaan and Darien and more than the shoreline oases of Madison and Guilford.”

The article suggests that among the factors adversely impacting the quality of education in urban districts is “stunningly dysfunctional boards of education” that feature “bitterly personal partisan acrimony” and “an inability to rise above petty, factionalist squabbling.”  Some examples are outlined.

Education funding, likely to be front and center in the 2017 state legislative session following a sweeping court decision now being appealed by the state, drew this observation:  “Wealthy towns may, on average, spend more per student than poorer towns and cities do, but it’s not a hard-and-fast rule; sometimes poor towns spend more, and sometimes they spend less. In any case, spending can’t explain it all.”

bearingsRecent articles by The New York Times and Atlantic are referred to, noting that they also reflected poorly on the state’s current condition.  National Review adds to the journalistic observations of a state filled with seemingly intractable dilemmas, noting that “Connecticut’s tax system is currently so dependent on the incomes of Fairfield County high-earners — as Governor Malloy has often made clear — that even the slightest variations can trigger a budget crisis.”  The article adds, however, that “finance lies somewhere near the bottom of a long list of factors in explaining the current state of Connecticut.”


The article suggests that GE’s departure and Sikorsky’s recent decision to stay in the state both reflect Connecticut’s weakness.

“That Sikorsky probably would have followed GE’s path out of the state without (state subsidies) suggests to me that Connecticut just isn’t a good place for business anymore — unless the state opens the coffers. The lack of middle-class jobs in Connecticut cannot be explained by an overreliance on finance in one of the state’s eight counties; rather, it has far more to do with Connecticut’s long-decaying business climate.”

The article was authored by National Review intern Noah Daponte-Smith, who is also a Yale University student and staff reporter and writer for the Yale Daily News, described as a “student of modern history and politics.”  Smith has also written - last summer - for Forbes, focusing on “British politics in the domestic and European spheres.” He is a graduate of the Hopkins School in New Haven.

Daponte-Smith indicates that Connecticut’s “problem can be solved,” but concludes that “blaming inequalities in education funding or the prominence of finance in Fairfield County’s economy are poor places to start.”