Private Schools in Connecticut Among Most Expensive in USA

If you’re considering sending a child to private elementary or high school, know that there’s virtually nowhere in the United States more expensive in Connecticut. The average cost of private high school tuition in Connecticut, $31,413, is the second most expensive in the nation, just behind Vermont ($31,532) and just ahead of Massachusetts ($30,186).  New Hampshire and Main round out the top five most expensive states for private high school tuition.

The most expensive average elementary school tuition cost is also on the East Coast, and Connecticut leads the way.  The average private elementary school tuition is $13,412, with Massachusetts ($10,822), New Hampshire ($10,773), Virginia ($10,755), and New York ($10,513) rounding out the top five.

The average cost of private school tuition has grown at a rate that is higher than inflation over the past 20 years, according to data analyzed by the website hommuch.net   The site indicates that administrative employee compensation has been the main catalyst for the increases in private school expenses, noting that the rise in the volume of employees who have a larger compensation package than a typical teacher has created the upward trajectory in private school tuition costs.

The website Private School Review indicates that the private elementary school average is $9,263 per year and the private high school average is $14,017 per year.

In a ranking of the best private schools in Connecticut this year, the website Niche listed Choate Rosemary Hall (Wallingford), The Hotchkiss School (Lakeville), Hopkins School (New Haven), Kent School (Kent), Greenwich Academy (Greenwich), The Taft School (Watertown), Loomis Chaffee School (Windsor), Brunswick School (Greenwich), Miss Porter’s School (Farmington) and Westminster School (Simsbury) as the top 10.


100 Best Companies to Work From Home? CT Has Four, Led by Aetna

Working from home – for a major company – isn’t the aberration it once was.  And a handful of Connecticut companies have made the national list of the Top 100 Work From Home companies. Aetna, now planning to stay in Connecticut, was the top-ranked Connecticut business, at number 17.  For those thinking about the proposed merger ahead, Rhode island based CVS Health also made the top 100, ranked number 93.

Stamford-based Xerox was number 31 on the list, dropping from number 14 in 2017, and The Hartford came in at number 69, a similar ranking to last year’s number 69.  Cigna was number 90, falling from number 74 last year. 

The list was featured recently in Forbes magazine, and was developed by the website Flexjobs.

“With mobile devices and videoconferencing technology becoming more widespread, telecommuting jobs are also becoming more common,” the publication pointed out.

The top sectors offering such work are health care, computer/IT, education/training, sales, customer service, finance and travel/hospitality of the 19 industries represented on the list.

Five of the fastest-growing remote career categories are therapy, virtual administration, client services, tutoring, and state and local government, the analysis of the list indicated. The 20 most common telecommuting job titles include teacher, writer, developer, analyst, sales representative, nurse, accountant and program manager.

Five companies are fully remote, and 30 are newcomers to the list.  Xerox – along with Kaplan and UnitedHealth Group - are among the 29 companies who have made the list every year since 2014.

Each year for the past five years, Flexjobs listed the 100 companies that posted the most remote-friendly job openings throughout the last year. Remote-friendly means the openings must offer some level of telecommuting (the levels on the Flexjobs site are 100 percent, mostly, some, or optional telecommuting).

Last fall, Working Mother magazine reported that Aetna was offering "working-mom-friendly perks, like a work-from-home program that more than 43% of its employees participate in."  According to Aetna’s career website, Working Mother pointed out at the time, the company had openings for 222 jobs that can be done remotely from home. "The jobs are based across the country and are available in a range of fields, including marketing, management, information technology and more."

PERSPECTIVE: Republic Still at Risk; Connecticut Edges Forward

by Peter L. Levine My colleagues and I have worked on civic education for several decades, but I’ve never seen such an upsurge of interest as we’ve observed during the past year. Demands for more and better civics are not only coming from critics of the Trump administration who are concerned about a perceived erosion of constitutional principles. There’s also alarm across the political spectrum about polarization: Americans believe different facts, hold different opinions, and dislike their fellow citizens who disagree with them. “Fake news” is also a widely-shared concern, even though we debate what is “fake.”

And beneath these trends is a slow but profound decline in our everyday civic engagement at the community level (distinct from politics and government). For instance, in a 2017 poll, only 28 percent of Americans said they belonged to even one organization that had accountable and inclusive leaders. These concerns are shared by many Americans who voted for Donald Trump, as well as by many who opposed him or who didn’t vote at all.

Students can and must be educated to participate in politics and community life. That means that we must certainly give more attention to civic education in our k-12 schools. But sometimes the conversation about k-12 civics gets off on the wrong foot. I constantly hear people ask, “Why don’t kids study civics anymore?” Or “Why isn’t anyone working on that problem?”

Sometimes these complaints are reinforced with evidence of adults’ lack of basic knowledge. For instance, after the national political conventions in 2016, just 37 percent of Americans could name the Republican candidate for vice president and just 22 percent could name the Democratic candidate.

This is not the right place to start because we already teach civics in schools. Almost all students are required to study the US system of government in history and other social studies courses. Almost all face tests on this material. Every state has lengthy requirements for learning basic civic information. And thousands of dedicated social studies teachers do an excellent job with this material. We must not erase their contributions or ignore our students’ learning by posing the issue as “Why don’t kids study civics anymore?”

Yet much more needs to be done. Civic education has been a backwater at a time when basic literacy, science, and math have received relentless attention. The social and political world has changed dramatically--for example, newspapers have shrunk and social media has arrived--yet very little money has been spent in revising social studies resources and methods for our new era. Teachers report a lack of support for educating future citizens.

We also tend to focus attention in somewhat the wrong places. For example, most students learn the mechanics of the political system in order to demonstrate knowledge on a test, but few develop habits of following the news out of interest and commitment. If a 50-year-old doesn’t know who was nominated for Vice President, it isn’t because we failed to teach social studies. It’s because the adult never became interested enough to keep up. Motivation is crucial in civics.

Finally, we don’t devote as much attention as we need to addressing the real weaknesses of American civil society: polarization, shrinking voluntary associations, and a fragmented news environment.

Connecticut has taken some positive steps lately. In February 2015, the state adopted new frameworks for Elementary and Secondary Social Studies. I think they are well done. They move beyond random-seeming information toward a coherent “Inquiry Arc” that should help to prepare citizens.

Secretary of State Denise Merrill and Commissioner of Education Dianna Wentzell are both advocates for civics. In 2017, they launched the “Red, White and Blue Schools” initiative that recognizes Connecticut schools for good civic education. This year¹s theme is local community engagement.

I’m proud to serve on the board of Everyday Democracy, which has helped start the Connecticut Civic Ambassadors Program. Citizens are asked to become “Ambassadors” who will engage with their local community to encourage civics education and engagement.

Another nonprofit based in Connecticut is the Civic Life Project, which “brings civics to life by empowering students to produce and screen short documentary films on community issues they care about.”

Finally, Kid Governor started in Connecticut in 2015 and has since spread to Oregon. It’s an absorbing and deeply educational program for 5th graders that culminates in a mock election.

These are the kinds of steps we need. More must be done in the face of a deeply caustic media and political environment. Strengthening civics isn’t easy, considering all the other challenges that confront our schools. But it is good to see civics receiving new attention and creativity, and I’m optimistic that the rising alarm about our politics will lead to even more improvements in Connecticut and nationwide.

____________________________________________

Peter Levine is Associate Dean of the Tisch College of Civic Life at Tufts University. For additional background, please see “The Republic is (Still) at Risk—and Civics is Part of the Solution,” a recent paper by Peter Levine and Kei Kawashima-Ginsberg, released at a summit on civic education keynoted by Supreme Court Justice Sonia Sotomayor.


Report Reflects Good News, Continuing Challenges for Women, Girls in Eastern CT

Women and girls in Eastern Connecticut are progressing in many ways, but gender equity is elusive in many others, according to a new report.  The Community Foundation of Eastern Connecticut commissioned DataHaven to develop a report on the Status of Women and Girls in Eastern Connecticut, and the findings provide an insightful snapshot of disparities that persist, and challenges that remain and may increase, as well as diminish, in the years ahead. The purpose of the 26-page report, explains the Community Foundation’s President and Chief Executive Officer Maryam Elahi, is “to help inform and guide thoughtful conversations and inspire local ideas for social and policy advancements and investments.”   It is designed to be a “platform for action” to increase opportunity, access and equity for women and girls in Eastern Connecticut, officials indicated.  It is the first time that such a report was developed.

Among the key findings:

  • Young women are achieving in school, but greater educational attainment has yet to translate to economic equality.
  • Positive educational outcomes and economic equality are further out of reach for women of color.
  • Many occupations remain segregated by gender, and women make up a majority of part-time workers.
  • Women are at greater risk of financial insecurity, with single mothers at the greatest risk. 25% of all children in Eastern Connecticut live with a single mother, and 90% of single-parent households are headed by a mother.
  • Women in Eastern Connecticut are healthy, with a life expectancy of about 82 years—slightly above the national average, but below the state average.

The report also found that:

  • The opioid epidemic continues to ravage our communities, with deaths of women in 2016 more than double those of 2012.
  • Young women are at heightened risk for many mental health conditions. 35% of female students reported feeling hopeless or depressed vs. 19% of male students, and women are three times more likely to attempt suicide than men.
  • Violence against women continues to be a major public health problem. Almost 5,000 women in Windham and New London counties received services from domestic violence shelters.

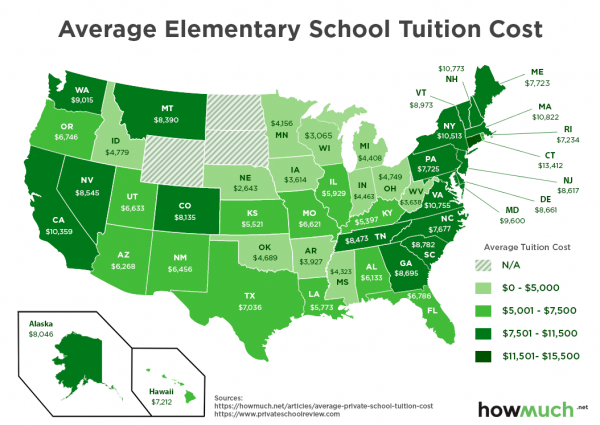
The report defines Eastern Connecticut as the Community Foundation of Eastern Connecticut service area:  42 towns that include 453,000 people, 227,000 women.  The population of the region is 80% white, 9% Latina, 4% Black and 4% Asian.  Approximately 33,700 residents, or 7 percent, are foreign born.  Looking ahead, the report noted that the population of women ages 65 and up is projected to grow significantly over the next decade; estimated to increase 44 percent by 2025.

Continuing racial disparities are highlighted by the finding that among 90 percent of girls in the region’s class of 2016 graduated high school within four years, yet nearly 20 percent of women in New London and Windham/Willimantic lack a high school diploma.

The report noted that “a persistent gap” exists for women with degrees in STEM fields. Overall, 51 percent of men vs. 30 percent of women majored in science and engineering fields. Encouragingly, of 25-39 year-old women with degrees, 37 percent majored in the sciences. This is higher than previous generations.

Although women comprise 76 percent of educators, only 11 out of 41 superintendents in the region are women.  The report also found that 25 percent of businesses are women-owned.

“Women’s equality,” Elahi said, “is not just a women’s issue. It affects the wellbeing and prosperity of every family and community.”

The Community Foundation has organized public forums to discuss the report findings.  The first was held last week in Hampton, the next is February 15 in New London.

New Haven-based DataHaven’s mission is to improve quality of life by collecting, sharing, and interpreting public data for effective decision-making. The Community Foundation of Eastern Connecticut serves 42 towns and is comprised of over 490 charitable funds, putting “philanthropy into action to address the needs, rights and interests of the region.”

Need Accreditation? New England Commission Gives CT Regents Extensive To-Do List

If you were attempting to convince the accrediting board for higher education that no harm will come to the quality and caliber of students’ education when 12 community colleges are merged into one, would 51 suggestions for revisions of the initial preliminary draft be nothing more than a series of helpful hints or harbingers of real danger ahead? Time will tell.  As will the final draft of the submission, which must be provided less than a month from now on March 16.  That’s when the Connecticut Board of Regents must send the final version of its consolidation plan for the state’s 12 community colleges to the New England Association of Schools and Colleges (NEASC). The proposal is for a “system wide consolidation of administrative functions and the administrative reorganization of the 12 community colleges.”

A letter from NEASC’s Barbara Brittingham to Jane Gates, provost of the Connecticut State Colleges and Universities, which is led by the Board of Regents for Higher Education, runs seven pages and is filled with questions, suggestions, cautions and requests for significantly more detail on plans.

Among the issues flagged by the NEASC’s Commission on Institutions of Higher Education, were two described as “overarching”:

1) low graduation rates (9 of the 12 institutions had graduation rates for first-time/full-time students below 15% in the 2017 reviews; certainly this rate is highly imperfect, but the percent of community colleges that were below 15% is significantly higher than in other New England states with multiple community colleges); and

2) finances, with the Commission expressing concern for 10 of 12 community colleges in their most recent comprehensive evaluation or interim report. With a proposal to remove $28 million from the collective budgets, the Commission will need to know, among other things, that students will be at least as well served as now and that there are appropriate resources available to support the programs and services being offered. Please include more evidence about the claims made, especially about the need for fewer staff once the consolidation is accomplished.

NEASC also indicated that “We cannot tell in any useful detail what is being removed from each institution in the way of positions, services, contracts, or other expenses. We understand that some (much?) of the reduction in personnel expenses will come through attrition, but we cannot tell what the contingencies are for replacing key personnel who leave during the next several years.”

The accrediting commission is asking for:

  • who will be doing what, the timeframe, and expected outcomes
  • the cost and timeline to implement new features
  • examples of work that has already been accomplished or is substantially underway
  • a multi-year budget, incomes and expenses, that reflects each of the campuses, the expenses of the central community college office, and expenses associated with the regional offices.
  • Information on the many people now located at the various campuses that would be reassigned to work in Hartford at the system office

The Board of Regents was also directly cautioned “not to unintentionally mischaracterize the words or positions of the Commission,” pointing out an instance in the draft in which a policy was incorrectly attributed to NEASC.

It also notes the proposal’s claim that one financial aid system will “support more students, increase enrollment, and therefore increase tuition and fee revenue.”  The NEASC Commission directs the Board of Regents to “please include evidence to support the claim.”  It also asks for cost and time estimates regarding the Board’s claim that “functions that are currently maintained by each campus could be automated” and evidence to support the claim that a “consolidated structure is well-suited to address the opportunity/achievement gap that exists” in Connecticut.

Among the questions raised about the academic integrity of the proposed consolidation, NEASC includes this:  “With the proposed centralization and the proposed elimination of department chairs and program coordinators, it is not clear how the programs will be coordinated and overseen at the institutional level.”

Questions were also raised about the “aggressive” timeline for curricular changes, whether two years for students to complete discontinued programs is realistic, and planned changes in the number of student services professional and support staff.

The CT Mirror first published the NEASC response to the Board of Regents for Higher Education draft plan.  The Board of Regents has denied The Mirror’s request for a copy of the plan submitted to NEASC, saying it was a draft submitted for feedback and not ready for public release, the news site reported.

According to CSCU booklets, over the course of the past five years, the institutions of the system have collectively experienced a “precipitous decline” in headcount enrollment, both full-time and part-time, of undergraduate and graduate students. From fall 2011 to fall 2016, enrollment declined 11.1%, from 95,962 students to 85,318 students. Among the CSCU System’s 17 institutions, 16 experienced enrollment declines ranging from 29.4% to 0.6%. Three of the institutions experienced declines greater than 20 percent.  Among the CSCU System’s 17 institutions, 16 experienced enrollment declines ranging from 29.4% to 0.6%. The state has also reduced funding to the colleges and universities, a key driver in the consolidation plans.

Connecticut Bridges Falling Down? One-Third Are Deficient; State’s Highways Ranked 5th Worst for Cost and Condition

Seven states – including Connecticut – report that more than one-third of their bridges are deficient.  The other six are neighboring Rhode Island, Massachusetts and New York, as well as  Hawaii, West Virginia, and Pennsylvania.  Overall, only four states have state highway systems deemed worse than Connecticut, which ranks 46th in the nation, according to a new nationwide analysis of cost and condition. 
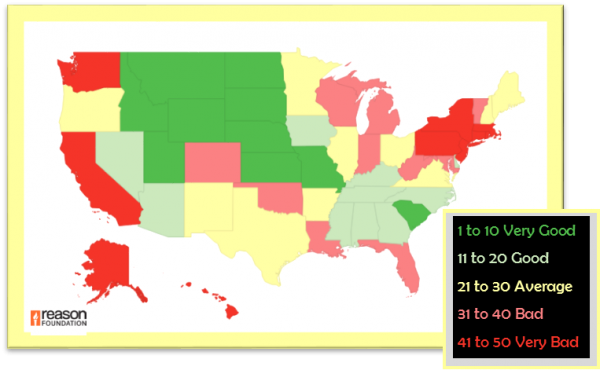
Reason Foundation’s Annual Highway Report ranks the performance of state highway systems in 11 categories, including spending per mile, pavement conditions, deficient bridges, traffic congestion, and fatality rates.  At the bottom were New Jersey, Rhode Island, Alaska, Hawaii and Connecticut.  Topping the list were North Dakota, Kansas, South Dakota, Nebraska, South Carolina and Montana.  New York and Massachusetts were also in the bottom ten, ranked just above Connecticut.

The report indicates that federal law mandates the uniform inspection of all bridges for structural and functional adequacy at least every two years; bridges rated “deficient” are eligible for federal repair dollars. Of the 603,366 highway bridges reported nationwide, 130,623 (about 21.65%) were rated deficient.  In Connecticut, it was 34 percent.  The states with the highest percentage of deficient bridges are all located in the Northeast or along the eastern seaboard.

In the overall rankings, New Jersey ranked last in overall performance and cost-effectiveness due to having the worst urban traffic congestion and spending the most per mile — $2 million per mile of state-controlled highway, more than double what Florida, the next highest state, spent per mile.

The report also considered costs related to state roads and bridges.

In maintenance disbursements, the costs to perform routine upkeep, such as filling in potholes and repaving roads, Connecticut ranked 31st.  On a per-mile basis, maintenance disbursements averaged about $28,020 per state; there has been an upward trend nationally over the past decade, the report points out.

Connecticut ranked on the far end of the spectrum among the states in administrative disbursements for state-owned roads.  On a per-mile basis, administrative disbursements averaged $10,864 per state, ranging from a low of $1,043 in Kentucky to a high of $99,417 in Connecticut.

The report, released this month, is based on spending and performance data that state highway agencies submitted to the federal government for the year 2015, the most recent year with complete data available.  New Jersey ranked last, 50th, in overall performance and cost-effectiveness due to having the worst urban traffic congestion and spending the most per mile — $2 million per mile of state-controlled highway, more than double what Florida, the next highest state, spent per mile.


Hurricanes v. Whalers: Words and Numbers Tell Different Stories

In the midst of the war of words between unrelenting fans of the former Hartford Whalers (joined by Governor Malloy) and the Raleigh News & Observer, which has aimed a cease and desist order at Hartford, it may be worthwhile to delve into the data. It prove to be a distinction without a difference, however. Gov. Malloy’s February 8 letter to Thomas Dundon, a Dallas businessman and new owner of the Carolina Hurricanes, urged that the team return to the Nutmeg State for a regular season game at Rentschler Field or the XL Center so the team could be “embraced by a grateful fan base.”  Doing so, Malloy pointed out, “would make clear that Hartford is a far more viable long-term home for the team than Raleigh.”

When asked days ago by The Sporting News about the 'Canes future in Raleigh, Dundon said: “As long as I’m involved, this is where we’re going to be. One of the best things about this is the people. They’re just nice people here. They care. There’s no reason to be anywhere else.”

In an editorial, the Raleigh newspaper added that if a game were to be played in Hartford, it would be preseason, not regular season, and only because it would be “a chance to hoover some money out of the pockets of long-suffering Whalers fans desperate to see NHL hockey again…  But that’s not going to happen.”

Last season, the Hurricanes had the league’s lowest attendance, averaging 11,776 per home game.  It was their second consecutive season at the bottom of the league in attendance.  In the 2015-16 season, average attendance was 12,203. Midway through this season, after 27 home games, the Hurricanes are averaging 13,039, 29th out of 31 teams in the league.

In the Whalers’ final season in Hartford, 1996-97, attendance at the Hartford Civic Center had grown to 87 percent of capacity, with an average attendance of 13,680 per game.  Published reports suggest that the average attendance was, in reality, higher than 14,000 per game by 1996-97, but Whalers ownership did not count the skyboxes and coliseum club seating because the revenue streams went to the state, rather than the team.

Attendance increased for four consecutive years before management moved the team from Hartford. (To 10,407 in 1993-94, 11,835 in 1994-95, 11,983 in 1995-96 and 13,680 in 1996-97.)  During the team’s tenure in Hartford, average attendance exceeded 14,000 twice – in 1987-88 and 1986-87, when the team ranked 13th in the league in attendance in both seasons.

During the 15 years prior to the past two seasons at the bottom, Carolina has been among the league’s bottom-third in  average attendance eight times, and the bottom-half every season but one.

The Sporting News has reported that Dundon purchased a 61 percent stake in the franchise last month, with Peter Karmanos, who relocated the Whalers to North Carolina in 1997, retaining a 39 percent minority stake. Dundon reportedly has an option to purchase the remainder in three years. He is a New York native, and lived in New Jersey and Houston before Dallas.

The arena's lease in Raleigh expires in 2024.  The team's current playoff drought is the longest of any team in the NHL - nearly a decade.

In the interview, Dundon pointed out “We have a really passionate, loyal season ticket base. The number is just smaller than you’d like it to be, but you have one. Every year that’ll grow. So the only challenge is just the amount of people that you have to touch. It’s inevitable that we’re going to touch them all and we’re going to get them.”

PERSPECTIVE- Nonprofits: Focus on your impact, not your effort!

by Lou Golden Many years ago, I attended a marketing seminar and learned a simple, yet powerful, concept that helped guide me as I led a nonprofit organization.

The instructor, discussing the differences between features and benefits, pointed out that while hardware stores think they are selling drills, customers are actually buying holes. Marketers, he advised us, waste their time advertising features when they should be touting the benefits.

In the nonprofit world, that idea translates into: Focus on the outcomes you create rather than how you create them. Results matter more than process.

Consider this: Many nonprofits stress the size of their organization, the dedication of their staff, the creation of a new strategic plan or the amount of money they raise each year – rather than the impact they have in the community.

Some nonprofits even have crafted mission statements that focus on what they do rather than the what they achieve. I have seen plenty of mission statements that read like this: “Our agency is dedicated to providing services that aim to improve lives and remove barriers in our community.” A better mission statement would be:

“Our agency improves lives and removes barriers in our community.”

Ultimately, it’s important to remember that donors don’t fund nonprofit organizations. They fund outcomes. The nonprofit is simply a vehicle that connects a donor, who has a certain intention, to an outcome that fulfills that intention.

A donor, for example, may want to ensure that people in our community do not go hungry. Rather than trying to figure out how to get meals to hungry people on their own, the donor gives money to a local food pantry that has programs to feed the hungry. In that way, the food pantry connects the donor to the outcome he or she is seeking.

Simon Simek, an author and social scientist made famous by five books and one of the most popular-ever TED Talks, puts the same idea a different way. He urges leaders to “start with the why” -- in other words, first understand the reason your organization exists. Once you’ve done that, you can move on to easier-to-ascertain topics like what you do and how you do it.

Shouldn’t that be the natural order of any communication? Doesn’t your most powerful message have to do with your impact rather than your efforts? Won’t all of your audiences – your donors, your volunteers, your board and your staff – be most moved by a discussion of your higher purpose rather than your capabilities?

It’s easy, as a nonprofit leader, to lose sight of this. It’s hard to see your organization as “a vehicle” that simply produces outcomes that the community needs and that donors want to fund. But once you start seeing your organization in this way, it’s easy to put “the why” first and to imbue all that you do with it. So, for example:

  • The stories you tell as you seek to build donations, gain volunteers, fi nd board members and build your brand should always focus on the difference in the community you actually are making.
  • Your board needs to be, first and foremost, mission-focused. Before you fi ll them in on what you expect them to do (whether it be the size of a personal donation or a requirement to attend all meetings), make sure they are passionate about your organization’s ultimate purpose. Otherwise, they will never be the zealots you need them to be.
  • Do not bog down the speaking portion of your special events with lots of information about what you do and how you do it. Streamline galas, receptions, and golf banquets by focusing only on your impact.

Your guests will be both delighted and motivated.

Last piece of advice: As a leader, experience the outcomes first hand – and do it often. Carve out time on your schedule to see your programs in action, talk to the people you help, watch your program staff at work. It will inspire you – and ground you in the reality of your purpose.

_______________________________

Lou Golden is a consultant focusing on leadership, strategy and communication for nonprofit organizations. He was president and CEO of Junior Achievement of Southwestern New England from 2002 to 2016. Previous to that, he was a journalist, a newspaper company executive and a marketing professional.


SeeClickFix is Only CT Business to Reach GovTech 100

New Haven-based SeeClickFix is the only Connecticut business to make the 2018 GovTech 100, an annual compendium of 100 companies focused on, making a difference in, and selling to state and local government agencies across the United States. SeeClickFix was launched ten years ago this month, according to co-founder Ben Berkowitz: “It began as a ‘nights and weekends’ project between friends with a goal of fixing some small problems locally and a big problem globally. SeeClickFix has become something much bigger than I could have ever imagined.”

Described as “a service to make communities stronger,” the key benchmarks the company points to include: a full time job for 33 employees, a platform that has helped facilitate the resolution of 4 million issues, a space for aspirations in tens of thousands of communities, and the official digital channel for service request resolution for hundreds of governments and tens of millions of their residents.

The annual list, compiled and published by Government Technology,  highlights leaders in the government technology sector – a marketplace that the publication says has ”brought bigger deals, more investment, new companies and many fresh new innovations that moved the needle in the public sector.”

Overall, 32 of the 100 companies are based in California, seven are based in New York, and six are headquartered in Massachusetts.  Rhode Island placed one company, Providence-based software company Utilidata.  There were no other companies based in New England.

“State and local governments have become more willing to try implementing new systems using agile methodologies that fit better with the modern tech world,” the publication pointed out. “They are striking up pilot projects and demonstration agreements that let them try out new ideas before taking the kind of big-dollar risks that government is not amenable to taking.”

“It is no secret that SeeClickFix was built from a place of distrust in the existing bureaucratic process that existed in 2007 for handling citizen concerns,” Berkowitz noted. “The three hundred governments and the thousands of officials that leverage SeeClickFix daily to engage in transparent and responsive communication has more than reversed our distrust.”

SeeClickFix is proving effective in small towns as well as big cities.  The town of Wilton in Southern Connecticut went live with SeeClickFix this past fall and used it at a Winter Carnival and Ice Festival in town this week.

The SeeClickFix blog highlighted the town, explaining that “They are a model town — they have done everything right! They have sustainable marketing, well-crafted goals and benchmarks, a responsive set of municipal departments, a champion in town leadership, and the flexibility necessary to add in request categories when citizens underscore a need.”

SeeClickFix co-founders include Miles Lasater, Kam Lasater, Jeff Blasius.  The company holds an annual User Summit every fall in New Haven, drawing local government customers from throughout the country to share best practices.

https://youtu.be/NYKo5koU_jI

Million Dollar Homes? CT Ranks 6th in USA

There has been discussion during Connecticut’s ongoing state budget shortfall about the disproportionate impact of the state’s wealthiest residents, and how overall state revenues are affected when some of those residents decide to relocate to lower-tax states. Now, national data analyzing million dollar homes is underscoring Connecticut’s standing as being among the states where the ultra-wealthy have roots.

An analysis by Overflow Data and Visual Capitalist ranks Connecticut in the top ten among states with the highest percentage of homes worth more than one million dollars.  Connecticut ranks sixth, with 4.5 percent of homes surpassing that threshold.

Ahead of Connecticut are only Washington, D.C. (17.3%), California (13.6%), Hawaii (13.5%), New York (7%), and Massachusetts (5.2%).

Connecticut’s standing may slip in the coming years.  In a review of cities where million dollar listings have “skyrocketed,” increasing over the past three years, the leaders were Denver, Santa Rosa (CA), Boulder, Truckee (CA), Fredericksburg (TX), Heber (UT) and Boston.

The share of homes valued at more than $1 million has surged more than fourfold since 2002, according to recent data compiled  from real estate site Trulia, which analyzed the luxury real estate market in the top 100 U.S. metropolitan areas, and reported by CBS News.  Across those regions, about 4.3 percent of homes are now worth at least $1 million, compared with about 1 percent in 2002, said Trulia senior economist Cheryl Young told the network.

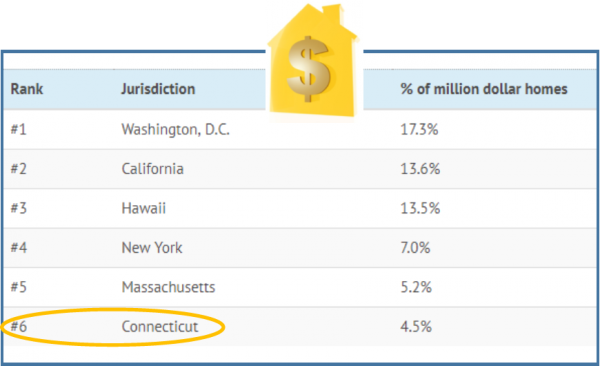
The five metropolitan areas with the largest share of homes worth $1 million in 2017, according to CBS News, are: San Francisco, San Jose, Los Angeles, Fairfield County, CT, and Long Island, New York.

The network reported that rising real estate values, tight inventory and a lack of new construction are contributing to the surge in million-dollar homes. Another factor may be at play: rising income inequality, which has benefited the bank accounts of America's richest families, the network report noted.