Demographics in New England Bring Enrollment Challenges for Higher Education
/Connecticut’s public colleges and universities are pulling out all the stops to bring students back to campus who may have started – and stopped – their pursuit of higher education years ago. Incentive programs – including free classes – are driven by an acute need to counter declining enrollment from “traditional” students that recent data suggests will continue to intensify for years to come.
The New England Journal of Higher Education, using U.S. Census data, found that New England is demographically the oldest and most rapidly aging of the nine Census divisions in the United States. The Journal reported that “Its median age, which is now over 40, has risen by seven years since 1990. This region has six of the 12 states with the most rapidly rising median ages. Maine, Vermont and New Hampshire have the nation’s highest median ages (43.9, 42.4 and 42.3) and also rank first, second and third among the most rapidly aging since 1990.”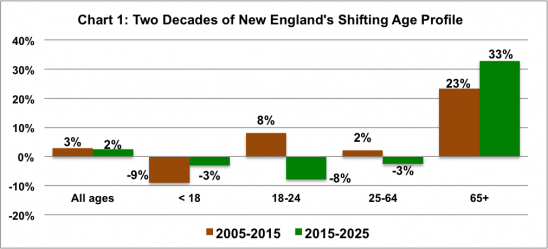
Between the 2000 and 2010 census, the number of children under age 18 in New England declined 197,000 or 6 percent, the Journal reported. From the 2010 census until mid-2013 this region dropped another 102,000 children, and that rate of decline is projected to continue. From 2010 to 2013, every New England state had more people move out than move in. In total, the region lost a net of almost 100,000 people through out-migration in just those three years.
After reaching an all-time peak in 2010, enrollment at Connecticut's 17 community colleges, state universities and the online-only Charter Oak State College – which make up the Connecticut State Colleges and Universities (CSCU) system - dropped to 92,989 last academic year, down 4.3 percent from its peak and its lowest level since 2008. At Central, Southern, Eastern, and Western Connecticut State Universities combined enrollment reached its lowest level in 14 years, Hartford Business Journal has reported.
Writing in the New England Journal, a publication of the New England Board of Higher Education, demographer Peter Francese pointed out that “the most rapidly growing ages in New England are, by far, people aged 65 or older. That combined with the decline in numbers of children portend a very difficult decade for the region’s colleges and universities.”
Using state published projections, he describes “a picture of continuing decline among children, but also forecasts a shift in the 18-to-24 age group and the 25-to-64 age groups from growth in the past to decline in the future. However, the past double-digit growth among residents age 65 or older is projected to continue at an even faster pace over the next 10 years.”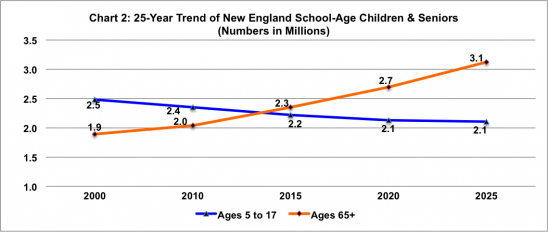
The data and projections also indicate that the region is fast approaching “a tipping point where the number of elderly will increasingly outnumber school-age children.” Francese, director of demographic forecasts for the New England Economic Partnership and founder of the former American Demographics magazine, suggests that “that this trend will mean continuing erosion of financial support for local public education. It may also mean a gradual erosion in the quality of the region’s secondary schools and the consequent impact on those in higher education who depend on having a reliable source of college-ready high school graduates.”
Enrollment at the 17 CSCU institutions in Connecticut for Fall 2014 was down by 1,428 students, or 1.5 percent, from the previous year, according to data compiled by the state Office of Higher Education. The total number of students, 91,192, includes more part-time than full-time students – 47,670 part-time versus 43,522 full-time. At the flagship University of Connecticut, which is outside the CSCU system, enrollment climbed 2.1 percent between 2013 and 2014, boosted by the hiring of additional faculty and additional state funding for "Next Generation UConn" - expansion plans that project increasing enrollment at the university's main campus by one-third over the next decade.
Chart 1: U.S. Census Bureau 2005 population estimates, New England states projections and author’s calculations; Chart 2: Historical data is from the Census Bureau, population projections are by each New England state. These charts first appeared in the New England Journal of Higher Education.