PERSPECTIVE: The State Budget: What Do Demographics Have to Do With It?

by Alissa DeJonge A combination of factors are having a negative impact on state revenues, contributing to budget woes. The different age cohorts in Connecticut’s population tell an important story of one reason revenues are declining. State legislators need to examine Connecticut’s current and future demographics as they look to solve fiscal problems.CT perspective

Much of the daily news centers on the state budget deficit and the lengths that legislators are attempting to go to find ways to balance it. There is a projected $220 million shortfall for this fiscal year that was addressed by legislators on March 29.[1] And the projected shortfall for the next fiscal year is approaching $1 billion. quote 1

Legislators are quite aware that revenues are not coming in to the extent originally anticipated, and that this trend has been occurring for the past number of years. Indeed, Senator Beth Bye, during a March 23 conference about broadband infrastructure,[2] discussed the revenue woes and the dire situation that Connecticut is facing.

What makes this situation particularly serious is the fact that the reasons there is a ‘revenue problem’ have been long in the making, and the trend is poised to continue.

Of course, the overall state economy continues to struggle. Connecticut is one of 10 U.S. states that has not regained all the jobs lost since the last recession.[3] If jobs are sluggish, so too are revenues back to the state. And wage growth, while seeing improvements in 2015, has been relatively flat since the end of the last recession, which also keeps state revenues in a static to declining state.[4]

However, the lack of revenues also involves overall demographic patterns. The figure shows population by age for Connecticut between 2005 and 2015, and projections extending to 2030.

  • The age group over 65 is projected to increase 38% between 2015 and 2030. This will add much pressure to state services such as Medicaid and long term supports and services while at the same pop by age grouptime reducing revenues because this large age cohort is no longer working.
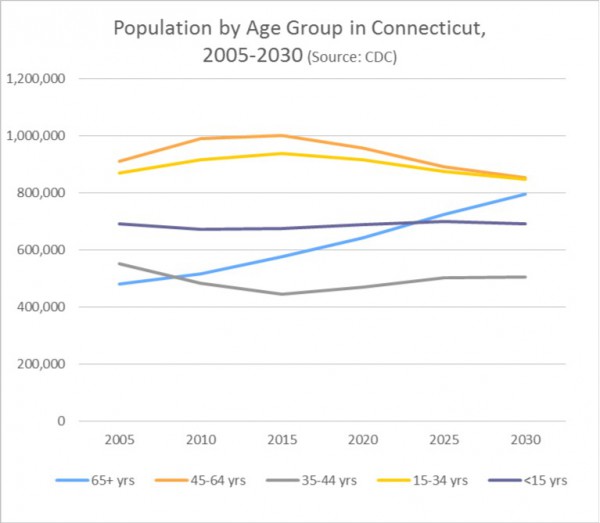
  • The Baby Boomer generation, those who are currently 45-64 years old, comprise the largest share of the state’s population. As they move from employment to retirement, the trend of increasing service needs and lessening revenues will accelerate.
  • Generation Xers will fill many Boomer jobs, but they are a much smaller group, which means that state revenues are unlikely to regain their previous higher levels because fewer people will be producing outputs.
  • The current Millennials (roughly ages 15-34 years) and the even younger Generation Z population have more people in their age groups then the Generation Xers. Therefore, demographic trends should eventually contribute to increasing state revenues. But it will be well over a decade before the Millennials begin to gain seniority and higher wages in the workforce and contribute more to the state revenues.
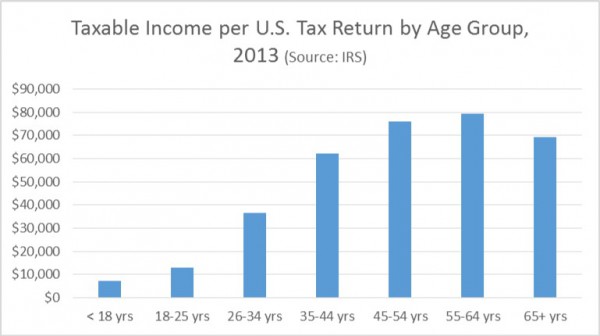
taxable incomeThis figure shows how taxable income ebbs and flows by age group. The Baby Boomers are in the best position to contribute to state revenues right now. However they are retiring in a consistent fashion, and the next younger cohort, of which there are fewer people to begin with, is earning less than their mature counterparts. This sets up a long-term issue for state revenue potential, one that will not be mitigated until the larger Millennial age cohort gets into their more profitable working years.

Revenue expectations are not what they used to be. In the 1960s, the economy consistently grew between three and five percent each year, and Americans assumed that it would continue to grow at that pace.  As a result, government was able to fund additional programs as economic and tax bases kept expanding. Today the economy is growing at only around two percent each year. This economic trend reduces the ability for the government to fund programs, and all demands cannot be met, with the current revenues coming in.[5]

If you multiply the taxable income per return by the number of people in each demographic group in both 2015 and 2030, excluding inflation, there would be a four percent decrease in the projected total amount of taxable income in the state.  This illustrates the effect of demographic trends on taxable income. Without even considering job trends, wage trends, or other long-term economic factors, the demographic shifts of the population are going to make it even more challenging for state governments to raise revenues.quote 2

The state revenue problem will not resolve itself with this legislative session, or even the next. While the current revenue problems are a combination of many factors, the demographic influence is significant and should not be overlooked because it can provide insight for decades into the future.

Since there are a number of longer term, structural issues that will continue to affect the state’s ability to raise revenues for many years, stakeholders and policymakers will have to adjust to this new economic reality. Prioritization of programs with specific intended targeted outcomes is the approach to the state budgeting process needed now.

_________________________________

Alissa DeJonge is Vice President of Research, Connecticut Economic Resource Center Inc. (CERC).

PERSPECTIVE commentaries by contributing writers appear each Sunday on Connecticut by the Numbers.

LAST WEEK: Freedom's Just Another Word For... 

_________________________________

[1] http://www.nbcconnecticut.com/news/local/Vote-on-State-Budget-Deficit-Expected-Tuesday-373779281.html (Accessed March 29, 2016)

[2] High-Speed Broadband Internet Infrastructure Informational Conference: A Toolbox for Municipalities (March 23, 2016)

[3] http://www.usnews.com/news/business/articles/2016-03-25/job-totals-trail-pre-recession-levels-in-10-us-states (Accessed March 29, 2016), from U.S. DOL calculations of jobs changes, December 2007 – February 2016.

[4] http://www.washingtontimes.com/news/2015/oct/8/comptroller-connecticut-wage-growth-continues-to-l/ (Accessed March 29, 2016)

[5] Robert Samuelson, Trump’s Wrong – We’re Hugely Well-Off (Op-Ed), The Hartford Courant, March 28, 2016.

Demographics in New England Bring Enrollment Challenges for Higher Education

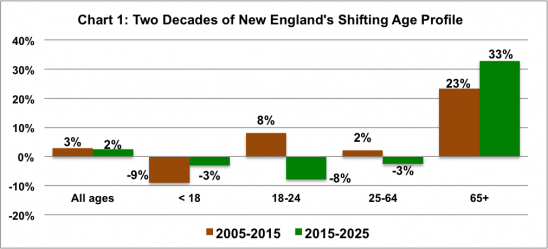
Connecticut’s public colleges and universities are pulling out all the stops to bring students back to campus who may have started – and stopped – their pursuit of higher education years ago.  Incentive programs – including free classes – are driven by an acute need to counter declining enrollment from “traditional” students that recent data suggests will continue to intensify for years to come. The New England Journal of Higher Education, using U.S. Census data, found that New England is demographically the oldest and most rapidly aging of the nine Census divisions in the United States. The Journal reported that “Its median age, which is now over 40, has risen by seven years since 1990. This region has six of the 12 states with the most rapidly rising median ages. Maine, Vermont and New Hampshire have the nation’s highest median ages (43.9, 42.4 and 42.3) and also rank first, second and third among the most rapidly aging since 1990.”Chart-1_Franchese-548x249

Between the 2000 and 2010 census, the number of children under age 18 in New England declined 197,000 or 6 percent, the Journal reported. From the 2010 census until mid-2013 this region dropped another 102,000 children, and that rate of decline is projected to continue. From 2010 to 2013, every New England state had more people move out than move in. In total, the region lost a net of almost 100,000 people through out-migration in just those three years.

After reaching an all-time peak in 2010, enrollment at Connecticut's 17 community colleges, state universities and the online-only Charter Oak State College – which make up the Connecticut State Colleges and Universities (CSCU) system - dropped to 92,989 last academic year, down 4.3 percent from its peak and its lowest level since 2008.  At Central, Southern, Eastern, and Western Connecticut State Universities combined enrollment reached its lowest level in 14 years, Hartford Business Journal has reported.

Writing in the New England Journal, a publication of the New England Board of Higher Education, demographer Peter Francese pointed out that “the most rapidly growing ages in New England are, by far, people aged 65 or older. That combined with the decline in numbers of children portend a very difficult decade for the region’s colleges and universities.”

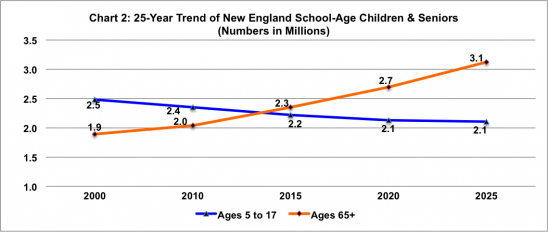
Using state published projections, he describes “a picture of continuing decline among children, but also forecasts a shift in the 18-to-24 age group and the 25-to-64 age groups from growth in the past to decline in the future. However, the past double-digit growth among residents age 65 or older is projected to continue at an even faster pace over the next 10 years.”Chart-2_Franchese-548x232

The data and projections also indicate that the region is fast approaching “a tipping point where the number of elderly will increasingly outnumber school-age children.”  Francese, director of demographic forecasts for the New England Economic Partnership and founder of the former American Demographics magazine, suggests that “that this trend will mean continuing erosion of financial support for local public education. It may also mean a gradual erosion in the quality of the region’s secondary schools and the consequent impact on those in higher education who depend on having a reliable source of college-ready high school graduates.”

Enrollment at the 17 CSCU institutions in Connecticut for Fall 2014 was down by 1,428 students, or 1.5 percent, from the previous year, according to data compiled by the state Office of Higher Education.  The total number of students, 91,192, includes more part-time than full-time students – 47,670 part-time versus 43,522 full-time.  At the flagship University of Connecticut, which is outside the CSCU system, enrollment climbed 2.1 percent between 2013 and 2014, boosted by the hiring of additional faculty and additional state funding for "Next Generation UConn" - expansion plans that project increasing enrollment at the university's main campus by one-third over the next decade.

Chart 1: U.S. Census Bureau 2005 population estimates, New England states projections and author’s calculations; Chart 2: Historical data is from the Census Bureau, population projections are by each New England state.  These charts first appeared in the New England Journal of Higher Education.

Hartford County Population Losses Go Near and Far, Gains Are Fewer and Closer

Each day in the United States, about 130,000 people move from one county to another.  That’s the bottom line of the new migration patterns released by the U.S. Census Bureau, which include a web mapping application intended to provide users with a simple interface to view, save and print county-to-county migration flows maps of the United States. The data are from the 2006-2010 American Community Survey (ACS).

In Hartford County, for example, there were 17,442 who moved here from a different state, but 20,524 who moved to another state.  In addition, there were 14,982 people who moved to Hartford County from another of the state’s eight counties.  There were also 5,212 people who moved to Hartford County from abroad, according to the Census data.

The American Community Survey (ACS) is an ongoing survey that provides data every year -- giving communities the current information they need to plan investments and services. Information from the survey generates data that help determine how more than $400 billion in federal and state funds are distributed each year.  The detailed data is combined into statistics that are used to help decide everything from school lunch programs to new hospitals, according to thecensus Census Bureau.

Hartford County’s strongest outward bound numbers are reflected elsewhere in Connecticut, and to North Carolina.  The top losses of population were:  827 people to Tolland County, 743 to Windham County, 305 to Wake County in North Carolina, 299 to Providence County in Rhode Island, and 286 to New London County, 261 to Worcester County, MA and 226 to Mecklenburg County in North Carolina.

The population gains in Hartford County were led by other parts of the state, and New York City.  The top six:  1,005 people from New Haven County, 599 from Fairfield County, 555 from Brooklyn, 548 from the Bronx, and 368 from Middlesex County and 300 from Westchester.

The web mapping application provides data for Hartford, Windham, New Haven, Middlesex, Tolland, Fairfield, Litchfield and New London counties.  In addition to the maps, the data can also be imported into spreadsheets.

CT Dog Ownership Ranks 49th in the USA; More Cats than Dogs in State

Cats – not dogs – are reigning in Connecticut.  The state ranks a lowly 49th in dog ownership and 23rd in cat ownership, according to a new survey. The data revealed that 28.3 percent of households in the state own a dog, 31.9 percent own a cat, and 54.4 percent own a pet, slightly below the national average. The state is middle-of-the-pack for overall pet ownership - ranking 34th in the country, as reflected in newly released statistics from The American Veterinary Medical Association (AVMA) in its U.S. Pet Ownership & Demographics Sourcebook.  The survey indicated that 379,000 Connecticut households own at least one dog, while 427,000 own at least one cat.   The number of cats in Connecticut exceed the number of dogs by 289,000 (796,000 to 507,000).

The survey is conducted by the AVMA every five years and includes a breakdown of pet ownership by state. The most recent survey, conducted in 2012 based on December 31, 2011 numbers, indicates that nationally between 2006 and 2011:

  • the percentage of households that made no trips at all to the veterinarian increased by 8 percent for dog owners and a staggering 24 percent for cat owners. pet book
  • about 81 percent of dog owning households made at least one visit to the veterinarian in 2011, down 1.7 percent from 2006.
  • the decrease for cat owners was, once again, much higher, as only 55.1 percent of cat owners made at least one visit to the veterinarian in 2011, down 13.5 percent from 2006.

Connecticut’s dog ownership levels lagged in the 2006 survey was well, when the state ranked 47th.  The only state to rank in the top ten for cats and dogs in the latest survey was West Virginia, which ranked #5 in dogs and #6 in cat ownership.  The number one state for pet ownership, Vermont, also led the way in cat ownership.  Nearly half the households in the state – 49.5 percent – own a cat, according to the survey.  Vermont is the only state to exceed 70 percent in overall pet ownership, with 70.8 percent.

National statistics reflect the affection for, and costs of, having a pet:

  • Six out-of-ten pet owners, or 63.2 percent, considered their pets to be family members.
  • There are approximately 70 million pet dogs in the U.S. and 74.1 million pet cats.
  • The average veterinary expenditure per household for all pets was $375 (for 2011).

When it comes to veterinary visits, cats are feeling the pinch of the nation's economic downturn. Although 75 percent of cat owners believe check-ups are important, the number of households taking their cat to the veterinarian just once a year has dropped 13.5% in the past five years.  Of those surveyed, 22 percent said they didn’t take their cat to the vet because they couldn’t afford to do so.  Close to 30 percent of dog owners who didn’t take their dog to the vet in 2011 cited the same reason.

For more information about the AVMA or to obtain a copy of the U.S. Pet Ownership and Demographics Sourcebook, visit www.avma.org. To learn more about Dog Owners vs. Cat Owners, check out the infographic at topreveal.com