Connecticut Volunteers Pursue National Service; AmeriCorps to Celebrate 20th Anniversary

More than 3,700 people of all ages and backgrounds are helping to meet local needs, strengthen communities, and increase civic engagement through national service in Connecticut, according to data compiled by the Corporation for National & Community Service. Serving at more than 600 locations throughout the state, these citizens tutor and mentor children, support veterans and military families, provide health services, restore the environment, respond to disasters, increase economic opportunity, and recruit and manage volunteers.

During this past fiscal year, the Corporation for National and Community Service (CNCS) committed more than $9,390,000 to support Connecticut communities through national service initiatives. Through a unique public-private partnership, this federal investment leveraged an additional $2,720,000 in other resources to strengthen community impact, build local support, and increase return on taxpayer dollars.AC_20

Most AmeriCorps grant funding goes to the Connecticut Commission on Community Service within the state Office of Higher Education, which in turn awards grants to nonprofit groups to respond to local needs. AmeriCorps expected to provide more than 900 individuals the opportunity to provide intensive, results-driven service to meet education, environmental, health, economic, and other pressing needs in communities across Connecticut.

Nationally, AmeriCorps celebrates its 20th anniversary this month.  President Obama is scheduled to participate in a ceremony with AmeriCorps members at the White House on September 12 as part of a nationwide event marking the 20th anniversary of the AmeriCorps national service program.

The Connecticut Commission on Community Service administers programs under the National and Community Service Trust Act of 1993. The Commission is dedicated to supporting service and civic engagement to strengthen communities throughout Connecticut. In partnership with the Office of Higher Education, the Commission funds and supports programs that encourage all Connecticut residents to volunteer.  The Commission’s next meeting is scheduled for October 7.

Other individuals – in Connecticut and nationwide - serve their fellow citizens through AmeriCorps VISTA, whose members help bring individuals and communities out of poverty by serving full-time to fight illiteracy, improve health services, create businesses, and increase housing opportunities, and AmeriCorps NCCC (National Civilian Community Corps), a 10-month, full time residential program for men and women between the ages of 18 and 24. In exchange for their service, AmeriCorps members earn an education award that can be used to pay for college or to pay back qualified student loans.

In addition to the AmeriCorps participants, more than 2,800 seniors in Connecticut contribute their time and talents in one of three Senior Corps programs.logo community service

  • Foster Grandparents serve one-on-one as tutors and mentors to more than 1,000 young people who have special needs.
  • Senior Companions help more than 270 homebound seniors and other adults maintain independence in their own homes.
  • RSVP volunteers conduct safety patrols, renovate homes, protect the environment, tutor and mentor youth, respond to natural disasters, and provide other services through more than 230 groups across Connecticut.

The Corporation for National and Community Service is a federal agency that improves lives, strengthens communities, and fosters civic engagement through service and volunteering. Members of the Connecticut Commission on Community Service are appointed by the Governor and serve three-year terms. Commission members represent various areas of expertise as required by the National and Community Service Trust Act.


AmeriCorps video


Hartford Region Ranks #4 in USA in Digital Coupon Clicking, Survey Says

Coupons are fast-becoming money savers that are clicked, not clipped, and in few regions is that more the trend than in Greater Hartford.  Newly released data indicates that the Hartford-West Hartford-East Hartford market ranks #4 in the nation in the level of click activity, just behind New York, Boston and Philadelphia. According to results of a survey conducted by RetailMeNot, a leading digital offers destination, in conjunction with The Omnibus Company, the number of Americans who rely mostly on mobile coupons has been steadily increasing, as traditional scissor-clipped declines.

The study found that over the past four years, the use of printable coupons has dropped to 58 percent in 2014 from 73 percent in 2010. However, digital coupon usage has increased substantially as the world has gone more digital with online (27% in 2014 vs. 16% in 2010) and mobile (15% in 2014 vs. 4% in 2010) coupon usage.DigitalCoupon1

The latest edition of the company’s Shoppers Trend Report revealed that nearly all Americans (96 percent) are coupon users, and retailers and brands are steadily moving their marketing promotions to more mobile and digital formats. A separate survey of retail executives in May 2014, also conducted by The Omnibus Company, found that 75 percent of retailers believe that digital advertising delivers a higher ROI than offline advertising, including circulars and direct mail.

September has been designated as National Coupon Month, and based on the level of coupon click activity in ratio with each city’s population, the Northeast is leading the way.  Rounding out the top ten after New York, Boston, Philadelphia and Hartford are Providence, Baltimore, Pittsburgh, Washington, Tampa and Buffalo.

Western communities appear to lag in their savings activity, with the Las Vegas, Phoenix and Denver areas representing the bottom of the active-coupon-user list. In fact, the New York, Boston and Philadelphia areas appear to be four times more active than the Denver area at couponing, according to survey analysts.

In the top 10 active couponing cities, clothing and food categories ranked consistently at the top for click activity, followed by electronics and home and garden.Coupon

“Our survey findings show how a consumer’s mobile phone is becoming a key device within their savings tool kit as millions of shoppers increasingly take advantage of digital offers, promotions and sales opportunities.” says Trae Bodge, senior lifestyle editor for The Real Deal by RetailMeNot.

They survey also found that printable coupon usage for 18- to 34-year-olds dropped significantly in the past four years (40% in 2014 vs. 57% in 2010), and online coupon usage nearly tripled for those ages 50+ over the past four years (18% in 2014 vs. 7% in 2010).

According to the survey deep discounts aren’t the only deals that shoppers appreciate, as more than 2 in 5 (43%) coupon users consider discounts up to 25 percent to be a good deal. Respondents said they are most interested in deals that offer a specific dollar amount off of their purchase (30%).  The survey also shows that interest in different types of deals varies by region.

  • Coupon users living in the Northeast are more likely than those living in other regions to be most interested in receiving a specific percentage off a purchase (28% vs. 18% of the rest of the country).
  • Those living in the South are more likely than those living elsewhere (26% vs. 15% of the rest of the country) to be most interested in “buy one, get one free” deals.

In an August 2014 commissioned study conducted by Forrester Consulting on behalf of RetailMeNot, an overwhelming 59 percent of respondents stated that out of all the different types of promotions a retailer can employ, digital coupons still sway them the most when it comes to influencing a purchasing decision. The study also found that:

  • 63 percent of respondents agreed that digital coupons “close the deal” for them when undecided on a purchase,
  • More than 90 percent of smartphone and tablet users redeem their digital coupons within several days,retailmenot_logo_lg
  • Nearly 7 in 10 consumers (68%) said they strongly believe that digital coupons have a positive impact on a retailer’s brand
  • 68 percent state that coupons generate loyalty

RetailMeNot, Inc. operates what the company describes as the world’s largest marketplace for digital offers, and for the 12 months ended June 30, 2014, the company had more than 625 million visits to its websites.  See the complete list of the top 50 cities.

Top Cities (and Surrounding Metro Areas) Based on Click Activity

  1. New York-Newark-Jersey City
  2. Boston-Cambridge-Newton
  3. Philadelphia-Camden-Wilmington
  4. Hartford-West Hartford-East Hartford
  5. Providence-Warwick
  6.  Baltimore-Columbia-Towson
  7.  Pittsburgh
  8. Washington-Arlington-Alexandria
  9. Tampa-St. Petersburg-Clearwater
  10. Buffalo-Cheektowaga-Niagara Falls

Hurricane Sandy: 3rd Costliest Insured Loss Catastrophe Worldwide Since 1970

Hurricane Sandy, which hit Connecticut and the Northeast in October 2012, produced the 3rd costliest insured loss in the past 43 years, according to data compiled by Swiss Re and reported by Bloomberg. East Haven
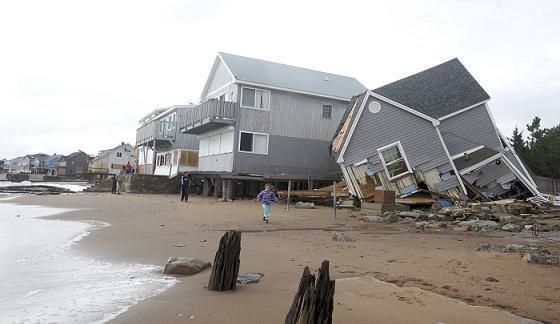
Half of the 15 costliest catastrophes since 1970 have occurred in the past 10 years.  The analysis methodology, going back to 1970,  reviewed loss including property and business interruption, excluding liability and life insurance losses.  It was released this week by Bloomberg Businessweek.

Hurricane Sandy was reported to have an insured loss of $36.9 billion.   The Federal Emergency Management Agency has reported that although New England was spared the brunt of the storm, residents and businesses along the shores of Connecticut, Rhode Island, Massachusetts and New Hampshire suffered severe damages from wind and water, many losing homes and livelihoods.  New York and New Jersey were also hard-hit by the record-setting storm, which disrupted livelihoods, transportation and electricity grids and countless industries.

The top ranked insured lost was Hurricane Katrina, which catastrophically hit the Gulf Coast in August 2005, which losses estimated at $80.3 billion.  Next costliest was the earthquake which triggered a tsunami in Japan in March 2011, with an insured loss of $37.6 billion.  All loss amounts were indexed to 2013, for purposes of comparison.

Rounding out the top five costliest insured losses of nearly the past half-century were Hurricane Andrew, which hit Florida, neighboring states and the Bahamas in August 1992, with an insured loss of $27.6 billion and the terrorist attack on the World Trade CenHurricaneSandyter and the Pentagon on September 11, 2001, with insured losses of $25.6 billion.

Also ranked in the top 10 were the Northridge, California earthquake in 1994, Hurricane Ike in 2008, Hurricane Ivan in 2004, flooding in Thailand in 2011, and a New Zealand earthquake in 2011.

A September 2013 report by the U.S. Department of Commerce Economics and Statistics Administration had estimated that the total payout by the insurance industry related to Hurricane Sandy was expected to be reduced because much of the storm damage was caused by the storm surge and subsequent flooding was not covered by standard homeowner or small business commercial policies. Also, reportedly half of all losses of the insurance industry were expected to be covered by reinsurers.  The report indicated that the Insurance Information Institute estimated that insurers would pay $18.75 to $25 billion to over 1.5 million policyholders across 15 states including Connecticut, and the District of Columbia.  More than two-thirds of claims were anticipated from homeowners, with the highest value of claims  from commercial property owners ($9 billion)accounting for almost half of the value of claims paid, the report indicated.

The insurance industry had its third-most expensive year on record in 2012, led by Hurricane Sandy, with global economic losses from natural catastrophes and man-made disasters totaling $186 billion, according to a previous report issued by Swiss Re.


Immigration Reform: Economic Impact in Connecticut

As the fate of immigration reform remains unresolved in Congress, plays out on the nation’s borders, and is debated  in states around the country - including Connecticut -  the potential economic benefits remain an element in the debate.  Connecticut-centric data seeks to provide local context as a new national immigration policy is considered and stalled and considered again in Washington, D.C. Some highlights, as released by the White House, point out that immigration reform will “strengthen Connecticut’s economy and creates jobs.”  Some of the data points that have been part of the past year's debate:

• Immigrants alreaImmigration-reformdy make important contributions to Connecticut’s economy. For example, Connecticut’s labor force is 16.7% foreign-born.

• 18.5% of Connecticut business owners are immigrants. These businessmen and women generate $2.05 billion in income for Connecticut each year.

• In Connecticut, 38.2% of science, technology, engineering, and math (STEM) graduates at the state’s most research-intensive schools are foreign-born. Also, 68.2% of the state’s engineering PhDs are foreign-born.

• According to Regional Economic Models, Inc., a set of reforms that provides a pathway to earned citizenship and expands a high-skilled and other temporary worker programs would together boost Connecticut’s economic output by $568 million and create approximately 6,904 new jobs in 2014.  By 2045, the boost to Connecticut’s economic output would be around $3 billion, in 2012 dollars.

The White House has also indicated that “common sense immigration reform increases workers’ income, resulting in new state and local tax revenue, contribute to the recovery of Connecticut’s housing market and strengthen Connecticut’s technology, agriculture, and tourism industries:

• Providing a pathway to earned citizenship and expanding high- and low-skilled visa programs will increase total personal income for Connecticut families by $1.6 billion in 2020, according to Regional Economic Models, Inc.

•  Immigration reform would have increased the state and local taxes paid by immigrants in Connecticut by approximately $29 million in 2010, according to one study.

• Immigrants significantly increased home values in Connecticut between 2000 and 2010 - in New Haven County, the increase was $2,680 for the median home.

• There are 4,916 farms in Connecticut that sell approximately $552 million in agricultural products. Noncitizen farm workers accounted for 24% of all farm workers in Connecticut between 2007 and 2011. According to one study, in 2020 an expanded temporary worker program would mean 264 new jobs for U.S. citizens and immigrants (including jobs not only in agriculture, but also retail trade, construction, and other sectors) in Connecticut, and increase Connecticut’s real personal income by $15 million in 2012 dollars.

• These provisions will increase tourism to the U.S., including to Connecticut - which saw approximately 307,000 overseas visitors in 2011.

An August 2014 poll by FOX News found that by a more than three-to-one margin, voters nationwide would pick immigration reform that only includes a pathway to citizenship over no Congressional action at all.  The  poll finds 65 percent of voters prefer legislation that only focuses on creating a pathway for certain illegal immigrants if that’s the only action Congress takes on immigration this year.   The survey also found substantial bipartisan agreement on the issue: 76 percent of Democrats and 56 percent of Republicans say something is better than nothing on immigration reform, and 60 percent of independents agree, FOX News reported.

Fraud Watch Aims to Limit Costly Scams Targeting Elderly

Connecticut state agencies are collaborating, in concert with private sector organizations, to protect senior citizens from elder abuse.  In issuing an Executive Order, Governor Malloy directed agencies to identify ways to increase public awareness, reporting and social network support of elder abuse victims, consider ways to improve programs for elder abuse victims, and identify best practices in elder abuse prevention, detection and intervention. Recent surveys by AARP underscore the susceptibility of seniors to identity theft and fraud, reporting that seniors were likely to have engaged in behaviors including:fraud

  • Clicked on pop-up ads – 26 percent of victims and 10 percent of non-victims said they had done so in the previous seven days;
  • Opened an email from an unknown person – 27 percent of victims and 17 percent of non-victims said they had done so in the past seven days;
  • Signed up for free trial offers – 18 percent of victims and 8 percent of non-victims had done so in the previous week.

Fraud victims were also found to have experienced the following life experiences, which may have impacted the susceptibility statistics cited:

  • Sixty-six percent of victims and 42 percent of non-victims said they “often or sometimes feel isolated.”
  • Twenty-three percent of victims and 10 percent of non-victims said they had experienced loss of a job.
  • Forty-four percent of victims and 23 percent of non-victims said they had suffered a “negative change in financial status” in the past two years. fraud watch

Connecticut AARP is a member of the state’s Elder Justice Coalition Coordinating Council, which convened this summer, and one of the 16 agencies appointed by the Commissioner of the State Department on Aging to work on elder justice issues.  AARP is leading the Consumer Fraud Education workgroup which has hit the ground running with the recent launch of the AARP Fraud Watch Network – a national campaign that connects people to experts, law enforcement and people like them who can help them spot and avoid scams.

As part of the CT Elder Justice Coalition, AARP Connecticut is working with state, federal and community organizations across the state utilizing Fraud Watch Network resources to educate older adults and their families about scams and provide tools and information to prevent identity theft and fraud.

Fairfield Chief of Police, Gary MacNamara, representing the CT Police Chiefs Association and a member of the CT Elder Justice Coalition, stated, “Police officers understand efforts to prevent our community members from being victims is really important.  The first step in prevention is awareness.  The AARP Fraud Watch Network provides a great place for older adults and families to get accurate information and become aware of the threat.”seniorlady-570x230

Last fall, a survey of nearly 2,400 U.S. adults age 40 and older conducted by the FINRA Foundation revealed that financial fraud solicitations are commonplace.  Many Americans are unable to spot fraudulent sales pitches, and older Americans (age 65 and older) are particularly vulnerable.

Specific findings include:

  • Over 80 percent of respondents have been solicited to participate in potentially fraudulent schemes, and over 40 percent of those surveyed cannot identify some classic red flags of fraud.
  • More than 8 in 10 respondents were solicited to participate in a potentially fraudulent offer. And 11 percent of all respondents lost a significant amount of money after engaging with an offer.
  • More than 4 in 10 respondents found an annual return of 110 percent for an investment appealing, and 43 percent found "fully guaranteed" investments to be appealing.
  • Americans age 65 and older are more likely to be targeted by fraudsters and more likely to lose money once targeted.

According to AARP volunteer and Executive Council member, Byron Peterson, “Identity theft, investment fraud and scams rob hard-working Americans of billions of dollars each year – with older adults often the biggest targets.  Through the AARP Fraud Watch Network, we’re arming people with information about what makes them vulnerable and giving them access to the tools they need to outsmart con artists before they strike.”AARP

The FINRA Foundation's survey found that 64 percent of those surveyed had been invited to an "educational" investment meeting that was likely a sales pitch. Additionally, 67 percent of respondents said they had received an email from another country offering a large amount of money in exchange for an initial deposit or fee. Upon being solicited for fraud, older respondents were 34% more likely to lose money than respondents in their forties.

In collaboration with partner agencies and organizations, AARP staff and volunteers are making fraud prevention presentations to community groups and encouraging all residents to sign up for watchdog alerts and stay abreast of current scams through the AARP Fraud Watch Network.  Available free of charge to AARP members and non-members alike, and people of any age, the Fraud Watch Network provides an array of educational information and access to individuals who share experiences and provide expertise.

CT's Population Remarkably Stable for a Century, Data Shows

Connecticut’s nickname as the Land of Steady Habits, is well-earned, as evidenced by a review of population origin during the past century.   Connecticut's domestic migration pattern has been remarkably steady through the decades, and most of the change has been due to immigration, according to data compiled by The New York Times. The hundred year comparison:  In 1900, 57 percent of the state’s residents were born in Connecticut.  A century later, in 2000, a nearly identical 55 percent of the state’s pCT bornopulation was born in Connecticut.

The percentage of Connecticut residents born outside the United States was as high as 29 percent in 1910, steadily declined to a low of 10 percent in 1970 and 9 percent in 1980 and 1990, and then began to slowly climb, reaching 11 percent in 2000 and 14 percent in 2012.

The breakdown of Connecticut’s population origins, between 1900 and 2012, as reported in The New York Times, is currently:

  • 55 percent born in Connecticut,
  • 14 percent born outside the U.S.
  • 10 percent born in New York,
  • 6 percent born in other states in the Northeast,
  • 4 percent born in Massachusetts,
  • 4 percent born in states in the South,
  • 3 percent born in other U.S. states (excluding the Northeast, South and Midwest),
  • 3 percent born in Midwest states,
  • 2 percent born in states in the Western U.S.

In 1900 and 2000, four percent of the state’s residents were born in neighboring Massachusetts.

By way of comparison, the percentage of Massachusetts’ population born in the Bay State was 55 percent in 1900 and 63 percent in 2012.  In New Hampshire the percentage of native born was 60 percent in 1900 and 42 percent in 2012 – when one quarter of the population, a robust 25 percent, were born in neighboring Massachusetts.  In Rhode Island, the population was 51 percent native born in 1900 and 57 percent in 2012.  Only 9 percent of Rhode Island’s recent population was born in Massachusetts.

The states with the lowest percentage of their population born in-state are Nevada, 25 percent; Florida, 36 percent; Arizona, 38 percent; Wyoming, 40 percent; and Alaska, 42 percent.

On the opposite end of the spectrum, 79 percent of Louisiana’s population was born in the state; 77 percent of Michigan’s; 75 percent of Ohio’s and 74 percent of Pennsylvania’s.

The largest immigrant population, by percentage?  California at 28 percent, New York at 25 percent, Florida at 23 percent and Nevada at 21 percent.

An interactive feature highlights the state-by-state data on the Times website.USA map

Pay Equity Gap Between Men and Women Begins As Children, Studies Show

The stubborn pay equity gap between men and women – larger in Connecticut than some neighboring states – apparently has its roots in childhood. National surveys indicate that parents are more likely to give their sons an allowance than their daughters. Among all young people surveyed, 67 percent of boys compared with 59 percent of girls say they get an allowance from their parents, according to Junior Achievement USA® (JA) and The Allstate Foundation’s 2014 Teens & Personal Finance Survey.allowance hand

A study by the University of Michigan Institute for Social Research found that girls do two more hours of housework a week than boys, while boys spend twice as much time playing. The same study confirmed that boys are still more likely to get paid for what they do: they are 15 percent more likely to get an allowance for doing chores than girls.  Study Director Frank Stafford indicated that the trend continues into adulthood. allowance graphic

Writing this month in the National Journal, Connecticut Congresswoman Rosa DeLauro pointed out that “right now, women make less than men in nearly every occupation for which wage data are tracked. One year out of college, women are paid 18 percent less than their male counterparts. Ten years out of college, the wage gap leaves women earning 31 percent less.  Over a 35-year career, these earnings discrepancies swell to exceedingly large sums. Across the entire workforce, the average career-long pay gap is $434,000. For college-educated women, the pay deficit averages $654,000.”

Earlier this year, CT Mirror reported that “women in Connecticut earn about 78 percent of what men make.  Numbers from the 2012 Census show that Connecticut's gender wage gap is wider than in many other states in the Northeast; and that, within the state, the gender difference varies as well. The most pronounced gap…is in Fairfield County.”

In a November 2013 report, the Governor’s Gender Wage Gap Task Force indicated that “Connecticut still has a long way to go before the gender wage gap is eliminated.”  The 14-member task force found that that “more mothers than ever before are the sole or primary breadwinners of their families. Yet, women in Connecticut are more likely than men to live in poverty and below the self-sufficiency standard. 24% of households in Connecticut headed by women with children fall below the federal poverty level. Eliminating the wage gap would provide critical income to these families.”

The report also indicated that “among all full-time, year-round workers, Connecticut women earn, on average, 22%-24.2%less than men. This gap is even more pronounced among minority women. Understanding this inequity is not a simple matter. Many factors contribute to the overall wage gap including education and skills, experience, union membership, training, performance, hours worked and the careers women and men choose. However, even after these factors are controlled for, an estimated wage gap of 5-10% remains.”

In 2012, the National Partnership for Women and Families reported that “If the wage gap were eliminated, a working woman in Connecticut would have enough money for approximately:

  • 109 more weeks of food
  • 7 more months of mortgage and utilities payments
  • 14 more months of rent
  • 44 more months of family health insurance premiums
  • 3,410 additional gallons of gas

The Connecticut Task Force issued a series of recommendations to address the pay equity gap, focused on current workplaces, businesses, training and education.  Apparently, efforts need to begin sooner, when youngsters begin household chores and ask for an allowance.

gender gap map

Summer Sandwiches: Lobster Roll is Connecticut Standout, Zagat Says

When Zagat’s decided to take a bite into the uniqueness of sandwiches during August (It is national sandwich month! Who knew?) – highlighting particularly noteworthy culinary endeavors in every state in the nation – the focus in Connecticut landed squarely on the lobster roll. Their review of “delicious regional sandwiches” found in each state had some overlap (Maine was also noted for its Lobster Roll, for example) and some regional favorites with a national following. And some surprises (see bison, reindeer, and marshmallow, below). zagat_logo

“While many consider the cold, mayonnaise-driven Maine lobster roll to be the quintessential version of the sandwich, the first lobster roll was actually a hot, buttered one served at a restaurant called Perry’s in Milford, Connecticut, in the 1920s,” Zagat’s explained. “This version is usually simpler, featuring just lobster meat, butter, and maybe some black pepper or lemon juice on a grilled, split-top hot dog bun, and served with potato chips or French fries. “

Cited by the Zagat surveyhotlob600 was Abbott’s Lobster in the Rough in Noank, founded in 1947. “They take the simplicity of the Connecticut-style hot lobster roll and turn it into an art form. Their award-winning sandwich is made with a full quarter-pound of lobster meat (more than is found in the average small lobster) drenched in melted creamery butter and heaped onto a bun. It’s a sandwich so opulent, it’s well worth the trip to this far-off-the-beaten-path lobster pound to get one (not to mention the crowds you have to battle to order).”

Noteworthy in the region were the Italian Sub in New Jersey and the Italian Grinder in Rhode Island. (A distinction without a difference?) In Massachusetts, the Zagat selection was the Fluffernutter: “The delectable marshmallow fluff was in fact invented in Somerville, Massachusetts, in 1917. A man named Archibald Query sold it door-to-door before he sold the recipe, though who it is that thought to pair it with peanut butter on white bread is not as clear. Nevertheless, the fluff is celebrated to this day with a Fluff Festival in Somerville” in September.

New Hampshire was noted for its “Beer-Battered Fish Sandwich” and Vermont for the aptly-named Vermonter, a “ sweet-and-savory sandwich that typically includes either turkey or ham (sometimes both), sharp Vermont cheddar cheese, thinly-sliced green apples and honey mustard, although there are many different variations (including a decent number that come with cranberry mayonnaise instead of honey mustard).”

In case you were wondering, in Alaska it is the Reindeer Sausage Sandwich, in Wyoming the Bison Reuben, in Alabama the Chicken Sandwich with White Sauce, and in Arkansas the Fried Bologna Sandwich, and Mississippi the Elvis sandwich (peanut butter, fried banana and bacon). The Zagat’s  reporting (and tasting) was conducted for the August 2013 observance of National Sandwich Month, with a tip of the plate to the notable Earl of Sandwich.

Hartford Region Improves Among Nation's Best Performing Cities in 2013

The Hartford region was the state’s only metropolitan area to improve its ranking relative to other metropolitan areas around the country in an analysis of job growth and regional economic factors in 2013 that ranked the nation’s top 200 Best Performing Cities. The top ranked Connecticut metropolitan area was Hartford-West Hartford-East Hartford, which ranked #85 among the nation’s top 200, an improvement in ranking from #93 the previous year.state map

Connecticut’s other major metro areas dropped in the rankings: Bridgeport-Stamford-Norwalk dropped to #106 from #94 in 2012, New Haven-Milford fell to #142 from #109 , and Norwich-New London ranked #187, falling from #152 the previous year.

Best Performing Cities Index Report (PDF)The 2013 Milken Institute Best-Performing Cities Index ranks U.S. metropolitan areas by how well they are creating and sustaining jobs and economic growth. The components include job, wage and salary, and technology growth.

Topping the list of Large Cities were Austin-Round Rock–San Marcos, Texas and Provo-Orem, Utah followed by San Francisco-San Mateo-Redwood City, CA, San Jose-Sunnyvale-Santa Clara, CA and Salt Lake City, UT. Rounding out the top 10 were the metropolitan areas of Seattle, Dallas, Houston, Boulder, and Greeley, CO.

Biggest gainers on the list include Hagerstown-Martinsburg, Md.-W.V. (70th, up 100 slots); Tulsa, Okla., (42nd, up from 118th), and Phoenix, (66th, up from 122nd). Within the top 25 metro areas, Texas claimed seven spots; Colorado and California each had four.

The website interactive features offer a means of comparing cities in the various economic factors.  In most years, according to the study authors, the factors evaluated in the index give a good indication of the underlying structural performance of regional economics.

A nonprofit, nonpartisan economic think tank, the Milken Institute works to improve lives around the world by advancing innovative economic and policy solutions that create jobs, widen access to capital, and enhance health.

New Haven - Milford Has Nation's Highest Concentration of Italian Heritage

The New Haven-Milford metropolitan area has the highest concentration of individuals of Italian heritage in the nation. In an analysis that ranked ancestries on the estimated percentage of U.S. population and then identified the three metropolitan areas with the highest concentration of each ancestry or origin, Bloomberg Businessweek determined that the concentration of individuals of Italian heritage made up just under 24 percent of the population in the New Haven – Milford area. The next highest concentration was in Kingston, New York, and Poughkeepsie – Newburg – Middletown, New York, each with just over 20 percent of their population of Italian heritage. Overall, the largest eHello-my-name-is_1267913358thnic populations across the country are German (15.6% of the population), Irish (11%), Mexican (10%), English (8%), Italian (5%), Polish (3%) French (2%) Scottish (1% and Puerto Rican (1%).

The Census Bureau defines ancestry as a person’s ethnic origin, heritage, descent or “roots,” which may reflect their place of birth, place of birth of parents or ancestors and ethnic identities that have evolved within the United States. Data for European, Middle Eastern, Arab and Sub-Saharan African ancestries were directly captured by ancestry questions in the Census Bureau’s American Community Survey.

The largest concentration of individuals of German descent was in Bismark, ND (60%) and the largest population of Irish was in Ocean City, New Jersey (30%) – followed by Barnstable, MA at 27 percent and Boston-Cambridge-Quincy at 24 percent.

Bangor, Maine had the highest concentration of individuals of Scottish ancestry, at 6 percent and the largest Puerto Rican population by percentage was in Vineland, Millville-Bridgetown, New Jersey at 14 percent and Orlando-Kissimmee-Sanford, Florida, at 12 percent.

In the data, South American ancestries were calculated using data from the "Hispanic or Latino origin by specific origins" tables, while Asian ancestries were calculated from "Asian race & ethnicity" tables. American Indians and Alaskan Native ancestries were counted only if individuals identified with specific tribes. Spaniards only included people who specifically identified their ancestry as Spaniard.