More US Cities Seek to Join Stamford in Commitment to Energy, Water Usage Reductions in Commercial Buildings

Efforts are underway this year for seven additional cities, from Albuquerque to Ann Arbor, to follow Stamford and seven others across the nation, in making a long-term commitment to reduce energy and water consumption in commercial buildings and reduce emissions from transportation, while increasing competitiveness in the business environment and owners' returns on investment. The “2030 District” initiative began with Seattle in 2011, grew by two cities in 2012, to four in 2013, and then to eight in 2014 when Stamford joined Seattle, Pittsburgh, Cleveland, Los Angeles, Denver, Dallas, and San Francisco as a 2030 District.  Now working towards the designation, in addition to Albuquerque and Ann Arbor, are Detroit, San Antonio, Ithaca, Toronto and Portland.Stamford---Website

Across the United States and Canada, 2030 Districts are forming with greater frequency to meet incremental energy, water and vehicle emissions reduction targets for existing buildings and new construction called for by Architecture 2030 in the 2030 Challenge for Planning.  Districts are generally private/public partnerships that commit to dramatic reductions in water consumption and energy and greenhouse gas (GHG) emissions, as well as adaptation and resiliency actions that address projected climatic impacts.

The Stamford 2030 District – launched this past  November - is an interdisciplinary public-private-nonprofit collaborative working to create a groundbreaking high performance building district in downtown Stamford.  Leading the way in the Stamford 2030 District are the Business Council of Fairfield County and Connecticut Fund for the Environment. As Stamford is a coastal city, its 2030 District will also implement a proactive vision to ensure resiliency against projected sea-level rise and storm surge.

The Stamford 2030 District – the first in New England - began with 23 founding members, including 11 property owners and 12 prominent professional and community stakeholders committed to meeting the 2030 Districts goals and targets. High performance buildings have proven track records of simultaneously increasing business and property profitability, reducing environmental impacts, and improving occupant health.Stamford

Now in the process of assessing the District’s current building performance levels, one-on-one assistance is provided to property owners and managers in benchmarking their buildings.  In addition, a first-time webinar will be held this week, on Wednesday, February 18, with several founding members highlighting best practices and procedures:

  • Jay Black of SL Green Realty/Reckson Properties will offer industry perspective through his experience with benchmarking buildings in both NY and CT.
  • WegoWise will present an overview of their web-based software that is able to benchmark a portfolio and provide deeper analytics into a buildings’ energy performance to find savings opportunities.
  • Steven Winter and Associates will demonstrate how to take benchmarking a step further with tools such as building energy audits to help identify opportunities within the building.
  • New Neighborhoods, Inc. will serve as a case study project in Stamford that has contracted with WegoWise for their benchmarking and will share their experience.

Officials indicate that District Members develop realistic, measurable, and innovative strategies to assist district property owners, managers, and tenants in meeting aggressive goals that keep properties and businesses competitive while operating buildings more efficiently, reducing costs, and reducing the environmental impacts of facility construction, operation, and maintenance.

Stamford2030boundary“These collective efforts will establish the Stamford 2030 District as an example of a financially viable, sustainability focused, multi-sector driven effort that maximizes profitability and prosperity for all involved. Through collaboration of diverse stakeholders, leveraging existing and developing new incentives and financing mechanisms, and creating and sharing joint resources, the Stamford 2030 District will prove the business case for healthy and high performing buildings.”

Property owners and managers are voluntarily committing their properties to Stamford 2030 District goals; they are not required to achieve the District goals through legislative mandates or as individuals.

“Stamford is already a business leader in Connecticut. The Stamford 2030 District will make the city a sustainability leader nationwide,” said Megan Saunders, Executive Director of the Stamford 2030 District. With over 170 million square feet of commercial building space (including 6 million thus far in Stamford), 2030 Districts are rapidly emerging as a new model for urban sustainability, officials indicate.

The Stamford 2030 District provides members a roadmap and the support they need to own, manage, and develop high performance buildings by leveraging Community and Professional Stakeholders, market resources, and by creating new tools, partnerships, and opportunities to overcome current market barriers. This type of collaborative action is not only a strategic undertaking to keep Stamford competitive in the year 2030, but also represents a major investment in Stamford's future and reflects the collaborative nature of our region.

State Report Calls for Tax Incentives, Better Insurance, Greater Flexibility to Improve Care for Rapidly Growing Older Population

A new report by the state legislature’s Commission on Aging, examining state funding and support for home and community-based care for older adults and individuals with Alzheimer’s Disease, has issued more than a dozen recommendations, including establishment of a Dependent Care Tax Credit, release of funds to support home modifications, and extension of paid sick leave to cover care of elderly relatives.  Incentives for employers to offer long-term care insurance coverage are also suggested. The Commission on Aging is a nonpartisan public policy and research office of the Connecticut General Assembly.  A law passed by the legislature last year charged the Commission with studying private sources of funding available to elderly persons and persons with Alzheimer's disease in need of home or community-based care, including the cost effectiveness of such programs funded by the state with recommendations on which state programs should be expanded.aging report

Connecticut is the 7th oldest state in the nation.  Over 70,000 people age 65 and older live with Alzheimer’s Disease or another dementia, and disabilities affect 10.4 percent of all Connecticut residents – nearly 400,000 people. Due to factors including aging demographics and consumer choice, demand for home-care based services is expected to “increase exponentially in coming decades,” according to the report. Between 2010 and 2040, Connecticut’s population of people age 65 and older is projected to grow by 57 percent, with less than 2 percent growth for people age 20 to 64 during the same period.seniors 2

The 23-page report noted that “informal caregivers are the backbone of the long-term service and support system. It is estimated that the economic value of the care provided by unpaid caregivers is $5.8 billion in Connecticut. Supporting caregivers is a cost effective means of reducing the reliance on costly formal care system.”  The report went on to caution that “without support, caregivers are likely to become emotionally and physically ‘burnt-out’ and find few options” short of turning to institutional care.

The report recommends amending the state tax code to include a Dependent Care Credit where the tax filer can receive a credit for care expenses incurred while a caregiver is working. Home care and adult day care costs are cited as examples of work‐related expenses that may be eligible.

To provide further support to informal caregivers, the report calls on the legislature to extend paid sick leave for those caring for an aging parent or other relative.  Connecticut’s law currently allows paid sick leave to be used for a worker’s own illness or injury, or to care for the worker’s child or spouse.  It does not extend to cover workers who care for a parent or other relative. aging population

Policies that “allow for flexibility” in work schedules are also urged, cited studies have shown such schedules not only are “an import way to support a caregiver but also… positively affect recruitment and retention efforts.”

The report urges the authorization of $6 million in bond money for home modifications and adaptive technology, which was allocated by last year’s legislature, and development of a list of “vetted home repair and home modification contractors and programs” to improve the likelihood that individuals would be able to “age in place.”

The goal, the report indicated, would be to “enable them to function with greater independence in the home, remain in the community and reduce the need for human assistance. Simple modifications include adding nonslip strips to bathroom floors or other smooth surfaces, improving lighting, providing telephones with large numbers and letters, and installing grab bars. More complex (and expensive) modifications include installing ramps, chair lifts, stair glides, widened doorways, roll-in showers, and lowered countertops.”

Among the other recommendations, the report urges professional development for those whose job it is to care for individuals with Alzheimer’s and dementia, to align with changing demographics in the state’s population.

seniorsThe report also suggests that policy makers “explore the possibility of incenting employer-based long-term care insurance coverage.”  In 2009 almost 25,000 employers in the U.S. offered long-term care insurance to their employees – just 35 percent of the 7.5 million insurance policies in effect.  In addition, the report encourages the Connecticut Congressional delegation to support a federal tax deduction for long-term care insurance, and urges policy makers to consider making reverse mortgages “a more viable option.”

Additionally, the report also considers advances in technology in the care of older residents.  It describes “telehealth” as a mode of delivering health care, public health and certain non-clinical services using electronic communications technology, stating that it “represents an opportunity for Connecticut to improve access to care, coordination, quality and outcomes for individuals, all while reducing cost, promoting local economic health, and offering a patient-centered approach.”  The Commission on Aging calls on Connecticut to join at least 21 other states that have telehealth parity laws for private insurance, meaning that providers can collect reimbursement for telehealth services.RdN-XMIb_400x400

The report, “Study of Funding and Support for Home and Community-Based Care for Older Adults and Persons with Alzheimer's Disease,” also recommends that the state “address service challenges specific to housing, transportation and behavioral health,” including conducting “walkability audits” to assess sidewalks, crosswalks, and pedestrian access to essential services.  It also suggests that the state “explore the use of taxi vouchers, public and private paratransit services, paid and volunteer driver services, on-demand car rental services and other forms of transportation in the growing “shared mobility” economy.


Mall Walking Is Alternative to Navigating Snow Banks, Frigid Temperatures

With wind chills hovering well below zero and snow and ice piled high just about everywhere, it is a tough season for joggers and walkers. The dangers of trudging along snow snarled streets is plainly evident, and every so often tragedy reminds us of the degree of danger. mallwalkers

Just over two decades ago, at age 33, a local television reporter at the pinnacle of her career, a popular, talented reporter for New Haven’s WTNH, was killed after being struck by a car while jogging in mid-March.  Ellen Abrams was “facing traffic while jogging west on the side of snow-banked Frog Hollow Road in Ellington,” according to published reports at the time.

Tragically, it would not be the last fatality involving someone looking to get some exercise on local roads before the snow banks had receded.  Last month, police in Torrington reported that a jogger was fatally struck by a snowplow.

Through the years, individuals looking for a safe alternative to outside conditions have turned to area shopping malls in their prior-to-opening hours.  While jogging may not be favored, walking is certainly an option.  And winter’s unrelenting cold makes the alternative even more attractive.

runningwithyaktrax2Officials at Waterford’s Crystal Mall indicate that their mall walking program is year-round, and has been running for over 10 years.  They have approximately 20 regular participants, and doors open for the program at 8 a.m. Monday through Saturday and 10 a.m. on Sundays.  Advance sign-up is required, and people who are interested can easily sign up at Guest Services or the mall office during regular shopping hours.

At the Enfield Square Mall, early walking hours are Monday – Saturday at 8 a.m. and Sunday at 10 a.m.  While The Shoppes at Buckland Hills does not have a formal mall walker program; the mall is open two hours before stores open to shoppers (8 a.m. Monday-Saturday, 9 a.m. Sunday) year-round for walkers seeking a climate-controlled environment, officials say.

Westfarms Mall on the West Hartford-Farmington line opens for walkers at 7 a.m. Monday through Sunday.  Individuals should enter through the main entrance. Coat racks are conveniently located on the upper level near the Security Dispatch Desk.  At Westfarms, by walking completely around the upper level (including all corridors) you will have walked .76/mile, and by walking completely around the lower level (including all corridors) you will have walked .72/mile, according to the mall’s website.  The mall walkers club is sponsored by Hartford HealthCare, which presents informational seminars with HHC doctors and nurses.Snow Banks - car

More than twenty years after her death, Ellen Abrams is remembered at the University of Hartford each year with  the Ellen Abrams Memorial Scholarship, a $1,500 scholarship awarded annually to a deserving junior or senior Communication major with demonstrated financial need.  Her family continues to attend the awards ceremony, sharing her commitment to journalism with students receiving the scholarship in her name.

School Suspensions Down, But Students of Color, Low Income Receive Disproportionate Share

There’s good news and bad news in a new analysis of suspensions, expulsions, and arrests of students in Connecticut schools.  The report, by Connecticut Voices for Children, found that overall significantly fewer students have been excluded from the classroom in recent years, but that suspension, expulsion and arrest rates were much higher for minority students, special education students, and students from poorer districts.arrested The report also found that “many of these discipline measures were used for behaviors that were probably not criminal and could likely have been handled within the school.”  Stressing that “children learn best when they are in school,” the report indicated that “arrests, expulsions, and suspensions are often costly, ineffective, and unnecessary.”

Connecticut Voices for Children is a research and advocacy organization that works to improve opportunities for the state’s children, youth and families. The report, “Keeping Kids in Class: School Discipline in Connecticut, 2008-2013,” uses data provided by local school districts, found that in 2013, 7.4 percent of all students received at least one expulsion or suspension, down from 8.5 percent as recently as 2011.

First, the good news:

  • The number of students arrested, expelled, and suspended in Connecticut has decreased significantly in recent years. In the 2013 school year, Connecticut schools arrested 35 percent fewer students, expelled 31 percent fewer students, and gave out of school suspensions to 47 percent fewer students than in 2008.

The not-so-good news:

  • Despite the overall reduction in these “exclusionary” school discipline practices, many students are still removed from the classroom for non-criminal behaviors that could, in the view of Connecticut Voices, be managed in the classroom. “School policy violations” – such as skipping class, insubordination, or using profanity – were involved in 9 percent of student arrests, 6 percent of expulsions, 50 percent of out-of-school suspensions, and 79 percent of in-school suspensions in 2013.report

From 2008-2013 the percentage of students suspended out-of-school fell from 4.9% to 2.7%. During the same time period, the percentage of students suspended in-school increased from 4.9% to 5.2%.

Of particular concern was the data related to students of color and those with limited financial resources or disability:

  • In 2013, black students were 4.7 times more likely to be arrested, 4.9 times more likely to be expelled, and 6.5 times more likely to be suspended out-of-school than white students.
  • Hispanic students were 3.1 times more likely to be arrested, 2.6 times more likely to be expelled, and 4.4 times more likely to be suspended out-of-school than white students.
  • Special education students were arrested at 3 times the rate of general education students, and they were 1.8 times more likely to be expelled, and 2.6 times more likely to receive out-of-school suspensions.
  • Students in the poorest urban areas were arrested nearly 23 times more often, expelled over 17 times more often, and suspended out-of-school 24 times more often than students in the wealthiest suburban areas.suspensions

Based on the data, the report makes a series of recommendations for the state Department of Education and policymakers to consider, including:

  • Require districts with police stationed in schools to create a memorandum of agreement between the schools and police that sets ground rules concerning arrests. Promote police and educator training, such as that provided by the state’s Juvenile Justice Advisory Committee, which offers instruction to officers and educators in understanding and responding productively to adolescent behavior.
  • Implement preventive strategies and alternative discipline measures to reduce racial and other disparities and ensure those excluded from school are provided equal opportunities.
  • Establish and support community collaborations across the state. National studies show that engaging all stakeholders in the discipline process positively impacts student behavior and achievement.

The top 10 reasons for expulsion in 2013:  1) drug/alcohol/tobacco, 2) weapons, 3) fighting/battery, 4) personally threatening behavior, 5) school policy violations, 6) theft/theft related behaviors, 7) verbal confrontation/conduct unbecoming 8) violent crimes against persons, 9) sexually related behavior, and 10) property damage.

The report concludes that “the disproportionate rate by which students of color and students from poorer districts are excluded from school may in fact contribute to widening the achievement gap; students from less privileged backgrounds will continue to perform worse than their more advantaged peers if they are excluded from the classroom in the first place.”

The report also recommends expanding access to behavioral and mental health services and utilize Juvenile Review Boards (JRBs), locally-run groups that offer a diversionary alternative to the court system for youth who have committed minor delinquent acts or misdemeanors.  In addition, it calls for improving data collection by clearly defining “student arrests” (not currently defined by the state) and collecting and publishing data on all student arrests (currently not required for all incidents resulting in arrests).

“This report tells us that many schools in Connecticut have reformed their disciplinary practices and reduced student arrests, expulsions and out-of-school suspensions,” said Ellen Shemitz, Executive Director of Connecticut Voices for Children. “Yet these reforms have not benefited all children equally. How can we hope to reduce the yawning achievement gap when school disciplinary practices push minority children out of school at disproportionate rates?”

CT Ranks Last in Job Creation, Poll of Workers in 50 States Reports

To say that the latest Gallup Poll on state-by-state job creation reflects little good news for Connecticut would be an understatement.  Connecticut ranked last in the survey for 2014, which is determined based on full- and part-time workers' reports of whether their employer is hiring and expanding the size of its workforce, not making changes, or letting people go and reducing its workforce. “Connecticut has consistently ranked in the bottom tier for job creation, and its position at the very bottom in 2014, along with continued low ratings of other New England states and neighboring New York, suggests that is unlikely to change in 2015,” the survey summary predicted.

It marked the second time this month that Gallup reported diminished economic rankings for Connecticut.  The national poll’s economic confidence report, based on Gallup Daily tracking interviews with 176,702 national adults conducted from January through December 2014, indicated that Connecticut dropped out of the top 10 and into the middle-of-the-pack among the nation’s 50 states.  Leading the nation in “economic confidence” were Minnesota, Maryland and California.    Gallup by state

The newly released 50-state survey on job creation placed Connecticut at the bottom of the pile, as workers reported the worst hiring climate, although still net positive.  All 50 states had positive net hiring scores, and all but three -- West Virginia, Alaska and New Mexico -- have markedly improved on this measure since these ratings hit their low point in 2009, according to Gallup’s survey.

Joining Connecticut in the bottom dozen were the New England states of Rhode Island, Vermont, and Maine, along with Neighboring New York and New Jersey, as well as Alabama, Kentucky, Mississippi, West Virginia, New Mexico and Alaska.

North Dakota maintained its position at the top of Gallup's annual ranking, with employed North Dakota residents providing a strongly upbeat report on hiring conditions where they work -- the most positive of any state.   In North Dakota, 48 percent of workers in 2014 said their employer is hiring and 12 percent said their employer is letting workers go, resulting in a +36 Job Creation Index score.worst list

By contrast, Connecticut's +16 index score reflects 33 percent of workers saying their employer is hiring and 17 percent letting go, the Gallup survey found.  Only two states – Vermont (31%) and Montana (33%) – had equal or lower percentages responding that their employer is hiring, expanding the workforce. Connecticut and Rhode Island tie for compiling the worst collective job creation scores since 2008 and are the only states to have ranked in the bottom 10 each year.gallup-poll-logo

The 2014 state-level findings are drawn from 201,254 interviews with employed adults nationwide, conducted throughout the year as part of Gallup Daily tracking. In Connecticut, 2,503 individuals were interviewed, with one-third saying their employer was hiring, nearly half (43%) reported hiring was not changing, and 17 percent saying that their employer was reducing the workforce.

Beyond North Dakota, other top states were Texas, Nebraska, Wisconsin, Iowa and South Dakota.  Michigan's presence among the states with the highest Job Creation Index scores is notable because it represents one of the sharpest turnarounds of any state in the seven years Gallup has measured job creation, according to Gallup. Michigan was among the worst-performing states in 2008 and 2009, but with significant improvements in that state's economy, it rose to about average net hiring in 2010, and has ranked among the top-performing states in each of the past two years, Gallup pointed out.

The index was up year-over-year in most states, the Gallup survey revealed, but particularly in Oklahoma, Oregon and New Hampshire, where it rose nine points each. At the same time, net hiring failed to improve in a handful of states -- North Dakota, Alaska, Hawaii, Delaware, South Dakota, Minnesota, Tennessee and Connecticut -- where the index was basically flat in 2014, the report indicated.

http://youtu.be/fLPPLHDo2FU

Tweed Gauges Demand for Flights to Washington, D.C., Other Destinations

Tweed New Haven Regional Airport, the City of New Haven and the Greater New Haven Chamber of Commerce are currently soliciting feedback from businesses regarding existing air travel patterns and expenditures, as well as anticipated air service needs this year.  The survey is intended to quantify the demand for air service and to pinpoint the most critical destinations sought by local businesses. Of particular interest:  Dulles Airport in Washington, D.C.  A recent email from the New Haven Manufacturers Association to members of the association, for example, seeks opinions regarding travel to the nation’s Capital.  The email asks two questions:

  • Does your company have a need to be in the DC area on a regular basis?
  • If so how many flights a month would you estimate you company would use?

Under consideration is service that would include three flights down and three flights back each day, Monday - Friday, “which means you could be there and back within the day.” Though Dulles is outside of DC, the email continues, “the Silver Line train will soon be connecting the airport to the DC subway system.”img_logo

In urging participation in the survey, officials note that “with accurate information regarding the potential market for increased destinations, the airport can make a compelling case for additional flights and carriers.”  The survey is also posted on the Tweed New Haven website.

Currently, Tweed’s flights to Philadelphia are the airport’s primary gateway hub.  The airport’s website highlights “Fly first to Philadelphia and connect to hundreds of destinations for less that it would cost to drive and park at our other nearest airports. These costs in time, stress, and dollars are seldom counted in the cost of travel.” Tweed offers US Airways Express service to and from Philadelphia International Airport, currently three flights a day.  US Airways is currently in the midst of merging with American Airlines. img_airport_hvn3_lg

Tweed New Haven Airport Authority manages and operates Tweed New Haven Regional Airport under a long term lease from the City of New Haven, according to the Chamber of Commerce website.  Chartered by the State legislature, the Authority is a 15-member board of directors appointed by the mayors of New Haven and East Haven and by the South Central CT Regional Council of Governments.  The Airport is operated by the firm of AvPORTS and administered in part by Chamber staff.

“Improving scheduled air service and the physical infrastructure at Tweed is considered the #1 economic development priority of the region,” the Chamber website points out.

Racial, Ethnic Disparities Common in CT Hospital Readmissions, Study Finds

An Hispanic patient hospitalized in Connecticut for heart failure is 30 percent more likely than a White patient to end up back in the hospital within a month, according to a study published in Connecticut Medicine, the journal of the Connecticut State Medical Society.  The study also found that a Black patient hospitalized for chest pain is 20 percent more likely to be readmitted within 30 days after discharge. The study was based on an analysis of the Connecticut Hospital Inpatient Discharge Database -admissions to Connecticut hospitals from 2008-2012. The findings, the study noted, “should serve as a catalyst for further investigation of the interplay between patient characteristics, hospital practices, community-based resources, and insurance coverage” in fostering “racial and ethnic disparities in health and healthcare.”medical journal

The multi-year study discovered significant and pronounced disparities in readmission rates for Black and Latino patients compared to White patients in 9 of 10 major diagnostic categories.

The Connecticut State Medical Society hosted a well-attended symposium last week highlighting its multi-year research into racial and ethnic disparities in readmissions.  The symposium, funded by the Connecticut Health Foundation, brought together physicians, nurses, patients, and other stakeholders from across the state. The stakeholders had an opportunity to review and discuss the CSMS research data, and also provided insight and interpretations of the disparities. The feedback will be integrated into clinical recommendations for care delivery models that may help to reduce the level of disparity in hospital readmission rates.

The symposium was designed to provide an opportunity to take a fresh look at these readmission disparities and determine more effective ways to address them. Stakeholders included physicians and other licensed health care providers; social service providers; healthcare/social service administrators, leaders, and managers; lawmakers and policy analysts; patients and their family members; healthcare consumers and patient advocates.  It focused on documenting potential best practices of the four conditions with the greatest racial and ethnic disparities in readmission rates, as determined in the study:  Uncomplicated Delivery, Joint Replacement Surgery, Heart Failure & Chest Pain, and Digestive Disorders.

logoThe study also noted that “barriers to accessing community based care among Connecticut Medicaid beneficiaries are well-documented, often leaving such patients with few options other than hospital care for both urgent and non-urgent conditions.”

The study’s authors noted that “this study adds to a growing body of evidence on disparities in hospital readmissions in several important respects.”  First and foremost, they point out, “racial and ethnic disparities observed in this study were considerably more pronounced than disparities generally reported in previous studies.”

“We’re seeing large disparities in readmissions for a number of conditions,” Robert Aseltine, the study’s lead author and professor of behavioral science and community health at the University of Connecticut Health Center, told the Connecticut Health Investigative Team (C-HIT). “There’s no one factor that jumps out. There’s no simple answer. ” Co-existing health conditions and socioeconomic status, for example, “don’t explain everything away.”hands

In March 2014, a report by Mathematica Policy Research for the Robert Wood Johnson Foundation indicated that the U.S. Department of Health and Human Services observed a year earlier that “while overall quality is improving, access is worse and there has been no improvement in lessening disparities.” The report goes on to point out that there “appears to be a shift from the concept of disparities to one of equity. The shift provides more focus on action and social justice relevant to a wide variety of subpopulations.”

In 2010, when “nearly half of U. S. physicians identify language or cultural communication barriers as obstacles to providing high-quality care,” physician adoption of practices to overcome such barriers was described as “modest and uneven, according to a national study by the Center for Studying Health System Change (HSC).

The new Connecticut study was conducted by Robert H. Aseltine, Jr, PhD, Jun Yan, PhD, Claudia B. Gruss, MD, Catherine Wagner, EdD, and Matthew Katz, MS.

CT Ranks #4 in Planned Parenthood Locations Per Capita; 17 Sites in State

Connecticut ranks #4 in the nation in the number of Planned Parenthood locations per capita, according to a state-by-state analysis. Connecticut, with a total of 17 locations in the state, ranks behind only Vermont, Alaska and Montana in the number of clinics per 100,000 women ages 15-50.  According to the analysis by Bloomberg.com, Connecticut’s estimated population of 856,016 women ages 15-50, or a ratio of 1.99 locations per 100,000 women.  Rounding out the top 10 are Iowa, Washington, Colorado, Wisconsin, New Hampshire, and Indiana.

The 17 lplannedocations in Connecticut are in Bridgeport, Danbury, Danielson, Enfield, Hartford, Manchester, Meriden, New Britain, New Haven, New London, Norwich, Old Saybrook, Stamford, Torrington, Waterbury, West Hartford and Willimantic.

The mission of Planned Parenthood is to “protect the fundamental right of all individuals to manage their own fertility and sexual health, and to ensure access to the services, education and information to realize that right,” the organization’s website points out.

Among the states with the fewest number of Planned Parenthood locations, and the lowest number per capita, are North Dakota (0 locations), Mississippi (1 location), and Alabama, South Carolina, Louisiana, and Kentucky, each with 2 locations in the state.chart

California has the most locations, with 115, followed by New York with 59, Texas with 39, Pennsylvania with 38, Washington with 33 and New Jersey and Ohio with 28.  Connecticut ranks fifteenth in the number of Planned Parenthood locations in the state.

Planned Parenthood’s website describes the organization as “your trusted source for STD/STI testing, birth control, pregnancy tests and counseling, emergency contraception and more - all in a convenient, confidential and safe environment.”  The site notes that the organization offers “a sliding fee scale based on your income” and participates with many insurance plans.

Last month, as part of Cervical Health Awareness Month, Planned Parenthood of Southern New England (PPSNE) urged women to “start the year off right by taking charge of their health with important preventive screenings, such as a Pap test, which can detect irregularities that lead to cervical cancer.”

The Centerswomen 
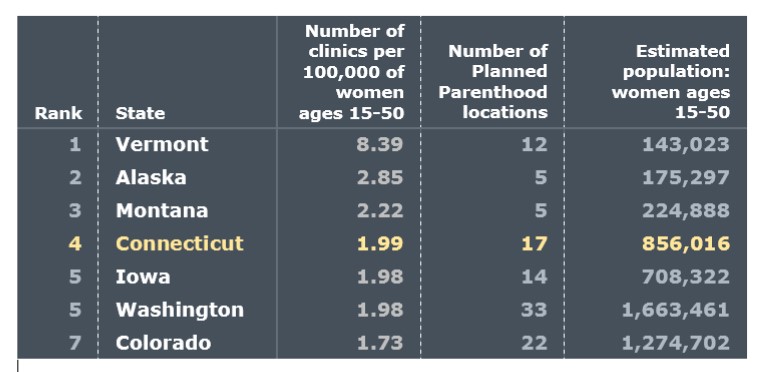
for Disease Control and Prevention (CDC) recently released new data showing that while cervical cancer screenings have been proven to save lives, about eight million women ages 21 to 65 have not been screened for cervical cancer in the past five years. More than 12,000 women in the U.S. are diagnosed with cervical cancer each year, and more than half of these cases are in women who have never been screened or in those who haven’t been screened in the past five years, according to Planned Parenthood.

The analysis ranking the states for Planned Parenthood locations uses data from the U.S. Census and Planned Parenthood, as of December 31, 2014.

Helping Families Experience Joy of Adoption Is Goal of Start-Up Nonprofit

After six long, challenging and frustrating years, and spending thousands of dollars, a Norwalk couple adopted a child.  And in that moment, a new mother vowed that she would do everything possible to make sure that others would not be prevented from experiencing the joy of becoming a parent due to a lack of financial resources. Today, her daughter is an energetic and engaging 3-year-old and she is following through on the commitment she made to herself, launching a non-profit organization named The Adoption Hope Foundation.  The organization’s mission is to help break the financial barrier of adoption by providing grants to people who hope to build their families through adoption.  The fledgling organization is about one-third of the way towards meeting their initial fundraising goal, with a GoFundMe crowdfunding campaign underway that seeks to raise $10,000 by April 15.2910715_1420349980.101_funddescription

“The thought that some people would not be able to have a family simply because of the financial barrier was heartbreaking to me.  And thinking about babies and children who would not be adopted simply because families couldn’t afford it was unacceptable.  With the average adoption costing approximately $35,000, many qualified, loving families are unable to pursue it due to the high cost.”

It was a long and winding road for Laura Loffredo.  “My husband and I struggled with infertility for six years.  We spent thousands of dollars.  We had eight failed fertility treatments and a miscarriage.  I prayed every night for a baby and the longing inside my heart was unbearable.  I was angry, bitter and heartbroken.  I couldn’t breathe.  I have often referred to this time as the darkest time of my life.”

“When we finally made the decision to adopt, it was like a light in the darkness. The first time I held my daughter in my arms when she was only a few minutes old, I was overcome with emotion,” she recalls.  “Adoption is a beautiful gift.  It is a life altering experience that has allowed me to feel the deepest kind of love imaginable. We believe that every waiting family deserves a child, and every waiting child deserves a family.”

She has spent the past two years researching how to start and run a nonprofit organization, including taking seminars offered by the Connecticut Nonprofit Association.  She has “talked to anyone who would listen – anyone who knew anything about the nonprofit world.”

Some suggested that starting a nonprofit was a tough road, but Loffredo is determined.  “I am compelled to do this - it was a calling.”  She has gained much support and encouragement from long-established nonprofit leaders and professionals in the field in Connecticut. “They have helped me tremendously by constantly answering my start-up questions and supporting me with their expertise in this area.”adoption

More information about the new nonprofit, and their efforts to raise the necessary funds to begin grant-making, are available at www.gofundme.com/adoptionhope or by contacting Laura Loffredo at loffredo.laura@gmail.com

Thinking back on the adoption process, Loffredo recalls “I felt overwhelmed by the extremely high cost of the process.  I felt blessed that we were able to afford it but immediately felt upset thinking about people who could not afford this whose dreams were to have a family. I envisioned an organization that would support adoption by providing grants to people who wanted to build their families through adoption.”

The new business is filing the legal documents required to gain non-profit status, and they expect to have 501c3  in place by June. A website is being developed, and applications for grants will soon be available.  There will be no application fee, so as not to create an additional economic burden on prospective families.  The Adoption Hope Foundation anticipates awarding $5,000 grants by the end of this year.

a quoteA home study by a social worker, along with background checks, must be completed before applications will be accepted, and grant awards will be determined by members of a board, based on criteria including need and personal circumstances, such as “why they want to build their family through adoption.” Board members already in place include individuals with backgrounds in finance, law, fundraising, and social work, whose lives have been touched by adoption. Additional board members are now being determined.

In addition to launching the nonprofit organization, Loffredo is writing a memoir about her struggle with infertility and a children’s book about adoption.  She hopes to have both volumes published within a year, with the sale of the books to be used to help support The Adoption Hope Foundation.

A report by the U.S. Department of Health and Human Services Administration for Children and Families, using the most recent data available in 2011, indicated that “approximately 136,000 children were adopted annually in the United States (in 2006 and 2007). This represents a 6-percent increase in adoptions since 2000 and a 15-percent increase since 1990.”

In a 2007 survey, the Department noted that “of the 1.8 million adopted children in the U.S., 37 percent were adopted from foster care, 38 percent joined their families through private domestic adoptions, and 25 percent were adopted internationally.”  They also reported that “overall, parents of 86 percent of adopted children report that their relationship with their child met or exceeded their expectations.”


As Hartford Nears Stadium Groundbreaking, Norwich Ranked #6 Minor League Baseball City in USA

With winter snow piling up and the planned groundbreaking for a new minor league baseball stadium in Hartford only weeks away, it seemed the perfect time to turn attention to baseball – and which cities are earning notice in the minor league landscape.  Among local franchises, tops on the list is Norwich, home of the Connecticut Tigers, the Class-A affiliate of the Detroit Tigers, and a member of the NY-Penn League. An analysis of baseball’s 159 minor league cities following the 2014 season by the website smartasset.com, ranked Norwich #6 among the Top 25 Best Minor League Towns.

The top ten were: Portland, ME; Alexandria, VA; Pearl, MS; Frisco, TX; Appleton, WI; Norwich, CT; Bowie, MD; Round Rock, TX; Hillsboro, OR; and Midland, MI.  Other New England franchises earning a slot in the top 25 include Lowell, MA and Manchester, NH. minor_league_baseball_1-1

The analysis considered five “quality of life” factors in determining the top 25 baseball cities.  The factors were:

  • Violent Crime per 100,000 Residents
  • Property Crime per 100,000 Residents
  • Disposable Income – The difference between average income and the average monthly rent for a two bedroom apartment.
  • Unemployment Rate
  • Dining & Entertainment Establishments per 100,000 Residents

As a secondary consideration, the analysis sought to determine which cities enjoyed the best baseball experience, dubbed the “team” score. Three factors were considered:

  • Team Win Percentage – During the 2014 regular season.
  • Stadium Experience – A ranking of every minor league ballpark, courtesy of StadiumJourney.com, which attended a game at every single minor league stadium.
  • Minor League Class – A measure from 0-50 based on the level of competition: Triple-A teams receive a 0, Double-A teams a 10, Class A Advanced a 20, and so on.

To determine America’s Best Minor League Baseball Towns, the Quality of Life Score and the Team Score were added, giving 80% weight to the former and 20% to the latter, according to the website.

Ranked at #6, the Connecticut Tigers had their best season on the field in 2014, setting a franchise record for wins and clinching a sTigerspot in the postseason for the first time in their five year franchise history.  The franchise plays home games at Dodd Stadium in Norwich.  The facility celebrated its 20th year in 2014.

Of Norwich, the website noted that “The Rose of New England sits at the confluence of three rivers in Connecticut’s serene southeast corner,” and “had the third highest concentration of (restaurant and entertainment) attractions of any Minor League town.”

Ranked #25, the New Hampshire Fisher Cats are owned by Art Solomon, father of New Britain Rock Cats owner Josh Solomon.  The Rock Cats will be moving to Hartford from New Britain for the 2016 season, with groundbreaking on their new stadium in Hartford slated for later this month. The Colorado Rockies signed a two-year player development contract with the Rock Cats last fall, after the Minnesota Twins ended a two-decade affiliation agreemDoddent.

No state had more than three top 25 towns, and 19 different states had at least one. Texas and Virginia were the leading Minor League Baseball states, with three towns each in the top 25.  SmartAsset is a financial technology company that provides data and advice related to personal finance decisions.


newhartford_sept3Artists conception of planned baseball stadium in Hartford.