Housing Stock in CT Cities Among Nation's Oldest

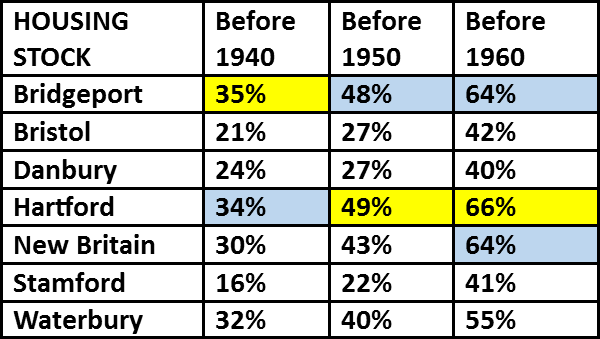
Approximately two-thirds of the housing stock in Hartford, New Britain and Bridgeport dates back more than half a century. Data compiled by Governing magazine shows that 66 percent of the housing stock in Hartford and 64 percent in Bridgeport and New Britain was constructed prior to 1960.  In Hartford, 34 percent of the housing dates back beyond 1940; in Bridgeport the percentage is slightly higher, at 35 percent.

Among the state’s largest communities, Danbury (40%) and Stamford (41%) have the smallest percentage of housing stock built prior to 1960.  The city with the smallest percentage of pre-1940 housing stock is Stamford, at 16 percent.
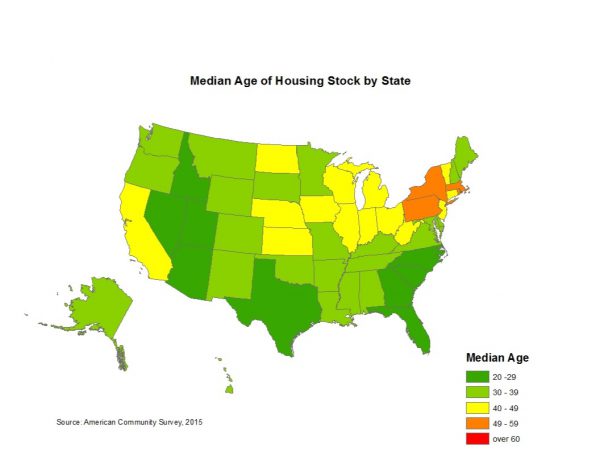
The median age of an owner-occupied home rose to 37 years in 2015, up from 31 years a decade ago, according to the latest data from the 2015 American Community Survey, as reported by Realtor Mag.   As of 2015, more than half of the housing stock in the U.S. was built prior to 1980. Thirty-eight percent of the homes were built prior to 1970. Meanwhile, homes constructed after 2000 comprise 19 percent of the housing stock.

The District of Columbia has the oldest homes with a median age of 75 years. New York and Massachusetts also have some of the oldest housing stock at 57 and 53 years, respectively.  Connecticut, overall, is not among the oldest, but places in the second tier among the states for the highest percentage of older homes, along with about a third of the states.  Among the state’s communities, however, the age of the housing stock differs.

Across the country, the West offers some of the newest homes. The median age of homes in Nevada is 20 years and in Arizona half of all occupied homes were built in the last 24 years.
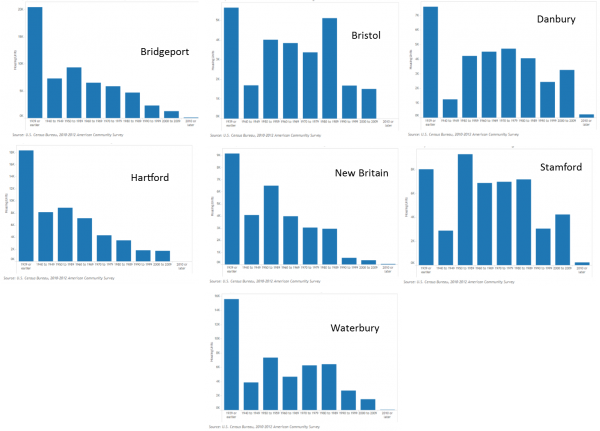
The age of the housing stock nationwide varies greatly by region, the Governing analysis also points out, with some areas having a particularly large number of older homes.  More the two-thirds of housing units are at least 75 years old in Somerville, Mass., Buffalo, N.Y., and a few other cities with the oldest homes. In other regions, such as newer communities in the South, nearly all homes were constructed in the past few decades.

According to Census estimates, 13.5 percent of the nation's total housing units were built prior to 1940, while about 19 percent were built before 1950, Governing noted.  The analysis included age estimates for all cities with more than 25,000 housing units.
 

Gender Disparity Is Alive and Not-So-Well; Particularly in Connecticut, Analysis Finds

Connecticut places dead last among the 50 states in the degree of gender gap in executive positions in the workplace and overall workplace environment for women, according to a new analysis prepared by the financial website WalletHub.  The state also ranked in the bottom ten in the “education and health” category, ranking higher – in the top ten – only in “political empowerment,” despite having fewer women in the state legislature than about a decade ago. Overall, the state ranked 28th among the “Best and Worst States for Women’s Equality.”

The challenges present in Connecticut are true – to varying degrees – nationwide.  In 2016, the U.S. failed to place in the top 10 — or even the top 40 — of the World Economic Forum’s ranking of 144 countries based on gender equality, WalletHub reports.

Among the states, the top 10, with the slimmest inequality gap, were Hawaii, Nevada, Illinois, Minnesota, Washington, Maine, North Dakota, Oregon, Wisconsin, and Vermont.  Among the other New England states, Massachusetts ranked #13, New Hampshire was #16, and Rhode Island was #34.  The widest gaps were in Texas, Virginia and Utah.

"Connecticut ranked below average overall mostly because of its rankings for two of the categories we analyzed, Workplace Environment (50th) and Education & Health (43rd),” WalletHub analyst Jill Gonzalez told CT by the Numbers.  “Connecticut's disparities between women and men are quite pronounced when it comes to the workplace environment. Women earn 23 percent less than men, 9th highest in the country, and Connecticut has the highest gap of women in executive positions. Large differences also appear when looking at higher-income earners, with a 13 percent gap between women and men, and the entrepreneurship gap in Connecticut is at 48 percent, again favoring men."

To determine where women receive the most equal treatment, WalletHub’s analysts compared the 50 states across 15 key indicators of gender equality in three central categories: workplace environment, education and health, and political empowerment  Among the indicators used in the analysis, Connecticut ranked 46th with among the largest educational attainment gap among Bachelor’s Degree holders, 48th in the entrepreneurship gap, 49th in the disparity among higher income wage earners (in excess of $100,000 annually) and 50th with the largest executive positions gap.

According to the National Conference of State Legislatures, just over one-quarter of Connecticut’s legislators are women, at 27.3 percent, compared with the national average among state legislatures of 24.8 percent.  There are 1,830 women serving in legislatures across the country.  In Connecticut, 42 of 151 House members are women, and 9 of the Senate’s 36 seats are held by women.   Among the states with the highest percentage of women in their legislature are Vermont, Colorado and Nevada with 39 percent, Arizona with 38 percent, and Illinois and Washington at 36 percent.  Connecticut’s numbers have declined since 2009, when a total of 59 women held legislative seats, 8 in the Senate and 51 in the House.

The workplace environment category included data on income disparity, the number of executive positions held, minimum wage workers, unemployment rate disparity, entrepreneurship rate disparity and the disparity in the average number of work hours.

The analysis found that in every state, women earn less than men. Hawaii has the lowest gap, with women earning 12 percent less, and Wyoming has the highest, 31 percent. Connecticut ranked 41st.  Rhode Island has the highest unemployment-rate gap favoring women, with 2.4 percent more unemployed men. Georgia has the highest gap favoring men, with 1 percent more unemployed women. The unemployment rate is equal for men and women in Illinois and Idaho.  In Connecticut’s it’s nearly identical, with the 0.3 percent more unemployed men than women, based on the data reviewed.

Women continue to be disproportionately underrepresented in leadership positions nationwide. According to the Center for American Progress, women make up the majority of the population and 49 percent of the college-educated labor force. Yet they constitute “only 25 percent of executive- and senior-level officials and managers, hold only 20 percent of board seats, and are only 6 percent of CEOs.”  In addition, salary inequity continues, and women are underrepresented in government.

The analysis was released to coincide with Women’s Equality Day, which is observed annually on August 26. The U.S. Congress designated the commemoration beginning in 1971 to remember the 1920 certification of the 19th Amendment to the Constitution, granting women the right to vote. The observance of Women’s Equality Day also calls attention to women’s continuing efforts toward full equality, according to the National Women’s History Project.

Best Run Cities in USA? Not in Connecticut, Study Finds

A new analysis of the best run among the 150 largest cities in America shows that Connecticut’s three largest fail to make the top half of the list, with Bridgeport coming closest. Bridgeport is ranked #77, New Haven is #122, and Hartford ranked #145. 

In order to determine the best- and worst-run cities in America, WalletHub’s analysts compared 150 of the most populated cities across six key categories: 1) Financial Stability, 2) Education, 3) Health, 4) Safety, 5) Economy and 6) Infrastructure & Pollution.

The top ten best run cities are: Nampa, ID; Provo, UT; Boise, ID; Missoula, MT; Lexington, KY; Las Cruces, NM; Billings, MT; Bismarck, ND; Fort Wayne, IN and Louisville, KY.

For each city, the analysts constructed a “Quality of City Services” score – comprising 33 key performance indicators grouped into six service categories – that was then measured against the city’s total per-capita budget.  The website evaluated those dimensions using 33 relevant metrics, with each graded on a 100-point scale, with a score of 100 representing the highest quality of service.

In the “financial stability” ranking, only four cities ranked lower than Hartford, which was #146.  New Haven was #143 and Bridgeport #128 in that category.  In the education ranking, New Haven was #115, just ahead of Bridgeport at #116 and Hartford at #121.

Bridgeport reached the top ten nationally in the “health” category, at #8.  Hartford was #42 and New Haven #56.  The cities were again bunched toward the bottom of the list of 150 cities in the “economy” category, with Bridgeport at #142, New Haven #143 and Hartford #146.

Connecticut largest cities fared better in the “infrastructure and pollution” category, with Hartford ranked #36, New Haven #60, and Bridgeport lagging at #115.

UConn Expands Presence in Hartford, Stamford

UConn is on the move this week, literally as well as figuratively.  Wednesday will see the ribbon cutting for the new Hartford campus, which is relocating from its suburban campus in West Hartford after nearly five decades away from the Capital City.  And in Stamford, students will be moving into student housing beginning this weekend, the first time that has been possible. In Hartford, the university intends to “interweave top-tier academic programs with the vitality and unique educational and service opportunities offered by Connecticut’s capital city.”  The campus – at a cost of $140 million - is anchored by the historic former Hartford Times building as part of a neighborhood campus that includes nearby cultural institutions and state and city government offices, including Hartford Public Library, which will house 12,000 square feet of UConn classrooms, a library collection, and study areas.


The campus will be the home for the university’s Department of Public Policy, Urban and Community Studies Program, Cooperative Extension System, and the Connecticut State Historian.  A new Barnes & Noble bookstore is also coming downtown as part of the new campus.

UConn is also touting the demographics of the student population:  47 percent minority students, and a 13:1 student-faculty ratio.  It anticipates 1,347 undergraduates and 1,602 graduate students downtown, at the undergraduate campus, School of Social Work and business school, which has been downtown for more than a decade.  A year ago, the Board of Trustees voted to extend the Graduate Business Learning Center’s (GBLC) lease at 100 Constitution Plaza, and to add two additional floors to the existing space, allocating a total of six floors of classroom, meeting and office space.

The UConn School of Social Work is moving from West Hartford down the block from the new undergraduate building, to 38 Prospect Street, directly across from the Wadsworth Atheneum.  And, it was announced earlier this month, regular bus service between Storrs and Hartford is getting underway, free of charge to students. There will also be a shuttle bus running a loop downtown, and although there is no designated student parking, officials say the number of available spaces in nearby lots should be more than sufficient.

Meanwhile, at UConn’s Stamford campus, the inaugural move-in weekend is scheduled for August 26th and 27th, as the campus offers student housing for the first time. The student dorm, at 900 Washington Boulevard, is 2 blocks south of the UConn Stamford campus and halfway between the main campus building and the Stamford Transportation Center.

The building is six stories tall and will have 116 apartment units. the school's website explains. The maximum occupancy of the building is approximately 350 students, but because some of the bedrooms will be single occupancy, the target occupancy is 290 students. Plans call for 100 designated parking spaces for students will be available for a small additional charge.

The residence hall also includes an 80-person meeting room, administrative offices and a lobby on the first floor. Each floor has a study lounge, and the second floor has a large community center in which students can congregate and have events. The University will manage Stamford housing as in Storrs, with an on-site Resident Director and on-floor Resident Assistants.

The current UConn Stamford academic campus, at the corner of Washington Boulevard and Broad Street in downtown Stamford, opened in 1998, although courses had previously been offered in the city. The facility also provides current UConn students, faculty and staff access the on-site Fitness Center free of charge.

In addition to the main campus in Storrs, UConn also has a presence in Waterbury and Avery Point, as well as the School of Law in Hartford’s west end and the Health Center in Farmington.  The former UConn Torrington campus closed a year ago, due to “declining interest among students, falling enrollment, a limited faculty, and changing regional demographics,” according to school officials.

Hartford, New Haven, Bridgeport Among Highest in US for Households That Don’t Own Cars

Whether it is good news or bad news may be in the eye of the beholder.  The percentage of households without a motor vehicle in Hartford is 10th highest in the nation.  New Haven (24th) and Bridgeport (49th) also make the top 50. Some would suggest that lack of car ownership is a reflection of poverty.  Others may point to millennials and others who choose an urban lifestyle specifically because car ownership is less necessary.

In Hartford, 35.7 percent of households do not own cars.  In New Haven it is 29.2 percent; in Bridgeport, 21.2 percent, according to data compiled by Governing magazine, using data from the Census Bureau's 2010-2013 American Community Survey.

Taking cars off streets yields a number of benefits for cities, including helping to attract young people, limiting pollution and facilitating safer roadways for both drivers and pedestrians, explains Norman Garrick, who studies urban planning at the University of Connecticut. That’s part of the reason “cities are really doubling down and trying to reduce use of cars,” he pointed out to Governing magazine in 2015.

Nationwide, about 9 percent of U.S. households didn’t have access to a car in 2013, according to Census data analyzed by Governing -- a figure that has been relatively stable.  Garrick’s past research in Hartford, for example, found 71 percent of employees drove alone to work for an insurance company that charged for parking. Rates for other downtown Hartford employers offering free parking were between 83 and 95 percent.

Among the other Connecticut communities reviewed in the analysis (% of households without cars, ranking):

  • Waterbury          18.2 of HH           69th
  • New Britain        17.7% of HH        74th
  • East Hartford     15.9% of HH        87th
  • West Haven       11.9% of HH        151st
  • Stamford             11.8% of HH        156th
  • Meriden              11.4% of HH        169th
  • Norwalk               9.4% of HH          262nd
  • Danbury               9.3% of HH          271st

Census estimates suggest there were about 1.8 vehicles per U.S. household in 2013. This ratio varies greatly across cities and larger regions. As one would expect, suburban jurisdictions tend to have greater car ownership than more densely-populated cities. Data was included for all cities (794) with at least 50,000 residents.

National Leader, Connecticut Green Bank Reaches Milestone in Project Financing

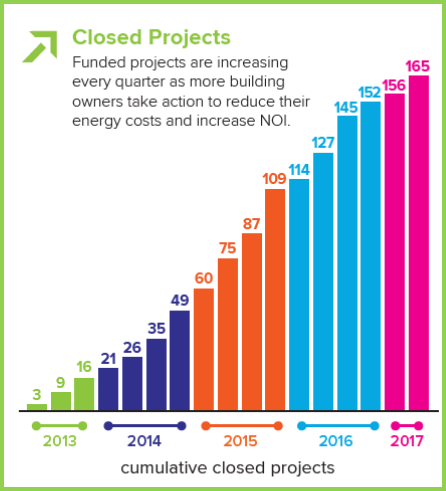
The Connecticut Green Bank’s C-PACE program recently surpassed $100 million in closed project financing. Out of the 19 states with C-PACE (Commercial Property Assessed Clean Energy) programs, this project financing level is second only to California, according to officials. The Connecticut Green Bank’s C-PACE program reached the milestone of $100 million in total closed project financing. The solar photovoltaic (PV) and energy efficiency projects, which vary in size and scope, are saving more than $9.29 million annually in energy costs for nearly 170 building owners across multiple sectors. 

The Green Bank, which administers the C-PACE program, seeks to make green energy more accessible and affordable to commercial and industrial property owners by providing no money down long-term financing for meaningful energy upgrades to their buildings.

C-PACE enables building owners to finance qualifying energy efficiency and renewable energy improvements through a voluntary assessment on their property tax bill. As the program grows, more Connecticut businesses can achieve lower energy costs. Reaching $100 million in closed project financing reaffirms Connecticut’s program as a national leader, officials indicated.

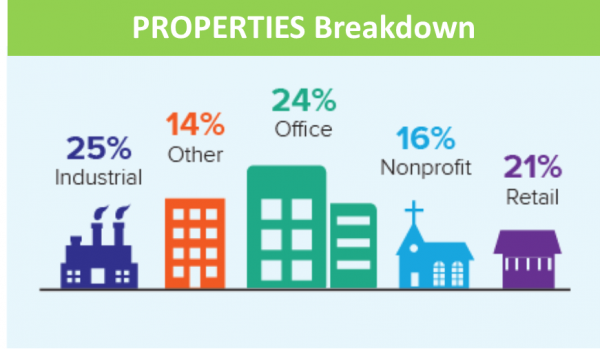
Since its inception in 2011, 166 C-PACE projects have been closed in 69 of the 128 municipalities that have opted into the program. C-PACE funds have been used in manufacturing facilities, non-profits, houses of worship, retail establishments, office buildings, and other business entities.  The projects consist of solar installations, new boilers, energy efficiency lighting measures, HVAC systems, and other energy improvements that help building owners to take control of their energy costs.
“Connecticut’s Green Bank has really been the national leader for C-PACE,” said David Gabrielson, the Executive Director of PACENation, the national non-profit that supports development of PACE programs nationwide. “The way they administer their program has really served as a great example for other program administrators throughout the U.S., and we congratulate the entire Green Bank team on this impressive milestone.”

The project that propelled the Green Bank over this milestone will be installed at Farmington Sports Arena (FSA). FSA is a 130,000-square foot modern indoor sports facility that is home to four indoor and three outdoor artificial turf fields as well as four natural grass outdoor fields. The project, which will be installed by 64 Solar, consists of two solar PV systems (170 kW total).

Connecticut’s C-PACE program maintains an open market approach, allowing private capital providers to finance projects for building owners, and, in 2015, the Green Bank reached an agreement that provided it access to up to $100 million in private funding for C-PACE projects. Today, nearly 70% of the funding in the program consists of private capital.

“The Connecticut Green Bank is a leader in the green energy movement, but the rapid growth of C-PACE wouldn’t be possible without the support of our contractors, capital providers, municipal officials, and other stakeholders who have contributed to the C-PACE movement,” said Mackey Dykes, Vice President of Commercial, Industrial and Institutional programs at the Connecticut Green Bank. “There is still significant potential for energy improvements for Connecticut businesses and non-profits, and we look forward to bringing cleaner and cheaper energy to more building owners across the state.”

The website Energy Collective noted recently that “states have and will continue to play a key role in leading the clean energy transition,” highlighting the work in Connecticut as among the national models.

“Connecticut has found a way to make the financing of clean energy deployment more accessible and affordable for consumers and businesses. In 2011 the state legislature created the Connecticut Green Bank, the nation’s first green bank. It uses public funds to attract private capital investment in green energy projects. By leveraging private investment, the Green Bank significantly increases the total amount of financing available for clean energy projects.

The site highlighted that “Among the Green Bank’s most successful initiatives is the Commercial Property Assessed Clean Energy (C-PACE) program, which allows commercial property owners to pay for clean energy or efficiency upgrades over time through their property taxes.

The Connecticut Green Bank is the nation’s first green bank. Established by the Connecticut General Assembly on July 1, 2011 as a part of Public Act 11-80, the Connecticut Green Bank evolved from the Connecticut Clean Energy Fund (CCEF) and the Clean Energy Finance and Investment Authority (CEFIA), which was given a broader mandate in 2011 to become the Connecticut Green Bank.

https://youtu.be/kPqO4QlTkDU

New School Year Approaches Without Seat Belt Requirement on School Buses

June 7 was the final day of the regular legislative session in Connecticut.  It was also the day following the signing of a new law to require seat belts on school buses – in Nevada. Gov. Brian Sandoval signed legislation, approved overwhelmingly by his state’s legislature, which requires that any new school bus purchased by a school district on or after July 1, 2019, be equipped with a shoulder-harness-type safety belt assembly for passengers.

There was no similar bill signing in Connecticut.  Legislation that would have imposed a similar requirement in Connecticut, effective in 2022, failed to get out of the Transportation Committee after a public hearing months earlier.  The new school year approaches with no requirement in Connecticut, and no change in policy on the horizon, despite years of efforts.

Nevada joins only six other states — California, Florida, Louisiana, New Jersey, New York and Texas —in enacting laws requiring seat belts. In Louisiana and Texas, however, the requirements are contingent upon funds being appropriated by the state, which has yet to occur.

The Connecticut legislator leading the unsuccessful effort says cost, rather than safety, drove the result.

"While the bill did not get voted out of the Transportation Committee, it was given a public hearing and received some favorable comments from committee members,” Rep. Fred Camillo told CT by the Numbers this week.  “The main hold up continues to be funding, something that will take out of the box concepts as the state fiscal situation has not been resolved. I look forward to continuing the effort until our goal is achieved."

It has been elusive here, and elsewhere, despite a change in position by the National Highway Traffic Administration, more than a year ago.  The federal agency previously viewed school buses as safe without seat belts, because of their construction.  That changed in 2015.  Since then, as Connecticut’s Office of Legislative Research noted last year in a report to the legislature, “NHTSA has been exploring ways to make seat belts on schools buses a reality.”

The Connecticut Association of Public School Superintendents testified against the measure, calling for approval to be “postponed” until a series of questions – ranging from the use of bus monitors to the cost of seat belt maintenance to district liability from unused seat belts – could be answered.

The Connecticut Association of Boards of Education (CABE) – representing local elected school boards across the state – also voiced their opposition at the January 30 public hearing.  CABE officials expressed concern about “years of busses” that would “need to be replaced or retrofitted.”  They also noted that lap belts “would not work best for 5-year-olds and 18-year-olds alike.”  In addition, questions were raised about students who might “unclick the belt” and the liability of bus drivers if they did.

Camillo initially proposed the bill in 2011 after a Rocky Hill student was killed in a school bus crash.   earlier this year, in March, after a school bus accident in Canterbury sent five students to the hospital, public discussion on the pending proposal was renewed, but the legislature did not take action.  “This accident today is just another reminder that we really need to do something regarding this issue. We don’t want to wait for another tragedy to occur,” Camillo told the Norwich Bulletin.  Later that month, five people were injured after a crash involving a school bus in North Haven.

Federal law doesn’t require seat belts on the “big yellow school buses” that most students ride, Stateline reported earlier this year. The buses are designed to protect riders through “compartmentalization,” structural safety features such as high, energy-absorbing seat backs and closely spaced seats so children are kept snug like eggs in a carton, Stateline reporting explained.

However, published reports indicate that those features don’t necessarily protect children during side-impact crashes or high-speed rollovers because passengers don’t always remain within their seating compartment, according to the National Transportation Safety Board, which has recommended for nearly two years that three-point seat belts be included in new buses.

Over the past 10 years, NHTSA reports, 6.2% of fatal injuries in school bus related crashes were school bus occupants.

The American School Bus Council, urging people to “support the school bus,” points out that “students are about 70 times more likely to get to school safely if they ride in the school bus instead of a car.”

Report Outlines Responses to Opioid Emergency as Numbers Climb

It’s official.  The opioid crisis has grown from a national crisis to a national emergency.  That fact is plainly evident than in Connecticut. The national Centers for Disease Control and Prevention (CDC) estimates there are enough opioid prescriptions for every American adult to have their own bottle. Connecticut saw 729 deaths from drug overdoses two years ago, and 917 last year. Published reports suggest that the number is trending towards a thousand deaths in the state this year.

In 2012, Connecticut was ranked 50th in the nation in opioid deaths, with just 2 per 100,000 people.  By 2015, that number spiked 5-and-a-half times, and Connecticut's ranking climbed to 12th.The latest numbers from the Office of the Chief State's Medical Examiner show the trend continued in 2016, with a 21 percent increase in deaths involving opioids in a year.

According to the National Center for Health Statistics, the first three quarters of 2016 brought an average overdose death rate of 19.3 per 100,000 population — a rate that’s 17 percent higher than during the same period in 2015.  If 2016’s rate holds steady through the final quarter — data for it isn’t yet available — it is anticipated that more than 62,300 people will have died of overdoses in the United States in 2016. For Connecticut, however, last year’s numbers were more than 25 deaths per 100,000 - significantly higher than the national average.

A 28-page policy report produced this year by the Governing Institute found that Baltimore, Washington, Ohio, Massachusetts and Pennsylvania “serve as models for other states to jump start their efforts,” to respond to the opioid crises.

The addictive nature of opioids and overprescribing are fueling the epidemic, the Governing report explains, pointing out that “in the last 15 years, the number of opioids prescribed and sold in the U.S. has quadrupled, even though the amount of pain Americans report is the same.”

“The most important thing for policymakers to remember is this epidemic is a multi-faceted that requires multifaceted policy solutions,” the report, “A Crisis: A Practical Guide for Policymakers to Mitigate the Opioid Epidemic,” concluded.

A report released last week from a national commission led by New Jersey Gov. Chris Christie noted that number of deaths is approaching 142 each day from drug overdoses across the country – a death toll that is "equal to September 11th every three weeks," AP reported.

State medical examiner James Gill said in May that his office sees at least two or three overdose deaths a day, and as many as five or six.  The state budget crisis has kept the state’s Chief Medical Examiner’s Office from releasing quarterly data for this year, WTNH reported this month.

“There is no single spot on the continuum of interventions that is the magic bullet,” explained Ohio’s director of the Department of Mental Health and Addiction Services in the Governing Institute report. “Really you just have to take it piece by piece.”

The  report noted that “Medicaid beneficiaries are prescribed opioids at twice the rate of the rest of the population, and research indicates they are at 3 to 6 times greater risk of a fatal overdose.”  The report also observed the impact of the epidemic on the nation’s prison population: Eighty percent of prisoners have a history of drug abuse; 50 percent are addicted to drugs; 60 to 80 percent of prisoners abusing drugs commit a new crime after release; and approximately 95 percent of addicted prisoners relapse when they’re released, according to National Association of Drug Court Professionals (NADCP) data.

In 2016, the Connecticut General Assembly passed a law that prohibits a prescribing practitioner authorized to prescribe an opioid drug from issuing a prescription for more than a seven-day supply to (1) a minor or (2) an adult for first-time outpatient use (PA 16-43).  That timeframe was tightened further under legislation signed into law last month.  The 2016 law included an exception if the prescriber, in his or her professional judgment, determines a longer prescription is necessary, OLR noted.

In June, Gov. Malloy signed a bill that has as a key component reducing the maximum opioid drug prescription for minors from seven to five days.  It was introduced by Malloy at the beginning of session and passed unanimously through the Senate and House. The bill also increases security on controlled substance prescriptions by requiring scheduled drugs to be prescribed only electronically, which officials believe will cut back on the potential for prescription forgeries.  And it requires increased data-sharing between state agencies regarding opioid abuse and overdose deaths.

Attorney General George Jepsen’s office recently announced it would be joining a multistate probe into the marketing practices of opioid drugmakers.  Jepsen did not specify any companies by name, citing “the ongoing and sensitive nature of the investigation.”

Connecticut law allows various health care providers to prescribe opioids and opioid antagonists within their professional scope of practice, including physicians, APRNs, dentists, nurse-midwives, optometrists, PAs, podiatrists, and veterinarians, according to the Office of Legislative Research. Pharmacists can prescribe opioid antagonists if they receive a special certification and training to do so.

Promise Scholar Day Kicks Off School Year for Many in Hartford

When Hartford Promise holds its second annual Promise Scholar Day, a full day of programming and college prep for local Promise Scholars, it will be plainly evident that participating Hartford students are doing precisely what the program aimed to accomplish – they’re going to (and excelling in) college. The day-long program will be held on August 15 at Central Connecticut State University. In just two years, Hartford Promise has 257 Promise Scholars attending more than 50 colleges around the country.

Harford Promise President Richard Sugarman recently told FOX61 that the program can be life changing for these students.  “This is a way to really change the trajectory not only for the kids and families, but for the city of Hartford,” said Sugarman.

The Hartford Promise Scholarship is a "last dollar" scholarship that helps pay expenses not funded by other grants and financial aid packages, allowing students to consider colleges/universities they otherwise would not be able to afford, expanding their options and their worlds, according to officials, who note that financial aid from a college/university does not always cover a student’s costs.

The first class of Promise Scholars just completed their freshman year of college. The second class of Promise Scholars graduated high school in June, having attended Hartford Public Schools throughout the city. The 113 scholarship recipients come from all 18 Hartford high schools, and represent 14 percent of the HPS graduating seniors who live in Hartford. Each will receive up to $20,000 in college scholarships.

Among the colleges that Hartford Promise Scholars are currently attending:

  • Bowdoin College
  • Central Connecticut State University
  • Clark University
  • Eastern Connecticut State University
  • Franklin & Marshall College
  • Georgia State University
  • Howard University
  • Marist College
  • Morgan State University
  • Mount Holyoke College
  • Olin College of Engineering
  • Smith College
  • Trinity College
  • Tufts University
  • University of Connecticut
  • University of Pennsylvania
  • University of St. Joseph
  • Yale University

To qualify for a Promise Scholarship, students must

  • Attend a Hartford Public High School continuously since 9th grade
  • Be a Hartford resident throughout high school
  • Have a 93 % or better cumulative attendance record during high school
  • Have a 3.0 cumulative GPA or better on a 4.0 scale in high school

Students attending any accredited, not-for-profit 4-year college or university will receive up to $5,000 per year if attending full time.  Students attending any accredited, not-for-profit 2-year college will receive up to $2,500 per year if attending full time. Between the class of 2016 and class of 2017, Hartford Promise has helped 257 scholars attend more than 50 colleges around the country totaling approximately $3.2 million in scholarship funds, according to published reports.

Immigration May Be Key to Connecticut's Economic Future (Again)

Immigrants may be a pivotal component in Connecticut’s economic strength – or weakness – in the coming decade, according to recent statistics.  Population projections from the University of Virginia’s Demographics Research Group, reported by the American Immigration Council, show that in many states in the Northeast and Midwest, including Connecticut, growth of the working-age population is slowing due to aging, lower fertility rates, and people moving out of the state. The aging of the workforce in the working-age population can mean shrinking workforces and potential economic problems, the Council reported recently. As a result, “states need to think about how immigration can ameliorate impending trouble.”

By 2020, the number of working age adults (age 25-54) is expected to decline in 16 states. For example, in Maine, while the overall population is expected to decrease by about two percent, the working age population will decline by 16 percent. Vermont and West Virginia can also expect declines of more than 10 percent, while Connecticut, Illinois, Michigan, New Hampshire, Ohio, Pennsylvania, Rhode Island and Wisconsin can expect more than five percent decline, according to the data.

Those states “will become less attractive to the people who are already there, and less attractive to newcomers,” according to UC-Berkeley demographer Ronald Lee, who explained that a shrinking working-age population can hurt a state’s economy: businesses close due to a lack of workers and customers, housing prices drop, schools close, and tax revenue declines.

The decline in the working-age population will not be offset by births, the Council reported, citing data the projects the current total fertility rate is about 1.86 children per woman and would need to be at least 2.08 for the population to replenish itself. At the same time, the U.S. population is getting older and living longer. The Bureau of Labor Statistics (BLS) projects that by 2024, Americans age 55 and older will increase by 18.2 million—reaching 102.9 million, or 38.2 percent of all people in the country.

Reliance on immigrants is nothing new for Connecticut.  The Connecticut Business and Industry Association recently cited statistics from the New American Economy, which indicated that 494,059 Connecticut residents were born abroad.  That is 14 percent of the state’s population, compared to 13 percent across the United States.

For example, almost a quarter (23%) of Connecticut workers in science, technology, engineering, and math fields such as healthcare and bioscience were immigrants.  Over 36,000 foreign-born Connecticut residents are self-employed, with immigrant-owned businesses generating $1.1 billion income in 2014 while employing 73,047 people. “Immigrants are already playing a huge part ensuring that Connecticut remains a leading innovator in industries like healthcare and bioscience,” according to the analysis.

The report also notes that foreign-born workers currently make up 21.3 percent of all entrepreneurs in the state, despite accounting for 13.7 percent of Connecticut’s population.

Immigration mitigates the downward population trends that are anticipated, in Connecticut and beyond. In many areas of the country, the foreign born have accounted for more than 20 percent of the growth of the adult population since 1990. In some areas – mainly in the Midwest – overall adult population would have declined if not for an increase in the foreign born population. Almost half of immigrants admitted between 2003 and 2012 were between the ages of 20 and 40, while only 5 percent were ages 65 or older, the Council reported.