Harp Stands Out as Number of Big-City Black Mayors Diminishes Nationally

Last April, New Haven Mayor Toni Harp was sworn in as the first woman selected as president of the African American Mayors Association (AAMA).  In November, she was elected to a third two-year term leading the Elm City, earning more than 70 percent of the vote. In doing so, she ran counter to an apparent national trend – fewer African American Mayors in the nation’s largest cities.  According to an analysis by Governing magazine, in 2000, 19 of the largest cities in the country by population either had, or would soon have, black mayors.  By 2017, that number had fallen to six. Today, the Wall Street Journal recently reported, that number is four.

African Americans, and African American women, continue to be elected to City Hall.  Charlotte and New Orleans both elected their first black women mayors in November.  St. Paul and a number of smaller cities elected their first black mayors ever, the publication reported.

Among Connecticut’s largest cities, the mayors of Bridgeport, Hartford, Stamford, Waterbury, and Danbury are white males.  Hartford, which elected Thirman Milner and Carrie Saxon-Perry decades ago, hasn’t elected an African American since, but has seen two Latino men hold the office.

Carrie Saxon Perry was the first black woman to be elected mayor of a major New England city – in 1987. Milner was the first black mayor in all of New England, elected in Hartford in 1981. There hasn’t been a black mayor leading the Capitol City since Saxon-Perry’s term ended in 1993.

Were the current office-holder, Luke Bronin, to resign the office (a scenario that could result if he decides to run for Governor and if he is elected later this year) the newly elected City Council President, Glendowlyn Thames, could change that, if she succeeds to the office.

New Haven’s first black Mayor was John Daniels, who served from 1990 to 1993.  Like Harp, he previously served in the State Senate.

Across the country, Jacksonville, Memphis, Philadelphia and San Antonia had black mayors until recently, Governing reported.  Detroit elected its first white mayor in 40 years in 2013. The nation’s largest cities – New York, Los Angeles and Chicago – have each has one black mayor, years ago. Atlanta elected a black female as mayor in a run-off election, winning with just over 50 percent of the vote.

Harp is the only member of the AAMA from Connecticut.  The organization was formed in 2014.  Fifty years ago, the election of Carl Stokes in Cleveland in 1967 put him on the cover of TIME magazine as the first black elected mayor of a major U.S. city. Richard Hatcher, also African American, was elected mayor of Gary, Indiana that same year.


Norwalk, New Haven Among Communities Receiving Free Home Smoke Alarms

With the Connecticut Home Fire Campaign, the American Red Cross is working to reduce death and injury from home fires by 25% by 2020.  “Sound the Alarm. Save A Life.”, a series of home fire safety and smoke alarm installation events in Connecticut and nationwide, is deploying volunteers will install 100,000 free smoke alarms in high risk neighborhoods. In Connecticut, the initiative has been to 76 cities and towns, replacing nearly 1,000 smoke alarm batteries and installing more than 12,000 smoke alarms.  The program has conducted more than 700 in-home visits, making an estimated 4,400 households safer, according to officials.

Norwalk was the center of activity last month, and New Haven is next in line. 

Teams make visits to homes sharing fire safety and preparedness information and install smoke alarms in homes as requested. Volunteers help families understand the importance of fire safety and help them develop personalized family escape plans to use in the event a fire breaks out in their home.

The program was in Norwalk in December in conjunction with the City of Norwalk, and will be in New Haven in the spring.  A large-scale event is scheduled for New Haven to install 1,000 smoke alarms in and around the city on April 28, 2018.

“Our mission at the American Red Cross is to prevent and alleviate human suffering caused by disasters,” said Mario Bruno, CEO, American Red Cross Connecticut and Rhode Island Region. “Home fires are the biggest disaster threat faced in the U.S. On average, in our region, we respond to about two home fires each day. Our goal is to reach as many homes as we can with this program to help ensure people know what to do and are prepared in the event they experience a home fire. We want people to be safe.”

Nationally, the Red Cross just installed its one millionth smoke alarm last fall.  Since October of 2014, the Red Cross has worked with fire departments and community groups across the country as part of a multi-year campaign to reduce the number of home fire deaths and injuries.

Officials indicate that 60 percent of house fire deaths occur in homes with no working smoke alarms. The campaign initiative is in direct response to that “dire threat,” with the Red Cross committing to install 2.5 million free smoke alarms in neighborhoods at high risk for fires, and to educate those residents about fire prevention and preparedness.

Officials estimate that as of November 2017 the Red Cross and partners have saved more than 285 lives nationwide as part of the campaign.  In Connecticut, individuals can make an appointment by visiting http://www.redcross.org/local/connecticut/home-fire-safety-visit or by calling 877-287-3327 and choosing option 1 on the menu to request a smoke alarm installation.

Eversource Hartford Marathon Brought $14.5 Million in Economic Benefit to Region in 2017

Just four years ago, in 2014, there was a title sponsor changing-of-the-guard at Connecticut’s premier spectator sporting events, as Eversource took over sponsorship of the Hartford Marathon, Travelers stepped in to save the state’s PGA Tour event (now the Travelers Championship), and United Technologies took the lead sponsorship that same year of what had been the Pilot Pen tennis tournament, now renamed as the Connecticut Open. Aside from a source of pride in maintaining marquee sporting events, the economic impact of the events continue to underscore the significance of local corporations coming through to sustain the events.

The latest evidence comes with news that the Hartford Marathon Foundation’s 2017 Eversource Hartford Marathon, Half Marathon, Team 26.2 Relay and Charity 5K brought an estimated $14.5 million of economic value to the area over the course of race weekend.  That figure is up from an estimated $13.6 million in 2015.  Eversource is signed on as title sponsor through 2019.

Official indicated that the Hartford Marathon Foundation (HMF) spent approximately $1 million to produce the Saturday, October 14th race in 2017, primarily working with local vendors and service providers.

In addition to a local economic boost to the city of Hartford and surrounding communities, the marathon drew 71,780 spectators, participants and volunteers to the area. Officials point out that runners, friends and families stayed in Hartford lodging, shopped in the area and dined in local restaurants. Significantly, 87 percent of participants visited Hartford primarily for the event. Of those traveling from out of state, 44 percent were visiting the city for the first time, officials specified.

Thousands of runners are motivated to use the race to raise funds on behalf of various charities and causes. Through these efforts more than $288,000 was raised and reported by the event’s 20 official charities and other groups, although charity fundraising is not required to be reported, so the true numbers may be higher.

The annual Travelers Championship has an annual economic impact on the state of $68.2 million, according to a recent study by Connecticut Economic Resource Center, Inc. (CERC). An economic impact study conducted a decade ago, in 2008, found that the tennis tournament predecessor to the Connecticut Open contributed approximately $26 million to the regional economy, including $10 million in local economic impact.

The Hartford Marathon will mark its 25th running on October 13, 2018.  The 2018 Travelers Championship, will be held June 18-24 at TPC River Highlands in Cromwell.  The Connecticut Open, at the Connecticut Tennis Center at Yale, will be held August 17-25 in 2018.

“We’re proud to host people from across the country to achieve personal goals and celebrate their accomplishments,” said Beth Shluger, CEO of the Hartford Marathon Foundation and Race Director of the Eversource Hartford Marathon and Half Marathon. “We are able to highlight the best of what the capitol region has to offer in a positive and truly inspiring event that allows tens of thousands to run, walk, volunteer or spectate. We are excited to be celebrating our 25th running in October 2018 and hope to create an even bigger positive impact through this milestone event.”

The Hartford Marathon Foundation also produces more than 30 events through the year, many that contribute to other organizations’ community fundraising goals.  The 2017 Mystic Half Marathon and 10K in May 2017 generated $28,000 to benefit the charitable works of the Mystic Rotary Club.  Additional fundraising events HMF was contracted to produce races for in 2017 include the Mahoney Sabol 5K to benefit Hospital for Special Care, CT Race in the Park to benefit CT Breast Health Initiative, Zero Prostate 5K to benefit ZERO - The End of Prostate Cancer, Achilles CT Hope & Possibility 5K & 10K to benefit Achilles International – CT Chapter, Pumpkin Run/Walk to benefit Youth & Family Services of Haddam-Killingworth, Inc. and the Norwich Winterfest 5K to benefit Reliance Health, Inc.

Hartford Rail Line May Bring Jobs, Opportunity for Key Populations, Study of Public Transit Suggests

As Connecticut moves closer to a significant increase in rail service connecting communities from New Haven to Springfield, MA, with the introduction of the Hartford line, anticipated in May, a report by Demos underscores the potential impact on economic opportunity and segments of the state’s population. The report, “To Move is to Thrive:  Public Transit and Economic Opportunity for People of Color,” which looked at public transportation in metropolitan areas across the country, presents a series of findings on the use of public transit by people of color and on the potential jobs benefits that people of color can gain from investments in public transit.

Its key findings on the use of public transit are:

  • Racial, ethnic, and class inequities in the access to and funding of public transit continue today.
  • Latino and Asian-American workers are twice as likely as white workers not to have a vehicle at home. African American workers are three times as likely. These disparities are heightened in certain metropolitan areas; Latino and black workers lack a private vehicle at as much as six times the rate of white workers in some areas.
  • Asian-American and African-American workers commute by public transit at nearly four times the rate of white workers. Latino workers commute by public transit at nearly three times the white rate.
  • Workers of color are overrepresented among public transit commuters with “long commutes”—one-way commutes of 60 minutes or longer.

The key findings on the jobs benefits from investment in public transit are:

  • America’s employment rates are still low relative to 2000, and there is a strong racial hierarchy in employment rates.
  • The majority of the jobs created from infrastructure investments can be non-construction jobs.
  • All racial and ethnic groups gain jobs from large infrastructure investments and, generally, the larger the investment, the more jobs for each group.
  • Investments in public transit show good returns in terms of the shares of the total jobs going to workers of color.

The report also noted that “growing numbers of Americans rely on public transit in their daily lives. In 2015, passengers took 10.5 billion trips on transit systems, up 33 percent from 20 years ago. Public transit ridership has grown faster than the population. But our public transit infrastructure, like much of our infrastructure generally, is old and decrepit. And many of our transit systems were not designed to handle such heavy use.”

While Connecticut’s cities are not as large as many of the nation’s largest metropolitan areas, they do have populations with larger numbers of people of color than mnay surrounding suburbs.  Providing greater ease of mobility to station stops along the Hartford line could offer impacts suggested by the study.

The Hartford line, which is focused on increasing the frequency of station stops from Springfield to New Haven, will also see additional stations constructed in the coming years.  When the CTrail Hartford Line service launches in May, it will consist of both expanded Amtrak service and new regional trains operated by the Connecticut Department of Transportation and will offer more frequent, convenient and faster passenger rail service between New Haven, Hartford and Springfield.

Plans call for an increase in the number of round trip trains from six daily Amtrak intercity and regional trains to a total of 17 round trip trains a day to Hartford, and 12 trains per day to Springfield. In addition, trains will operate at speeds up to 110 mph, reducing travel time between Springfield and New Haven. Stops are to include rail stations in Windsor Locks, Windsor, Hartford, Berlin, Meriden, Wallingford and New Haven.   New stations are to be added, refurbished or relocated in North Haven, Newington, West Hartford, Windsor, Windsor Locks and Enfield by 2020.

Projections include more than 4,500 construction related jobs and over 8,000 total jobs, including both direct and indirect jobs.  Transit-oriented development, including housing is also anticipated along the route. Recently, plans to convert a long-vacant factory into housing was announced in Windsor Locks.

The national data indicates that workers of color are roughly 2 to 3 times as likely as white workers not to have a private vehicle at home: only 2.8 percent of white workers do not have a vehicle at home, but 6.9 percent of Asian-American workers, 7 percent of Latino workers, and 9.5 percent of African-American workers do not have a vehicle at home.

Nationally, 3.1 percent of white workers use public transit, while 7.8 percent of Latino workers, 11 percent of Asian-American workers, and 11.1 percent of African-American workers commute using public transit. In other words, Latino workers are almost 3 times as likely, and Asian-American and African-American workers are almost 4 times as likely as white workers to commute by public transit, the report indicated.

Based in New York, Boston and Washington D.C., Demos is a public policy organization “working for an America where we all have an equal say in our democracy and an equal chance in our economy.”

Hartford, New Haven See Diminishing Car Ownership Among Households; Hartford Ranks 8th in U.S. in Percentage Without Cars

Owning a car isn’t what it used to be – at least it isn’t as necessary as it used to be.  Demographics, fuel prices and where people live also play a role in whether a household goes car-free, according to a recent analysis by Governing magazine. Research also suggests younger families and one-person households are more likely to not own a car. The publication reports that several mid-sized cities recorded notable increases in shares of car-free households when averages from the 2015 and 2016 American Community Surveys are compared with those for 2009 and 2010. Those cities include New Haven.

According to the Census Bureau estimates, only 8.7 percent of U.S. households reported not having any vehicles available in 2016, about the same level as before the Great Recession.

In New Haven, the trend is stronger.  About 30 percent of New Haven households are without access to vehicles, an increase from about 27 percent in 2009-2010, Governing points out.  Part of the reason so many residents can go car-free stems from the city’s fairly residential downtown and pedestrian-friendly street grid layout, the publication explains, adding that New Haven’s high poverty rate is also a likely contributing factor, with many families unable to afford cars.

Other cities earning a spot on the list of for rapidly dropping car ownership are Paterson, N.J.; Davenport, Iowa; Elizabeth, N.J.; and Peoria, Ill.

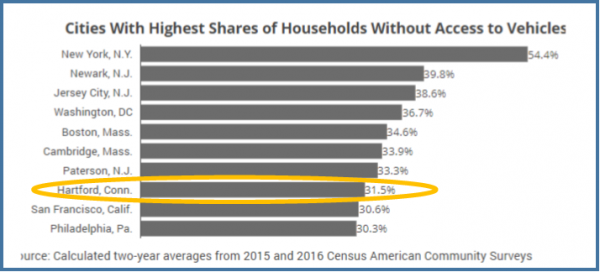
Hartford has a presence in the top 10 cities that already have among the highest share of households without a car, at a 31.5 percent two-year average.  Hartford ranks 8th.  The list is led by New York City at 54.4 percent, with Newark, Jersey City, Washington, Boston, Cambridge and Paterson in between.  San Francisco and Philadelphia round out the top 10 after Hartford.  Hartford increased from 30.3% in 2015 to 32.6% in 2016.

Among other Connecticut cities, Stamford’s households without vehicles is at 10 percent; Waterbury at 20.5 percent; and Bridgeport at 21.1 percent.

Data was calculated using two-year averages from 2015 and 2016 Census survey estimates.

Accrediting Organization to Decide Fate of Plan to Merge 12 Community Colleges into One

Plans to merge Connecticut’s 12 community colleges into a single institution, expected to be called the Community College of Connecticut, are now being reviewed by the region’s accrediting body, the New England Association of Schools and Colleges, known best by the acronym, NEASC. Back in August, after first learning about the Connecticut merger proposal in an 18-page outline provided by Connecticut officials, NEASC had questions, and many of them.  In a detailed four-page letter to the leadership of the Connecticut State Colleges & Universities (CSCU), NEASC indicated they had yet to receive “sufficient information to be confident CSCU’s process will result in arrangements that are compliant with the Standards for Accreditation.”  The letter from David Angel, Chair of NEASC's Commission on Institutions of Higher Education, was shared with the leadership of all the colleges and universities in the state's public CSCU system.

NEASC officials met three times with Connecticut officials last year, the Connecticut Post reported recently. Another meeting in Connecticut is planned for this month.

The President/Chief Executive Officer at NEASC, since 2011, is Cameron Staples, a former Connecticut state legislator and former chair of the legislature’s Education Committee and Finance, Revenue and Bonding Committee.  In 2010, he briefly sought the Democratic nomination for Attorney General.  

The letter from NEASC also indicated that “the materials submitted to date have been very clear on the financial reasons for the proposed change but less clear on a rationale tied more directly to the mission of the colleges.”  NEASC noted that the proposal stated plans to retain the “unique mission” and “local community connection” of each of the 12 institutions after the merger, but indicated the need for “further information about how this will be accomplished through the proposed merger.”

The consolidation plan was subsequently approved by the Board of Regents of CSCU in December, with only one member of the Board abstaining and others unanimously supporting the plan, developed to save money across the system by eliminating staff positions, many said to be duplicative, that would not adversely impact students.  Student and faculty groups at the campuses have raised questions about the ultimate effectiveness of the plan, or have opposed it outright.

Following approval by the Regents, a more detailed plan was submitted to NEASC seeking approval from the accrediting organization.  If NEASC accreditation is obtained, Connecticut officials hope to have initial implementation by July 1 of this year and the new structure fully in place by July 1 of next year.  That is predicated on receiving NEASC approval by June; published reports indicate that NEASC officials anticipate consideration at the organization’s board meeting this spring.

NEASC’s Barbara Brittingham, president of the Commission, recently told the CT Post that Connecticut’s timeline was “ambitious,” particularly for a “substantive change” that involved 12 colleges.  The newspaper also reported that several Regents committees are at work looking at 1) integrating new positions and selecting people to fill those jobs, 2) aligning 12 academic course catalogs and 3) fine-tuning the projected savings of the new system.

Since December’s Regents approval, in media interviews and public explanations, details of what’s planned are being highlighted, while the system awaits NEASC approval.  The merger plan was initially proposed last April as an “expedient solution” in reaction to state funding cuts to the colleges and an ongoing “structural deficit” resulting from operational costs outpacing revenue.

The plan calls for 12 college president positions to be eliminated, with a new structure to take its place that would include a creation of a “vice chancellor” position to lead the new 12-campus community college system, along with three new regional president positions that would report to the vice chancellor, each with presumably jurisdiction over four college campuses.  Each of those 12 campuses would be led by a campus vice president.

The Regents plans would consolidate college functions in six areas:  Information Technology, Human Resources, Purchasing, Financial Aid Services, Institutional Research and Assessment, and Facilities Management. 

The plan anticipates saving $28 million a year by eliminating college presidents, a process that has already begun, as well as budget staff and other administrators at each institution and creating a centralized staff to run the public colleges. Another plan aimed at saving an additional $13 million by reorganizing how financial aid, enrollment management and other services are delivered is also part of the proposal.

The proposal would create one of the nation’s largest community colleges with about more than 53,000 students. Among the largest currently are Miami Dade College with 174,000 students; Lone Star College in Houston, with 90,000; Northern Virginia Community College, in Springfield, VA, with 76,000 students; Broward College in Fort Lauderdale, with 67,000 students, and Houston Community College with 63,000 students.

Officials note that Connecticut’s higher education system has changed previously, including when the four regional state universities and 12 community colleges, along with the on-line Charter Oak State College, were brought together under the newly established Board of Regents umbrella six years ago, and when the state’s technical colleges and community colleges merged in the 1990’s.

NEASC is the regional accreditation agency for colleges and universities in the six New England states: Connecticut, Maine, Massachusetts, New Hampshire, Rhode Island, and Vermont, recognized by the U.S. Secretary of Education. NEASC accreditation is a system of accountability that is ongoing, voluntary, and comprehensive in scope.  It is based on standards which are developed and regularly reviewed by the members and which define the characteristics of good schools and colleges, according to the organization’s website.

Where Are America’s Big Spenders? Connecticut Ranks Number 6

Consumer spending is the engine that powers the American economy, accounting for about 70 percent of all activity. When the U.S. Bureau of Economic Analysis— part of the U.S. Department of Commerce—published new numbers in October tabulating personal consumption, the website howmuch.net reviewed the data and published the state-by-state breakdown. The data includes areas such as housing and utilities, health care expenses, and eating at restaurants. Washington D.C. topped the personal consumption per capita list, and Connecticut reached the top ten, landing at number six.  The data, the website suggests, “reveals an interesting snapshot about the economy.”  The top ten:

  1. Washington, DC: $56,843
  2. Massachusetts: $51,981
  3. Alaska: $49,547
  4. New Jersey: $48,972
  5. New Hampshire: $48,810
  6. Connecticut: $48,497
  7. North Dakota: $48,225
  8. Vermont: $47,648
  9. New York: $46,906
  10. Hawaii: $45,123

The map of the data illustrates a number of trends including that the Northeast has a cluster of heavy consumer spending states.  Six of the top ten most expensive places are in the Northeast, including three of the New England states, led by Massachusetts.

There is also a collection of lower consumer spending states across the Deep South to the Southwest, stretching all the way from North Carolina ($33,779) to Nevada ($36,177) and even up to Oregon ($39,742). At the bottom of the list is Mississippi, “where it costs only $30,200 to pay for life’s most common expenses,” the website points out.

New England Colleges Prepare Report on Employability of Students; Draft Recommendations Outlined

December 22 is the deadline for those seeking to comment on the draft report and recommendations of the Commission on Higher Education & Employability, established earlier this year by the New England Board of Higher Education (NEBHE).  The Commission, which includes nine representatives of institutions and organizations in Connecticut, released its preliminary findings at a day-long Summit in Boston. “Despite the region’s strength in postsecondary institutions, employers remain concerned about a lack of qualified, skilled workers, particularly in technology-intensive and growth-oriented industries,” the draft report notes. “The Commission has proposed a draft action agenda, policy recommendations, strategies and next steps to align institutions, policymakers and industry behind increasing the career readiness of graduates of New England colleges and universities—and facilitate their transitions to work and sustained contributions to the well-being and competitiveness of the region.”

In addition to five strategic priorities,  the draft report includes specific recommendations are being considered in five areas:  Labor Market Data & Intelligence; Planning, Advising & Career Services; Higher Education-Industry Partnerships; Work-Integrated Learning; Digital Skills; and Emerging Credentials.

Among the recommendations being considered are a call for higher education institutions to incorporate employability into their strategic plans/priorities; determine their effectiveness in embedding and measuring employability across the institution; and develop a regional partnership for shared purchasing and contracting of labor market data, information and intelligence services.

The proposed recommendations also call on the New England states to “collaborate to launch multistate, industry-specific partnerships beginning with three of the top growth-oriented sectors, including: healthcare, life and biosciences and financial services.” It further urges the states to explore “implementing policies (public and institutional) that incentivize businesses (through tax credits or other means) to expand paid internships.”  The draft report also calls for the establishment of a New England Planning, Advising and Career Service Network.

The draft report calls on the states to “confront notable college-attainment gaps and the related personal and societal costs,” and “consider specific employability strategies to target and benefit students who are at risk of not completing postsecondary credentials, including underrepresented populations.”

Eastern Connecticut State University President Elsa Núñez led a session at the Summit about the Commission's “Equity Imperative.” Officials indicate that Commission's workforce vision serves all New Englanders ... “as a matter of social justice, but also as a matter of sound economics in the slow-growing region.”  Núñez highlighted her internship work with students who may not have cars or other resources to capitalize on off-campus work-integrated learning.

In addition to Núñez, the nine members of the Commission from Connecticut are:

  • Andrea Comer, Vice President, Workforce Strategies, Connecticut Business & Industry Association Education and Workforce Partnership
  • Freddy Cruz, Student, Eastern Connecticut State University
  • Maura Dunn, Vice President of Human Resources & Administration, General Dynamics Electric Boat
  • Mae Flexer, State Senator
  • Tyler Mack, Student Government Association President, Eastern Connecticut State University
  • Mark Ojakian, President, Connecticut State Colleges & Universities
  • Jen Widness, President, Connecticut Conference of Independent Colleges
  • Jeffrey Wihbey, Interim Superintendent, Connecticut Technical High School System

The commission also includes six members from Vermont, seven members from New Hampshire and Maine, 11 from Massachusetts, 12 from Rhode Island, as well as two regional members and six representatives of NEBHE. The Commission's Chair is Rhode Island Governor Gina Raimondo.  The proposed recommendations, developed during the past six months, have broad implications, according to officials, “critical to building a foundation for moving forward the Commission's efforts toward strengthening the employability of New England's graduates.”

At Eastern Connecticut State University—which is about 30% students of color—lower-income, minority and first-generation students often had no cars, so had difficulty traveling off campus to internships. White students got most of the internships, President Elsa Núñez told the NEHBE Journal earlier this year.

The Journal reported that Eastern’s Work Hub eliminates that need, allowing students to develop practical skills doing real-time work assignments without having to travel off campus, and providing the insurance company Cigna with a computer network and facility where its staff could provide on-site guidance and support to Eastern student interns.

The draft report’s strategic priority recommendations include:

  • New England state higher education systems, governing and coordinating boards, together with New England’s employers, should make increased employability of graduates a strategic priority—linked to the strategic plans, key outcomes, performance indicators and accountability measures for the higher education institutions under their stewardship.
  • New England higher education institutions should incorporate employability into their strategic plans/ priorities supported by efforts to define, prioritize and embed employability across the institution and in multiple dimensions of learning and the student experience—both curricular and extracurricular.
  • New England should make strategic efforts and investments—at the state, system and institution level— to expand research, data gathering, assessment capacity and longitudinal data systems to enable more effective understanding and documentation of key employability-related measures and outcomes.
  • New England higher education institutions should undertake formal employability audits to review the strategic, operational and assessment-oriented activities related to employability–and their effectiveness in embedding and measuring employability across the institution.
  • To confront notable college-attainment gaps and the related personal and societal costs, states must consider specific employability strategies to target and benefit students who are at risk of not completing postsecondary credentials, including underrepresented populations.

The Boston-based New England Board of Higher Education promotes greater educational opportunities and services for the residents of New England. Comments on the recommendations are accepted on-line through Dec. 22.

Philanthropy 101?  CCSU to Offer Course, Capstone Project Aimed at Boosting Philanthropy

Throughout Connecticut, philanthropic organizations distribute more than a billion dollars every year and individuals donate nearly $4 billion more. Responding to both the State’s philanthropic needs and need for skilled philanthropy professionals, Central Connecticut State University is offering an innovative course in the practice of philanthropy beginning next semester. The ambitious 16-week course is to include 25 presenters from local nonprofit and philanthropic organizations, many based in New Britain, as is the CCSU campus.   As part of the course, students will study local needs, create a case study, and write a proposal following the American Savings Foundation grant-making guidelines.  Officials say that at the conclusion of the course, up to two of these projects may each be funded with a $5,000 grant from the American Savings Foundation.

Connecticut ranked 47th among the 50 states in philanthropic giving as a percentage of income, with a “giving ratio” of 2.4 percent, 25 percent lower than the national average, according to an analysis earlier this year by the Chronicle of Philanthropy. The giving ratio is the total of a locality’s charitable contributions as a share of its total adjusted gross income.

“They will learn more than just philosophy,” points out Professor Carol Shaw Austad, who will co-teach with former CCSU President Richard Judd. “This class is hands-on. Students will work in teams to design a philanthropic strategy. They will meet with New Britain nonprofits and evaluate impact, just like any foundation. We expect them to make a strong case statement for an organization or project.”

“There is so much to like about this course,” notes Maria Falvo, president of the American Savings Foundation.  “For one, many of these young people may go on to work at or volunteer with nonprofits. They may be fortunate enough to become donors themselves. This essential training lays the groundwork for a future in philanthropy,” Falvo says.

The giving percentage varied across the state, according to the Chronicle study:  the Fairfield County giving ratio was 2.8%, New Haven County and Litchfield counties 2.1%, Hartford County 1.9%, New London County 1.8%, Middlesex and Tolland Counties 1.7%, and Windham County 1.6%.

Donations from households earning $200,000 or more now total 52 percent of all itemized contributions. In the early 2000s, that number was consistently in the 30s, the Chronicle reported.  The report raises questions about the traditional habit of charitable donations among middle and low income individuals lessening, perhaps as a lingering after-effect of the recession. The Chronicle’s conclusion: “The number of households making room in their budgets for charitable giving is shrinking.”

CCSU President Dr. Zulma R. Toro said “I am especially pleased that this course engages our hometown of New Britain. This is a perfect example of what we mean by “CCSUConnected.” We are connecting to our communities in a mutually beneficial way by engaging our students academically in the life of our community. Our students learn skills and experiences that can prepare them for rewarding careers, and our communities can benefit from our students’ work focused on New Britain’s needs.”

“These community leaders are such a diverse and thoughtful group,” said Dr. Toro.  “Pastor Thomas Mills of Grace Church shares a session with New Britain Mayor (and CCSU alumna) Erin Stewart.  Dr. Ali Antar of the Berlin Mosque is on the agenda as is Dr. Claudia Thesing, formerly director of development at the New Britain Museum of American Art.  The speakers represent a real cross-section of the community.”

The course will run from January 17 to May 9, and is open to undergraduate students at CCSU.

Senior Citizens Less Diverse, Growing in Percentage of State’s Population

Over 575,000 Connecticut residents are age 65 and older, making up an estimated 16 percent of the state’s total population of 3.6 million, according to U.S. Census data updated through 2016.  Those numbers are expected to grow – steadily and rapidly – during the next two decades, experts anticipate. Among Connecticut’s eight counties, the largest percentage of seniors is in Litchfield County, 19.7 percent, followed by Middlesex County, 18.8 percent, and New London County, 17.1 percent.  New Haven (16.3%) and Hartford (16.2%) counties are next, followed by Fairfield and Tolland Counties, both at 14.8 percent.

The data, highlighted by the Connecticut Office of Legislative Research (OLR)  in a recent report, also shows that “Connecticut’s senior population is less ethnically and racially diverse than the state as a whole.”

Just over 89 percent of the state’s seniors (age 65+) are white, compared with 77 percent of the state’s population as a whole.  While 10 percent of the state’s population are Black or African American, that is true of only 6.4 percent of seniors.  The state’s Asian population is 4.2 percent of the total; among seniors, less than half that, only 2 percent, are of Asian heritage.

While the total state population is almost evenly split between male (49%) and female (51%) residents, the senior population has a larger percentage of females (57%) compared to males (43%), the analysis found.  Connecticut seniors are more likely to be veterans (20% vs. 7% of all residents) and more likely to have a disability (32% vs. 11% of residents).

According to a recent report by the state’s Commission on Women, Children and Seniors, Connecticut is the 7th oldest state in the nation.  Roughly one-third of the state’s population are baby boomers, born between 1946 and 1964.  The state also has nearly 1,000 people over the age of 100.  As has been previously projected, the number of Connecticut towns with at least 20 percent of residents age 65 or older will dramatically increase between 2010 and 2020 (see maps below).  The 65 and older population is expected to grow by 56 percent in Connecticut between 2010 and 2040, compared with  1.5 percent growth in the population between ages 20 and 64.

Approximately 7 percent of Connecticut seniors had incomes which fell below the census poverty level, with an additional 8 percent of seniors having incomes between 100 percent to 149 percent of the threshold, the OLR report indicated. The most common source of income for Connecticut seniors is Social Security, with an average benefit of $20,591 per year, as of 2015. An estimated 90 percent of senior homeowners and renters receive Social Security benefits. The second most common source (50.7%) is personal retirement income, averaging $27,240 per year in 2015.

Of the more than 330,000 senior households, an estimated 76 percent are homeowners and 24 percent are renters. This represents higher home ownership rates than the state as a whole (67% of 1.35 million households).

The most common source of income for Connecticut seniors, the report indicated, is Social Security, with an average benefit of $20,591 per year in 2015. An estimated 90 percent of senior homeowners and renters receive Social Security benefits. The second most common source (50.7%) is personal retirement income, averaging $27,240 per year in 2015.

The demographic characteristics of Connecticut’s senior population (e.g. residents age 65 years and older) used by OLR were largely based on the 2011-2015 American Community Survey 5-Year estimates from the U.S. Census Bureau.