Spring Flu Hits Connecticut and Northeast Harder than Rest of USA

Not only does winter refuse to quit in Connecticut, the flu season is also slow to recede, with a second wave hitting the region this month.  According to data monitored by the state Department of Public Health, Connecticut is one of only a handful of states where flu cases have remained widespread well into April.

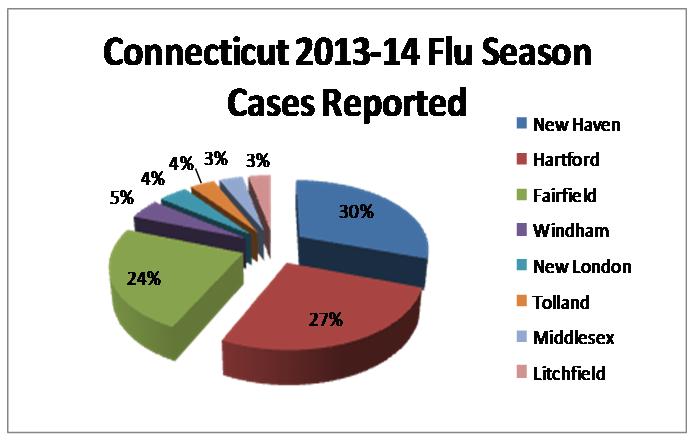
Overall, more than 5,000 cases of various strains of flu have been reported in Connecticut since the start of flu season last fall, with the largest number coming in New Haven County, followed by Hartford and Fairfield Counties.

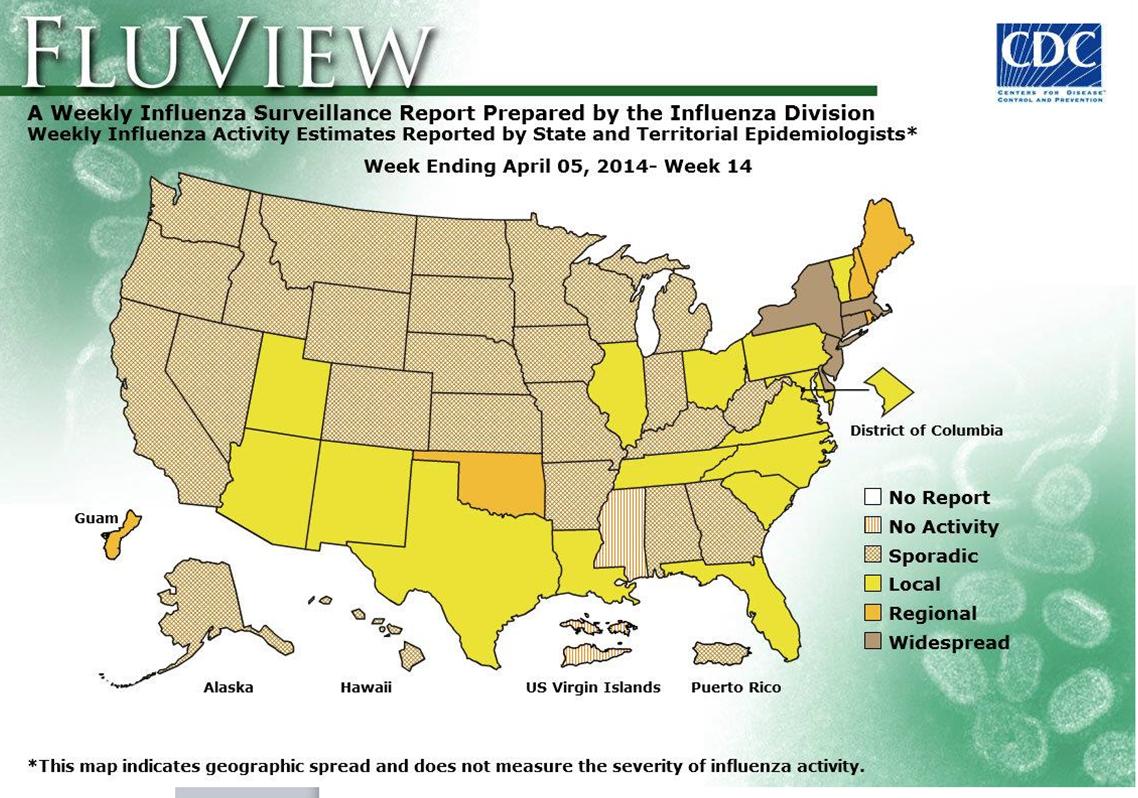
The latest “Flu View” map from the national Centers for Disease Control and Prevention (CDC) indicate while flu season appears to have ended across most of the nation, Connecticut is one of less than a half-dozen states that continue to have “widespread” influenza activity.

flu CTConnecticut is joined by regional neighbors New York, Massachusetts, New Jersey and Delaware in the recent spike in flu cases.  New York has recently been reporting its highest volumes of the entire flu season.  The states of Maine, New Hampshire, Rhode Island and Oklahoma have the next highest level of flu cases, according to the CDC data.

The most recent data, for the week ending April 5, indicates that statewide emergency department visits attributed to the “fever/flu syndrome” have recently increased in Connecticut and continue at a level near or above 5 percent statewide during the last 16 weeks.  The CDC reports that the region including Connecticut, Maine, Massachusetts, New Hampshire Vermont and Rhode Island is one of only two in the nation with “elevated” out-patient flu levels as of early April; the other region with elevated levels includes New York and New Jersey.  The rest of the nation is characterized as being at “normal” levels of flu incidence.

flu view

A total of 5,162 positive influenza reports have been reported for the current season, which is due to conclude, for data collection purposes, next month.  The initial peak in January brought record emergency volumes to some facilities, including Hartford Hospital.  This year’s second wave, is occurring later than a year ago, into April.  Last year's second wave occurred in March.

Influenza has been reported in all eight Connecticut counties since the start of flu season: New Haven (1,559 reports), Hartford (1,384), Fairfield (1,221), Windham (242), New London (220), Tolland (186), Middlesex (179), and Litchfield (171).

This month, Connecticut influenza activity continues to be classified geographically as “widespread” according to the state Department of Health, and many regions in the state are experiencing a second wave of flu activity, led by the influenza B strain, often referred to as “spring flu.”

In Connecticut, the Department of Public Health (DPH) uses multiple systems to monitor circulating influenza viruses. During the influenza season, weekly flu updates are posted from October of the current year, through May of the following year.

Last winter’s flu season brought 57 flu-related deaths to Connecticut, all were among patients at least 55 years of age including 48 (84%) who were greater than 65 years old. The year-long stats, reflecting August 2012 – August 2013, reflected flu instances from residents of all eight Connecticut counties and included: 4,177 from Fairfield County, 2,789 from New Haven County, 1,915 from Hartford County, 672 in Windham, 638 New London, 613 Middlesex, 388 Litchfield, and 319 from Tolland County.  Last year’s total was 11,511 confirmed flu cases, with the number of cases peaking twice, in the week ending Jan. 12, predominantly Type A flu, and the week ending March 23, predominantly Type B.

All data for the current flu season are considered preliminary and are updated with available information each week starting in October and ending in May; a final report will be available from DPH before the start of the next season.


Pilot Project Boosts Voter Engagement in Latino Community

It turns out, all that was necessary to improve voter engagement and turnout was asking – and repeated, substantive, and informative reminders.  The results of a pilot study in Hartford’s Latino community may provide critical insight into how to improve voting levels in the state’s ethnic or urban communities, as the next election season beckons.

In 2012-13, the Hartford Votes~Hartford Vota Coalition conducted a Latino Voter Engagement Initiative with the support of a grant obtained by Hartford Public Library, a founding member of the Coalition.  The goal of the initiative was to increase historically low voter engagement in Hartford’s Latino community.  It did.

The initiative includevoted traditional voter registration activities, but because voter registration by itself tends not to result in higher voter engagement, additional activities were also included in the initiative.  Among them:  candidate forums, public programs on relevant topics, production and distribution of publications such as voter guides, canvassing portions of Hartford neighborhoods, conducting a reminder to vote campaign, and civics classes in Hartford high schools.

In addition, a number of meetings were held with leaders and others from Hartford’s Latino community.  None of the conversations or interactions were partisan.  They focused exclusively on the electoral process, the importance of exercising the right to vote, and providing basic information about public issues.  The results of the initiative were impressive:

  • Voter Registration:  392 Hartford Latinos were registered to vote.
  • Voter Information: 174 Hartford Latinos attended three candidate forums and two public programs.  Three publications were produced (Hartford Voters Guide, Citizens Guide, and Guide to the Hartford Board of Education) in English and Spanish and over 4,000 copies were distributed.
  • Voter Education: 124 Hartford Latinos participated in the neighborhood canvass; 172 Hartford Latino high school students attended civics classes.

According to a sample survey conducted at the end of the project, 44 percent of Hartford Latinos with whom program organizers interacted reported an increase in their voter engagement.  For example, they registered to vote, they voted, or they attended a candidate forum or public program related to major public issues during the project period.

Project organizers concluded that “we identified and demonstrated a successful strategy that can help address the very complex problem of low voter engagement (among Latinos 1_Percentage_Increaseand others):  people vote and get involved in greater numbers when they are encouraged to do so through face-to-face contact, and multiple contacts are more effective than single contacts.”

The neighborhood canvass produced especially notable results:

  • 54 percent of Latinos who were inactive voters (i.e., they had never voted before or were registered but had not voted in the 2008 and/or the 2010 elections) who participated in the neighborhood canvass reported that they voted in 2012 as a result of the interaction.
  • 64 percent of all Latinos who participated in the neighborhood canvass reported that they voted in 2012 as a result of the interaction.
  • Those who were spoken with twice voted at a rate 21 percent higher than those that only had one interaction
  • 2012 voter turnout among all people included in the neighborhood canvass was 9.1 percent higher than overall turnout in voting districts in which an informational canvass was conducted, and 6.7 percent higher than turnout citywide.

 In addition, thirteen high school civics classes were conducted in four different Hartford schools in May and June 2013, which were attended by 172 Latino students. According to evaluation forms completed by most of the students, 91 percent said the class helped them understand more about civics and 82 percent said they were more likely to vote or take action in their community as a result of having taken the class.  Comments ranged from “I made my voice heard through my vote” to “I didn’t do it for politics but because people motivated me.”

 The Hartford experience has been corroborated by similar research in Detroit and Arizona, according to project organizers.  The Coalition’s goal in 2014 is to secure resources that will enable it to ramp up the successful strategies identified through the pilot project and as a result have greater impact.

“Through these strategies,” they suggest, “we can play a significant role in reducing the effects of low voter engagement, which is a major threat to our democracy.”

Connecticut Ranks #48 in Federal Income Tax Refunds

Connecticut ranks #48 in the nation in income tax refunds its residents receive from the federal government.  Just over 11 percent of the taxes paid by state residents to the federal government are refunded to them, a percentage that is better than only the states of Delaware and Minnesota, and the District of Columbia.

By comparison, Mississippi residents receive more than three tbiggest tax refundsimes that percentage.  One third of the taxes paid by Mississippi residents – 34.84 percent – come back in refunds.  West Virginia residents receive 30 percent of the taxes they paid, South Carolina 26.27 percent and Alabama 26 percent.  Bloomberg.com reviewed Internal Revenue Service (IRS) data and ranked the 50 states and the District of Columbia based on the percentage of gross individual income taxes withheld or paid that were returned as refunds the following year.

Figures are for a five-year period: fiscal years 2007 through 2011 for tax collections and fiscal years 2008 through 2012 for refunds. For both collections and refunds, data include individual income tax withheld, individual income tax payments, FICA taxes, SECA taxes, unemployment insurance taxes, railroad retirement taxes and estate and trust income taxes. Refunds include interest.Tax-Refund

Connecticut’s gross total individual federal income tax collected between 2007 to 2011 was $206.31 million.  Total individual income tax refunded from the federal government between 2008 to 2012 was $23.56 million.  Joining Connecticut among the states with the lowest percentage refunded, in addition to Minnesota and Delaware, are Massachusetts, New Jersey, Ohio, New York and Nebraska. 


Connecticut Ranks Third Among Least Tax-Friendly for Retirees

“The Constitution State is a tax nightmare for many retirees.” That is the thumbnail summary for Connecticut, which ranked third among the 10 Least Tax-Friendly States for Retirees, according to a list compiled by the business and personal finance publication Kiplinger’s.

Worst in the nation, according to the list, is Rhode Island, followed by Vermont, Connecticut, Minnesota and Montana.  The publication used data from state tax departments, Commerce Clearing House and the Tax Foundation to develop the rankings. “Some states offer attractive tax benefits to woo retirees,” the publication indicated. “Then there are these ten states that are stingy with retirement tax breaks.”

Kiplinger’s pointed out that “Conneticut’s “real estate taxes are the second-highest in the nation, according to the Tax Foundation.”  Rhode Island was described as “particularly tough on retirees,” and retirees in Vermont should “prepare to pay lofty taxes,” according to Kiplinger.

  1. Rhode Islandtax friendly map
  2. Vermont
  3. Connecticut
  4. Minnesota
  5. Montana
  6. Oregon
  7. Nebraska
  8. California
  9. New Jersey
  10. New York

“When you're living on a fixed income, every penny counts, which makes these states particularly unwelcoming for retirees,” the publication noted.  Most of the states tax at least a portion of Social Security benefits. Some also have higher-than-average income taxes. Others make up for low income and sales taxes with high property taxes. The survey also considered  estate and  inheritance taxes.

The tax friendliest state for retirees is Alaska, which has no income tax, no sales tax and no inheritance tax. Alaska is followed by Wyoming, Georgia and Arizona.

Connecticut’s high cost of living —  more than 30% higher than the national average, according to Sperling’s Best Places.  However, “high prices and taxes don’t deter retirees who like the scenery and who want to stay close to children, grandchildren and lifelong friends in the nearby metropolitan areas,” according to MarketWatch, a service of the Wall Street Journal, published this week.  The data compiled by Kiplinger’s Senior Associate Editor was first reported last summer.

Kiplinger is a Washington, D.C.-based publisher of business forecasts and personal finance advice, available in print, online, audio, video and software products.  The company’s best-known publications are The Kiplinger Letter, a weekly business and economic forecasting periodical for people in management, and the monthly Kiplinger's Personal Finance magazine.

International Migration Growth Keeping Population Numbers Steady

The Hartford region ranked third in the nation among metropolitan areas showing significant international migration amidst near-stagnant overall population change during the past three years.  The New Haven-Milford and Norwich-New London regions also ranked in the top 20 nationally among metro regions with less than one percent overall population growth but strong international migration.

The overall population change for the three metro areas in Connecticut were two-tenths of a percent population growth in the Hartford region, and virtually no change at all for New Haven and Norwich-New London region, each having zero percent population growth over the past three years.

The migration into the Hartford region from outside the U.S. during the three years was 16,251 people, behind only to Chicago and Detroit among the 20 metro areas where overall population change was at or near zero.  The New Haven metro area ranked 7th, with an international migration total of 10,717 and Norwich – New London was 19th, with 4,008.

During the past three years, the Norwicworld-map-background1h-New London region total population change reflected a net loss of 95 people, New Haven had a net loss of 187 people and Hartford region saw a slight increase of 2, 827 people.migration

The analysis of U.S. Census data by Governing magazine indicates that in some American cities, international migration far outpaced population gains from natural change (births and deaths) and domestic migration.  The three Connecticut metropolitan areas were among those that experienced little to no change in total population, but welcomed sizable tallies of residents from abroad.

The analysis indicated 20 metro areas across the country where total population change between 2010 and 2013 was at or near zero, while international migration was substantial – and made up, or nearly made up, for population declines to due domestic migration or natural factors. Among the other metro regions were Providence, St. Louis, Cleveland, Springfield, Pittsburgh, Rochester, Buffalo and Trenton.

Across the U.S. between 2010 and 2013, metro areas welcomed a net total of 2.6 million residents from international migration. Over the same three-year period, net domestic migration increased by just 382,000 as those who did move mostly relocated to other metro areas, the magazine reported.

The Census Bureau’s international migration estimates include not only foreign immigrants, but natives moving back home and movement of members of the military.

The country’s largest immigration hubs welcomed significant numbers of residents from abroad. Since 2010, the New York City-Newark metro area gained nearly 400,000 residents from other countries, followed by the Miami-Fort Lauderdale-West Palm Beach, Fla., area (+164,000) and the Los Angeles-Long Beach-Anaheim (+156,000) area.

According to the data, Hartford lost 18,917 people to domestic migration while it picked up 16,251 people through international migration, nearly off-setting the departing over the past three years.

Connecticut Ranks #30 in Nation in Native Born Residents; Louisiana #1, Nevada Has Least

Just over half of Connecticut’s residents were born here, ranking the state 30th in the nation for the percentage of population who are native born.

Data from the U.S. Census Bureau’s American Community Survey, as analyzed by AARP, indicate that 55.2 percent of Connecticut residents were born in the Constitution State.   That places Connecticut fourth30 in New England, behind Massachusetts, Maine and Rhode Island.

The top 8 states with native born residents – all above 70 percent - are Louisiana, with 78.7 percent, followed by Michigan (76.7%), Ohio (75%), Pennsylvania (73.8%), Mississippi (72%), Iowa (71.6), Wisconsin (71.5%) and Alabama (70.2%).  The Rust Belt and Deep South generally had the highest percentages of resident born and raised in the states were they still live.

The lowest percentages of native born residents were in the states of Nevada (25%), Florida (35.7%), the District of Columbia (37%), Alaska (40.4%), New Hampshire (42%)  and Colorado (42%) .  The only Western state above 60 percent was Utah, at 61.8 percent.

In the tri-state region, native New Yorkers came in at 63.6 percent (ranked #18) and New Jersey at 52.6 percent, slightly lower than Connecticut.  Just one-tenth of a percent ahead of Connecticut was Georgia, with 55.3 percent.Born-in-the-USA

Just behind Connecticut in the rankings at #31 was California, with 54.5 percent of residents born in the state, and Hawaii, at 54.2 percent.

In thirteen states and Washington, D.C. – mostly in the West but also including Delaware (44.9%) and New Hampshire (42%) - less than half of residents are native sons and daughters.

1.       Louisiana78.7%

2.       Michigan 76.7%

3.       Ohio 75.0% 4.       Pennsylvania 73.8%

5.       Mississippi 72%

6.       Iowa 71.6%

7.       Wisconsin 71.5%

8.       Alabama 70.2%

9.       West Virginia 69.6%

10.   Kentucky 69.8%

11.   Indiana 68.4%

12.   Illinois 66.9%

13.   North Dakota 66.9%

14.   Missouri 66.6%

15.   Maine 65.2%

16.   Nebraska 65.1%

17.   South Dakota 64.4%

18.   New York 63.6%

19.   Massachusetts 63%

20.   Utah 61.8%

21.   Arkansas 61.5%

22.   Tennessee 61.4%

23.   Oklahoma 60.9%

24.   Texas 60.6%

25.   Kansas 59.4%

26.   Rhode Island 58.1%

27.   North Carolina 58%

28.   South Carolina 58.25

29.   Georgia 55.3%

30.   Connecticut 55.2%

31.   California 54.4%

32.   Hawaii 54.2%


Frequent Gamblers Prefer Atlantic City; Connecticut Casino Customers Satisfied As Competition Grows

A new study shows that the Atlantic City casinos continue to lead the way in attracting the gamblers who visit casinos most often, but Connecticut’s casinos are not far behind.  The review of players club members at casinos throughout the mid-Atlantic region reflects an industry becoming more competitive as frequent gamblers have more choices.  The study found that

Foxwoods- table

  • the region’s biggest gamblers are playing in Atlantic City, NJ
  • frequent gamblers at Connecticut's casinos bring more than $300 to gamble
  • gamblers frequenting upstate New York casinos have the lowest daily gaming budget in the Mid-Atlantic region
  • table gamblers generally have an average gambling budget of almost twice that of slots player,
  • 35-44 year olds bring the most gambling money to the casinos.

The casino markets included in the survey were New York, New Jersey, Pennsylvania, Connecticut, Delaware, Maryland and Massachusetts.  The survey, called Casino SCORES, conducted 3,000 interviews with individuals who live in one of the states, had made at least three visits to a casino in the region during the past year, and were members of at least one players club.

The study asked gamblers their average ddaily gamlingaily gaming budget when going to casinos in the  region. Of the 43 casinos evaluated in the study, the highest daily gaming budgets were among individuals that go to the Atlantic City casinos most often, followed by Foxwoods in Connecticut and Lady Luck Casino at Nemacolin Resort in Pennsylvania.

The top five average daily gaming budgets were:  Borgata Hotel Casino & Spa (Atlantic City), $478; Trump Taj Mahal (Atlantic City), $450; Golden Nugget (Atlantic City),  $444; Trump Plaza, (Atlantic City), $405; and Foxwoods Resort Casino (Connecticut), and Lady Luck Casino at Nemacolin (Pennsylvania), both at $388Mohegan Sun was further down the list at $324, but well above the majority of casinos.  The bottom five, all in New York, ranged from $205 down to $120 average daily individual gaming budgets.

The Average Daily Gaming Budget among those who said they play table games most often was $493, compared with $250 among those who responded that they play slots most often.

The survey also found that the 35-to-44 year old age bracket brings the most money with them to the casino they visit most often, compared with other age groups. 21 to 34 -  $334 35 to 44 - $359 45 to 64 - $308 65 and over - $288

Among those surveyed who had joined at least one casino's players club, 41 percent did so at an Atlantic City casino, 31 percent were members of Mohegan Players Club, and 25 percent joined Foxwoods Rewards.  Membership overlapped, as some individuals surveyed were members of more than one players program.

Competition To Retain, Attract Frequent Gamblers Intensifying

With Massachusetts moving forward with its  casino licensing process, the region will continue to see heightened competition in the coming years.  A new casino opened in Maryland last year, and two more are planned in the next three years.   The increasing competition is already having an impact on the revenue stream to the state in accordance with longstanding exclusivity agreements.  At the end of the fiscal year last summer, the two Connecticut casinos sent a total of $296.4 million to the state, a drop of almost $48 million from fiscal 2012.

Massachusetts’ regulators recently awarded a slot parlor license to Plainridge Racecourse which is just 20 miles from Twin River Casino in Lincoln, Rhode Island.  The Massachusetts gambling commission expects to award the license  for Western Massachusetts in May, with an MGM proposal for Springfield the only project left in the running after a Mohegan Sun proposal was defeated in a  local referendum in nearby Palmer. In addition, two proposals are competing for the license in the greater Boston region, Mohegan Sun in Revere and Wynn Resorts in Everett.

“As competition heats up, foxwoodskeeping and growing loyalty is going to be key,” said John Antonello, Managing Director of Travel and Leisure Entertainment for  Phoenix Marketing International (PMI).  “The more perks that are provided, the better.”  The trend is for loyalty programs to get “more sophisticated, so they can extend their reach,”   Antonello added.

Both Foxwoods and Mohegan Sun players club members indicated a “good level of satisfaction,” with the benefit program currently offered,” Antonello said, reflecting program elements including restaurant dining and shopping discounts, complementary hotel rooms on-site, reserved parking, VIP check-in and special gaming events.  Mohegan Sun, for example, offers three levels of benefits to cub members, Foxwoods offers five.

The data offered in the survey also includes cross-tabulations that indicate to which loyalty programs in other industries the club members at specific casinos belong  – which can provide individual casinos a road map suggesting which perks might be most attractive to their existing customers.  For example, 37 percent of Foxwoods club members are also members of Marriott Rewards, and one-third are members of airline prmohegan sunograms, such as Delta, American or JetBlue.  Those aspects of the survey are proprietary, and available to clients of Phoenix.

Antonello said that players club programs are rapidly evolving, and are reminiscent of the hotel loyalty programs of just over a decade ago, when they aggressively began adding new perks to retain customers amidst growing competition.  “Casinos are now looking for partnerships with other entertainment and travel companies as they go after a broader audience. The trend is to go beyond one industry,” he said.  Foxwoods Rewards partners program, for example, now includes discounts at businesses ranging from FTD Florist to Mystic Acquarium and the Connecticut Science Center.

Completed interviews were conducted in December 2013  in proportion to each state’s population and all counties within each state were represented.  Phoenix expects to repeat the survey later in the year.  Additional information is available at casinoscores@phoenixmi.com


Connecticut Ranked 45th in Population Growth Last Year; Births Outpaced Deaths, Net Loss from Migration

Connecticut’s population is estimated to have increased by 4,315 people during the past year, ranking the state 45th in the nation in population growth , according to the U.S. Census Bureau's population estimates program.

Only New Hampshire, New Mexico, Rhode Island, and Vermont added fewer residents.  Maine and West Virginia were the only states in the U.S. to lose population, by 199 and 2,376 respectively.  Connecticut’s population drop was one-tenth of one percent.

The largest overall population gain occurred in North Dakota (3.1 percent), the District of Columbia (2.1 percent), Utah (1.6 percent), Colorado and Texas (each 1.5 percent).

The data indicate that Connecticut ranked 44th in net domestic migration, losing 17,224 residents in 2013.  States losing more residents included, Ohio, Michigan, Pennsylvania, New Jersey, California, Illinois, and New York.  On the opposite end of the spectrum, the states achieving the largest net domestic migration were Texas (113,528), Florida (91,484), North Carolina (37,240), Colorado (36,284), South Carolina (29,324) aCensus Bureau Logond Arizona (26,417).

The numbers for international migration tell a different story.  California topped the list with a net gain of 123,217, followed by New York (101,778), Florida (99,454), Texas (64,187) and New Jersey (64,197).  Connecticut was just above the middle of the pack, with a net international migration gain of 15,702, ranking sixteenth.  Considering both domestic and international migration, Connecticut's net loss from migration was 2,076 people.

Connecticut saw 37,172 births and 29,249 deaths during the year, ranking the state 34th in births but 29th in the number of deaths.

The Census Bureau computes state population estimates using multiple data sets. Population estimates by state, current as of July of each year, include birth rates, death rates and estimates of residents migrating from one state to another, Governing magazine reported.

Connecticut’s population is estimated at 3,596,080, according to the U.S. Census.

Millionaires? Connecticut Ranks #3 in the Nation

If you’re looking for millionaires, you’re in the right neighborhood.  More than 6 million households in the United States have liquid assets worth more than $1 million, according to newly released estimates.  And the greatest concentrdollar signation of wealth in the United States is along the Interstate 95 corridor – including in Connecticut, which ranked #3 in the nation.

The state of Maryland has the highest percentage of millionaires in the U.S., the report by Phoenix Marketing International Global Wealth Monitor found, while New Jersey and Connecticut come in second and third.  In all three states, more than 7 percent of households have a net worth in excess of seven figures.  In Connecticut, 7.32 percent of households hold more than $1 million in assets, just behind 7.70 percent in Maryland 7.49 percent in New Jersey.

Connecticut moved up one slot, ranking fourth in last year’s survey.

Massachusetts, Virginia, New Hampshire, Delaware and the District of Columbia all landed in the top 10. Hawaii, where 7.18 percent of households hold more than $1 million in assets, and Alaska, with 6.75 percent of households, are the only two states outside the Northeast to wealthreach the top 10.

Those high-worth households control almost three-quarters of the liquid wealth in the United States, David Thompson, who rI-95uns the Phoenix Global Wealth Monitor, told the Washington Post.

States in the South make up the bulk of the bottom of the list. Fewer than 4 percent of households in Tennessee, Kentucky, West Virginia, Arkansas and Mississippi are worth $1 million or more. Just 3.76 percent of households in Idaho held more than $1 million in assets.

California ranked #11 and New York was #12.  Among the other New England states, Rhode Island was #17, Vermont #18, and Maine #25,  Maine had the second biggest jump among the states, moving up 11 places from a year ago.  North Dakota moved up 14 positions to #29.

The Global Wealth Monitor estimates the number of millionaires based on the Survey of Consumer Finance and Nielsen-Claritas data.

Connecticut Ranks #22 in Motor Vehicle Thefts; Rate Drops 3 Percent

Connecticut ranks #22 in the nation in motor vehicle thefts, with 238 thefts per 100,000 registered vehicles, a one-year drop of 3.3 percent, according to the most recent full-year data.

The District of Columbia had the greatest theft rate, with a total of 3,661 vehicles stolen and 322,350 registered vehicles in D.C.  That reflected a reduction in thefts of 18 percent in 2012 as compared with 201auto theft map
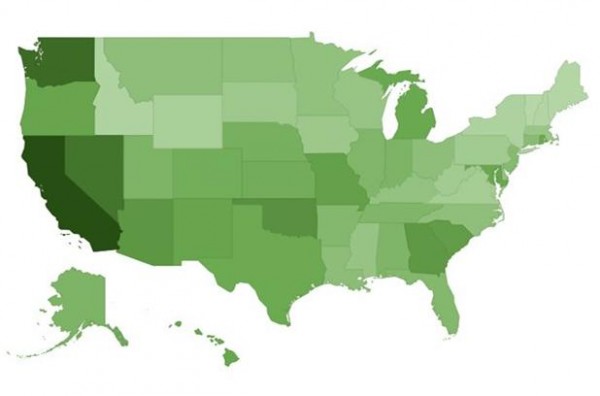
1, but still outdistanced all 50 states.

Rounding out the top 10 states with the highest rate of car thefts were California, Nevada, Washington, Maryland, Georgia, Arizona, South Carolina and Oklahoma.  Among the New England states, Rhode Island ranked #12, Massachusetts was #34, Maine was #47, New Hampshire was #49 and Vermont was #51, with 435 thefts and 606,941 registered vehicles – the lowest rate in the nation.

In Connecticut in 2012 there were 6,449 motor vehicle thefts.  The state has 2,706,459 registered vehicles.fbi-logo-large

The data was compiled by Bloomberg.com based on information from the Federal Bureau of Investigation (FBI) Uniform Crime Reports, and U.S. Department of Transportation Federal Highway Administration.

According to data compiled by the FBI and provided by the Criminal Justice Information Services Division:

  • There were an estimated 721,053 thefts of motor vehicles nationwide in 2012. The estimated rate of motor vehicle thefts was 229.7 per 100,000 inhabitants, placing Connecticut’s car theft rate  just above the national average.
  • The estimated number of motor vehicle thefts increased 0.6 percent in 2012 when compared with the 2011 estimates, but declined 24.8 percent when compared to the 2008 estimates, and 42.8 percent when compared to the 2003 estimates.
  • More than $4.3 billion was lost nationwide to motor vehicle thefts in 2012. The average dollar loss per stolen vehicle was $6,019.
  • In 2012, of all motor vehicles stolen, 73.9 percent were automobiles.