Hartford Region Ranks #4 in USA in Digital Coupon Clicking, Survey Says

Coupons are fast-becoming money savers that are clicked, not clipped, and in few regions is that more the trend than in Greater Hartford.  Newly released data indicates that the Hartford-West Hartford-East Hartford market ranks #4 in the nation in the level of click activity, just behind New York, Boston and Philadelphia. According to results of a survey conducted by RetailMeNot, a leading digital offers destination, in conjunction with The Omnibus Company, the number of Americans who rely mostly on mobile coupons has been steadily increasing, as traditional scissor-clipped declines.

The study found that over the past four years, the use of printable coupons has dropped to 58 percent in 2014 from 73 percent in 2010. However, digital coupon usage has increased substantially as the world has gone more digital with online (27% in 2014 vs. 16% in 2010) and mobile (15% in 2014 vs. 4% in 2010) coupon usage.DigitalCoupon1

The latest edition of the company’s Shoppers Trend Report revealed that nearly all Americans (96 percent) are coupon users, and retailers and brands are steadily moving their marketing promotions to more mobile and digital formats. A separate survey of retail executives in May 2014, also conducted by The Omnibus Company, found that 75 percent of retailers believe that digital advertising delivers a higher ROI than offline advertising, including circulars and direct mail.

September has been designated as National Coupon Month, and based on the level of coupon click activity in ratio with each city’s population, the Northeast is leading the way.  Rounding out the top ten after New York, Boston, Philadelphia and Hartford are Providence, Baltimore, Pittsburgh, Washington, Tampa and Buffalo.

Western communities appear to lag in their savings activity, with the Las Vegas, Phoenix and Denver areas representing the bottom of the active-coupon-user list. In fact, the New York, Boston and Philadelphia areas appear to be four times more active than the Denver area at couponing, according to survey analysts.

In the top 10 active couponing cities, clothing and food categories ranked consistently at the top for click activity, followed by electronics and home and garden.Coupon

“Our survey findings show how a consumer’s mobile phone is becoming a key device within their savings tool kit as millions of shoppers increasingly take advantage of digital offers, promotions and sales opportunities.” says Trae Bodge, senior lifestyle editor for The Real Deal by RetailMeNot.

They survey also found that printable coupon usage for 18- to 34-year-olds dropped significantly in the past four years (40% in 2014 vs. 57% in 2010), and online coupon usage nearly tripled for those ages 50+ over the past four years (18% in 2014 vs. 7% in 2010).

According to the survey deep discounts aren’t the only deals that shoppers appreciate, as more than 2 in 5 (43%) coupon users consider discounts up to 25 percent to be a good deal. Respondents said they are most interested in deals that offer a specific dollar amount off of their purchase (30%).  The survey also shows that interest in different types of deals varies by region.

  • Coupon users living in the Northeast are more likely than those living in other regions to be most interested in receiving a specific percentage off a purchase (28% vs. 18% of the rest of the country).
  • Those living in the South are more likely than those living elsewhere (26% vs. 15% of the rest of the country) to be most interested in “buy one, get one free” deals.

In an August 2014 commissioned study conducted by Forrester Consulting on behalf of RetailMeNot, an overwhelming 59 percent of respondents stated that out of all the different types of promotions a retailer can employ, digital coupons still sway them the most when it comes to influencing a purchasing decision. The study also found that:

  • 63 percent of respondents agreed that digital coupons “close the deal” for them when undecided on a purchase,
  • More than 90 percent of smartphone and tablet users redeem their digital coupons within several days,retailmenot_logo_lg
  • Nearly 7 in 10 consumers (68%) said they strongly believe that digital coupons have a positive impact on a retailer’s brand
  • 68 percent state that coupons generate loyalty

RetailMeNot, Inc. operates what the company describes as the world’s largest marketplace for digital offers, and for the 12 months ended June 30, 2014, the company had more than 625 million visits to its websites.  See the complete list of the top 50 cities.

Top Cities (and Surrounding Metro Areas) Based on Click Activity

  1. New York-Newark-Jersey City
  2. Boston-Cambridge-Newton
  3. Philadelphia-Camden-Wilmington
  4. Hartford-West Hartford-East Hartford
  5. Providence-Warwick
  6.  Baltimore-Columbia-Towson
  7.  Pittsburgh
  8. Washington-Arlington-Alexandria
  9. Tampa-St. Petersburg-Clearwater
  10. Buffalo-Cheektowaga-Niagara Falls

Danbury-Based Ethan Allen In Retail Industry’s Hot 100; Only CT Company Named

The lone Connecticut-based retailer to make the list of the Hot 100 Retailers produced by the National Retail Federation is Danbury-based Ethan Allen Interiors, sliding in at #97.  Data from the national advocacy organization indicates 5 percent growth and 208 locations nationwide for the chain. Ethan Allen Interiors Inc. (NYSE:ETH) is a leading interior design company and manufacturer and retailer of quality home furnishings. The company offers free interior design service to its clients and sells a full range of furniture products and decorative accessories through ethanallen.com and a network of approximately 300 Design Centers in the United States and abroad.logo natl retail fed

Ethan Allen owns and operates eight manufacturing facilities including five manufacturing plants and one sawmill in the United States plus one plant in each of Mexico and Honduras. Approximately seventy percent of its products are made in its North American plants. Chairman, President and CEO is M. Farooq Kathwari.He has been president since 1985 and Chairman and Chief Executive Officer since 1987.

The company website indicates that “Ethan Allen is full-service. We conceptualize, design, source, manufacture, market, advertise, style, sell, distribute, and install. That means at headquarters our horizons are ever broadening. But our job is surprisingly straightforward: that is, to raise the bar — in all aspects of the company every day.”

Overall in Connecticut, the Federation highlighted the importance of the retail industry on the state’s economy:Ethan-Allen-Interiors-Inc.-ETH

  • Retail directly and indirectly supports 1 in 5 Connecticut jobs.
  • Retail is directly and indirectly responsible for 16% of Connecticut's GDP.
  • Retail directly and indirectly generates 15% of labor income in Connecticut.
  • Retail supports 476,568 jobs in Connecticut. (see breakdown below)

Among Connecticut’s neighboring New England states, Boston-based Wayfair was the #2 retailer nationwide on the Hot 100; Jordan’s Furniture, based in Taunton, MA was ranked #24; C & J Clark, headquartered in Newton, MA was #29; and Framingham-based Cumberland Farms was ranked #62.  In addition, LL Bean (Freeport, Maine) was #94 and BJ’s Wholesale Club (Westborough, MA) rounded out the list at #100.

Breaking down Connecticut employment by retail sector, the Federation reported:port_retail-ethan-allen-6-b

  1. Retail trade (including food services and drinking places) 17.2%
  2. Health care and social assistance 14.8%
  3. Finance and insurance 9.8%
  4. Manufacturing 9.4%
  5. Professional, scientific, and technical services 8.2%
  6. Other services, except public administration 5.8%
  7. Construction 5.8%
  8. Administrative and waste services 5.7%
  9. Real estate and rental and licensing 5.6%
  10. Education services 3.9%

Nationally, the top 10 leading the Hot 100 in sales growth were Albertsons (Boise, Idaho), Wayfair, Ascena Retail Group (Suffern, NY), Conn’s (The Woodlands, Texas), SpartanNash (GrandRapids, MI), Michael Kors Holdings (New York), Under Armour (Baltimore), Cardinal Health (Dublin, Ohio), Five Below (Philadelphia), and Amazon.com (Seattle).  Each of the top 10 companies had sales growth exceeding 25 percent from 2012 to 2013.

The data for the Hot 100 report was provided by Kantar Retail for the National Retail Federation.

CT Ranks #3 in Millionaires, Behind Maryland and New Jersey

Connecticut had 100,754 millionaire residents last year, up from 99,235 in 2012, comprising 7.32 percent of the state’s 1.4 million households. Connecticut ranked third in the U.S. in millionaires per-capita, according to published reports. Maryland ranked in first place using the per-capita measurement and New Jersey placed second. Connecticut was ranked fourth in 2012, but moved up one slot by overtaking Hawaii.

In the midst of its oil boom, North Dakota was the leader at minting millionaires in 2013, moving to #29 in the Millionaire Ranking, up from #43 in 2012.  Other big gainers in 2013 were Maine (up 11 slots to #25) and Louisiana (up 10 points to #32).

Phoenix Marketing International, a global marketing slistingervices firm, develops the  annual ranking of millionaires per capita by state.  The results care culled from their Global Wealth Monitor, a service that tracks affluent and high net worth households.

Nevada lost the most ground in the 2013 Millionaire Ranking, falling 20 positions to #39.  Other big drops were Arizona (losing 13 positions to fall to #34); Florida, Michigan and Idaho each fell 10 positions on the list.

While Maryland continued to lead the list, there were some changes among the other top five states: New Jersey and Connecticut each moved up one spot (to #2 and 3 respectively), while Hawaii fell two places to #4.  Alaska moved into the top 5 for the first time, while Massachusetts moved down to #6.

Rounding out the top 12 were Virginia, New Hampshire, Delaware, District of Columbia, California and Nmillionaires per capita by state map_02ew York.  At the other end of the list, in reverse order from the bottom, were Mississippi, Arkansas, Idaho, West Virginia, Kentucky, and Tennessee – the states with the fewest millionaires per capita.

Nationwide, the number of American households with more than a million in assets has hit 9.6 million, according to the Spectrem Group, surpassing the pre-recession high of 9.2 million.


MetroHartford, Connecticut Have Strong Linguistic Diversity; Plus for Global Marketplace

The number of languages spoken in Connecticut is considerably larger than most people expect.  That fact was highlighted in the recent MetroHartford Progress Points Report, prepared for the MetroHartford Alliance.  The linguistic diversity and global connections of the region are reflected in schools and employers, with more than 100 different languages spoken in homes of students attending schools throughout the region, according to the report.progress points report The “number of students with non-English home language” according to data on the website of the
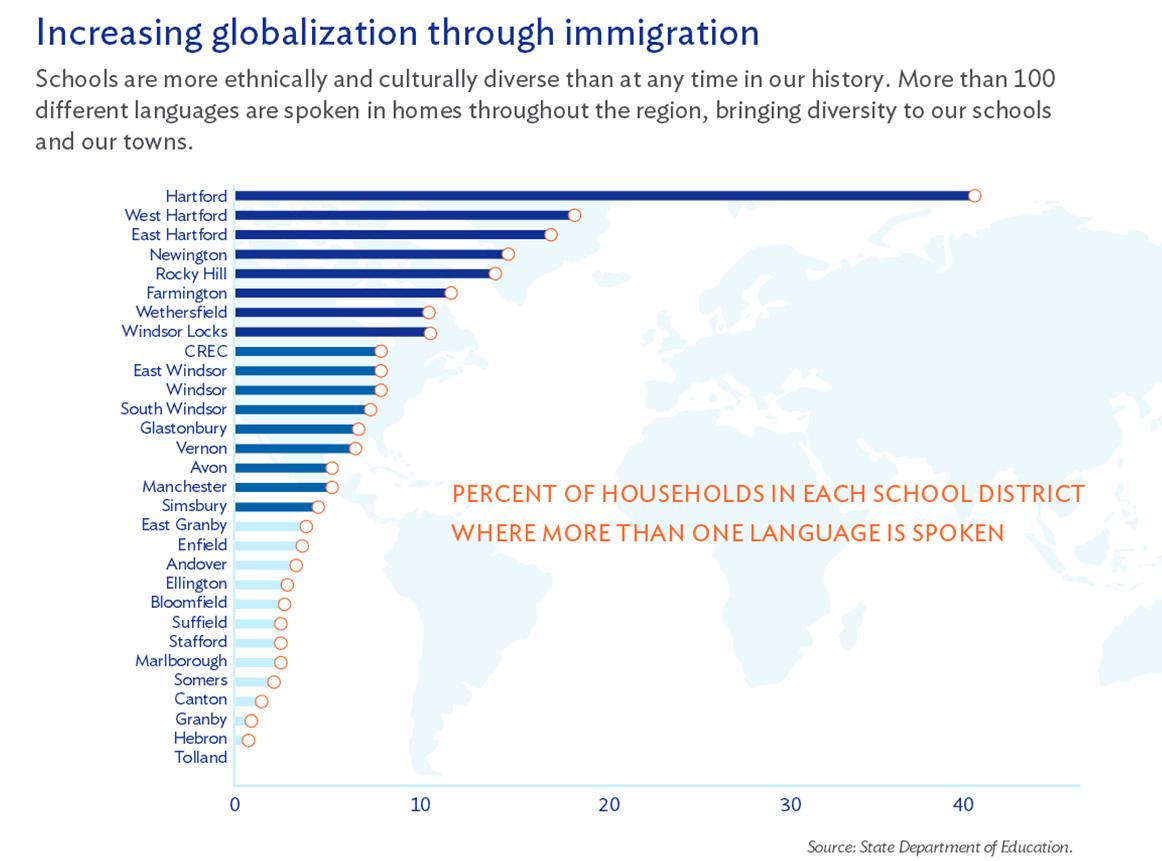
 State Department of Education include Avon, 185; Bloomfield, 59; East Hartford, 1,124; Farmington, 474; Hartford, 8,371; Manchester, 335; Newington, 653; Simsbury, 228; South Windsor, 328; Tolland, 14; West Hartford, 1,876; and Windsor, 280.  The report indicated that 75 percent of English language learner (ELL) students are Spanish-speaking, 25 percent speak other languages at home.

Some of the languages spoken in the homes of students attending schools in the region may be unexpected.  In Manchester, for example, the lead languages are Spanish, Bengali, and Urdu, and the list also includes Twi/Fante, Telugu, and Gujarati.

The Hartford region consists of 750,000 people living in the city of Hartford, its surrounding inner-ring suburbs, and outer-ring and rural towns that have historical, economic or social ties with the city.

In 2013, the Hartford Foundation for Public Giving gathered a group of regional stakeholders to develop a unique community partnership that came together to collect, analyze and disseminate a broad range of data, to place a spotlight on some of the central challenges and opportunities for the region. The goal was to share critical information “with residents and policymakers that will result in meaningful dialogue and propel action in our communities.”  Among the report’s areas of research is “increasing globalization through immigration,” using data from the state Department of Education (SDE).progresspointslogo

Sponsoring organizations of Metro Hartford Progress Points include Capital Workforce Partners, Trinity College’s Center for Urban and Cultural Studies, the Capitol Region Council of Governments, the Hartford Foundation for Public Giving, Hispanic Health Council, MetroHartford Alliance, United Way of Central and Northeastern Connecticut, Urban League of Greater Hartford and the City of Hartford.

Data on English-language learners and languages spoken in schools is based on reports retrieved from the SDE CEDAR Data Tables on English Language Learners, for both Number of English Language Learners (ELL) and Languages Spoken by Connecticut Students for the 2010-11 school year, the most recent data available.

Statewide, the variety of languages spoken by Connecticut students is considerable.  Nearly 73,000 students live in homes with a “non-English home language,” according to the State Department of Education. The leaders include:

  • Spanish                        47,190
  • Portuguese                  2,846
  • Polish                          2,279
  • Albanian                      1,263
  • Chinese                       2,215
  • Creole-Haitian             1,714
  • Arabic                         1,159
  • Vietnamese                 1,157
  • Urdu                            1,131
  • Russian                        811
  • French                         762
  • Gujarati                       738
  • Serbo-Croatian            705

For the uninitiated, Gujarātī is an Indo-Aryan language spoken by about 46 million people in the Indian states of Gujarat, Maharashtra, Rajasthan, Karnataka and Madhya Pradesh, and also in Bangladesh, Fiji, Kenya, Malawi, Mauritius, Oman, Pakistan, Réunion, Singapore, South Africa, Tanzania, Uganda, United Kingdom, USA, Zambia and Zimbabwe.  And, apparently, Connecticut - in the homes of 738 slanguages spokentudents.

Close to 100 million people around the world speak Urdu. It is the official language of Pakistan, a status and is also spoken and understood in parts of India, Bangladesh, Nepal, the Middle East.

The Progress Points partners include: Capital Workforce Partners, Capitol Region Council of Governments, City of Hartford, Hartford Foundation for Public Giving, Hispanic Health Council, MetroHartford Alliance, Trinity College Center for Urban and Global Studies, United Way of Central and Northeastern Connecticut , and the Urban League of Greater Hartford.

https://www.youtube.com/watch?feature=player_embedded&v=0zTQjsbNlw0

Immigration Reform: Economic Impact in Connecticut

As the fate of immigration reform remains unresolved in Congress, plays out on the nation’s borders, and is debated  in states around the country - including Connecticut -  the potential economic benefits remain an element in the debate.  Connecticut-centric data seeks to provide local context as a new national immigration policy is considered and stalled and considered again in Washington, D.C. Some highlights, as released by the White House, point out that immigration reform will “strengthen Connecticut’s economy and creates jobs.”  Some of the data points that have been part of the past year's debate:

• Immigrants alreaImmigration-reformdy make important contributions to Connecticut’s economy. For example, Connecticut’s labor force is 16.7% foreign-born.

• 18.5% of Connecticut business owners are immigrants. These businessmen and women generate $2.05 billion in income for Connecticut each year.

• In Connecticut, 38.2% of science, technology, engineering, and math (STEM) graduates at the state’s most research-intensive schools are foreign-born. Also, 68.2% of the state’s engineering PhDs are foreign-born.

• According to Regional Economic Models, Inc., a set of reforms that provides a pathway to earned citizenship and expands a high-skilled and other temporary worker programs would together boost Connecticut’s economic output by $568 million and create approximately 6,904 new jobs in 2014.  By 2045, the boost to Connecticut’s economic output would be around $3 billion, in 2012 dollars.

The White House has also indicated that “common sense immigration reform increases workers’ income, resulting in new state and local tax revenue, contribute to the recovery of Connecticut’s housing market and strengthen Connecticut’s technology, agriculture, and tourism industries:

• Providing a pathway to earned citizenship and expanding high- and low-skilled visa programs will increase total personal income for Connecticut families by $1.6 billion in 2020, according to Regional Economic Models, Inc.

•  Immigration reform would have increased the state and local taxes paid by immigrants in Connecticut by approximately $29 million in 2010, according to one study.

• Immigrants significantly increased home values in Connecticut between 2000 and 2010 - in New Haven County, the increase was $2,680 for the median home.

• There are 4,916 farms in Connecticut that sell approximately $552 million in agricultural products. Noncitizen farm workers accounted for 24% of all farm workers in Connecticut between 2007 and 2011. According to one study, in 2020 an expanded temporary worker program would mean 264 new jobs for U.S. citizens and immigrants (including jobs not only in agriculture, but also retail trade, construction, and other sectors) in Connecticut, and increase Connecticut’s real personal income by $15 million in 2012 dollars.

• These provisions will increase tourism to the U.S., including to Connecticut - which saw approximately 307,000 overseas visitors in 2011.

An August 2014 poll by FOX News found that by a more than three-to-one margin, voters nationwide would pick immigration reform that only includes a pathway to citizenship over no Congressional action at all.  The  poll finds 65 percent of voters prefer legislation that only focuses on creating a pathway for certain illegal immigrants if that’s the only action Congress takes on immigration this year.   The survey also found substantial bipartisan agreement on the issue: 76 percent of Democrats and 56 percent of Republicans say something is better than nothing on immigration reform, and 60 percent of independents agree, FOX News reported.

Fraud Watch Aims to Limit Costly Scams Targeting Elderly

Connecticut state agencies are collaborating, in concert with private sector organizations, to protect senior citizens from elder abuse.  In issuing an Executive Order, Governor Malloy directed agencies to identify ways to increase public awareness, reporting and social network support of elder abuse victims, consider ways to improve programs for elder abuse victims, and identify best practices in elder abuse prevention, detection and intervention. Recent surveys by AARP underscore the susceptibility of seniors to identity theft and fraud, reporting that seniors were likely to have engaged in behaviors including:fraud

  • Clicked on pop-up ads – 26 percent of victims and 10 percent of non-victims said they had done so in the previous seven days;
  • Opened an email from an unknown person – 27 percent of victims and 17 percent of non-victims said they had done so in the past seven days;
  • Signed up for free trial offers – 18 percent of victims and 8 percent of non-victims had done so in the previous week.

Fraud victims were also found to have experienced the following life experiences, which may have impacted the susceptibility statistics cited:

  • Sixty-six percent of victims and 42 percent of non-victims said they “often or sometimes feel isolated.”
  • Twenty-three percent of victims and 10 percent of non-victims said they had experienced loss of a job.
  • Forty-four percent of victims and 23 percent of non-victims said they had suffered a “negative change in financial status” in the past two years. fraud watch

Connecticut AARP is a member of the state’s Elder Justice Coalition Coordinating Council, which convened this summer, and one of the 16 agencies appointed by the Commissioner of the State Department on Aging to work on elder justice issues.  AARP is leading the Consumer Fraud Education workgroup which has hit the ground running with the recent launch of the AARP Fraud Watch Network – a national campaign that connects people to experts, law enforcement and people like them who can help them spot and avoid scams.

As part of the CT Elder Justice Coalition, AARP Connecticut is working with state, federal and community organizations across the state utilizing Fraud Watch Network resources to educate older adults and their families about scams and provide tools and information to prevent identity theft and fraud.

Fairfield Chief of Police, Gary MacNamara, representing the CT Police Chiefs Association and a member of the CT Elder Justice Coalition, stated, “Police officers understand efforts to prevent our community members from being victims is really important.  The first step in prevention is awareness.  The AARP Fraud Watch Network provides a great place for older adults and families to get accurate information and become aware of the threat.”seniorlady-570x230

Last fall, a survey of nearly 2,400 U.S. adults age 40 and older conducted by the FINRA Foundation revealed that financial fraud solicitations are commonplace.  Many Americans are unable to spot fraudulent sales pitches, and older Americans (age 65 and older) are particularly vulnerable.

Specific findings include:

  • Over 80 percent of respondents have been solicited to participate in potentially fraudulent schemes, and over 40 percent of those surveyed cannot identify some classic red flags of fraud.
  • More than 8 in 10 respondents were solicited to participate in a potentially fraudulent offer. And 11 percent of all respondents lost a significant amount of money after engaging with an offer.
  • More than 4 in 10 respondents found an annual return of 110 percent for an investment appealing, and 43 percent found "fully guaranteed" investments to be appealing.
  • Americans age 65 and older are more likely to be targeted by fraudsters and more likely to lose money once targeted.

According to AARP volunteer and Executive Council member, Byron Peterson, “Identity theft, investment fraud and scams rob hard-working Americans of billions of dollars each year – with older adults often the biggest targets.  Through the AARP Fraud Watch Network, we’re arming people with information about what makes them vulnerable and giving them access to the tools they need to outsmart con artists before they strike.”AARP

The FINRA Foundation's survey found that 64 percent of those surveyed had been invited to an "educational" investment meeting that was likely a sales pitch. Additionally, 67 percent of respondents said they had received an email from another country offering a large amount of money in exchange for an initial deposit or fee. Upon being solicited for fraud, older respondents were 34% more likely to lose money than respondents in their forties.

In collaboration with partner agencies and organizations, AARP staff and volunteers are making fraud prevention presentations to community groups and encouraging all residents to sign up for watchdog alerts and stay abreast of current scams through the AARP Fraud Watch Network.  Available free of charge to AARP members and non-members alike, and people of any age, the Fraud Watch Network provides an array of educational information and access to individuals who share experiences and provide expertise.

CT's Population Remarkably Stable for a Century, Data Shows

Connecticut’s nickname as the Land of Steady Habits, is well-earned, as evidenced by a review of population origin during the past century.   Connecticut's domestic migration pattern has been remarkably steady through the decades, and most of the change has been due to immigration, according to data compiled by The New York Times. The hundred year comparison:  In 1900, 57 percent of the state’s residents were born in Connecticut.  A century later, in 2000, a nearly identical 55 percent of the state’s pCT bornopulation was born in Connecticut.

The percentage of Connecticut residents born outside the United States was as high as 29 percent in 1910, steadily declined to a low of 10 percent in 1970 and 9 percent in 1980 and 1990, and then began to slowly climb, reaching 11 percent in 2000 and 14 percent in 2012.

The breakdown of Connecticut’s population origins, between 1900 and 2012, as reported in The New York Times, is currently:

  • 55 percent born in Connecticut,
  • 14 percent born outside the U.S.
  • 10 percent born in New York,
  • 6 percent born in other states in the Northeast,
  • 4 percent born in Massachusetts,
  • 4 percent born in states in the South,
  • 3 percent born in other U.S. states (excluding the Northeast, South and Midwest),
  • 3 percent born in Midwest states,
  • 2 percent born in states in the Western U.S.

In 1900 and 2000, four percent of the state’s residents were born in neighboring Massachusetts.

By way of comparison, the percentage of Massachusetts’ population born in the Bay State was 55 percent in 1900 and 63 percent in 2012.  In New Hampshire the percentage of native born was 60 percent in 1900 and 42 percent in 2012 – when one quarter of the population, a robust 25 percent, were born in neighboring Massachusetts.  In Rhode Island, the population was 51 percent native born in 1900 and 57 percent in 2012.  Only 9 percent of Rhode Island’s recent population was born in Massachusetts.

The states with the lowest percentage of their population born in-state are Nevada, 25 percent; Florida, 36 percent; Arizona, 38 percent; Wyoming, 40 percent; and Alaska, 42 percent.

On the opposite end of the spectrum, 79 percent of Louisiana’s population was born in the state; 77 percent of Michigan’s; 75 percent of Ohio’s and 74 percent of Pennsylvania’s.

The largest immigrant population, by percentage?  California at 28 percent, New York at 25 percent, Florida at 23 percent and Nevada at 21 percent.

An interactive feature highlights the state-by-state data on the Times website.USA map

Pay Equity Gap Between Men and Women Begins As Children, Studies Show

The stubborn pay equity gap between men and women – larger in Connecticut than some neighboring states – apparently has its roots in childhood. National surveys indicate that parents are more likely to give their sons an allowance than their daughters. Among all young people surveyed, 67 percent of boys compared with 59 percent of girls say they get an allowance from their parents, according to Junior Achievement USA® (JA) and The Allstate Foundation’s 2014 Teens & Personal Finance Survey.allowance hand

A study by the University of Michigan Institute for Social Research found that girls do two more hours of housework a week than boys, while boys spend twice as much time playing. The same study confirmed that boys are still more likely to get paid for what they do: they are 15 percent more likely to get an allowance for doing chores than girls.  Study Director Frank Stafford indicated that the trend continues into adulthood. allowance graphic

Writing this month in the National Journal, Connecticut Congresswoman Rosa DeLauro pointed out that “right now, women make less than men in nearly every occupation for which wage data are tracked. One year out of college, women are paid 18 percent less than their male counterparts. Ten years out of college, the wage gap leaves women earning 31 percent less.  Over a 35-year career, these earnings discrepancies swell to exceedingly large sums. Across the entire workforce, the average career-long pay gap is $434,000. For college-educated women, the pay deficit averages $654,000.”

Earlier this year, CT Mirror reported that “women in Connecticut earn about 78 percent of what men make.  Numbers from the 2012 Census show that Connecticut's gender wage gap is wider than in many other states in the Northeast; and that, within the state, the gender difference varies as well. The most pronounced gap…is in Fairfield County.”

In a November 2013 report, the Governor’s Gender Wage Gap Task Force indicated that “Connecticut still has a long way to go before the gender wage gap is eliminated.”  The 14-member task force found that that “more mothers than ever before are the sole or primary breadwinners of their families. Yet, women in Connecticut are more likely than men to live in poverty and below the self-sufficiency standard. 24% of households in Connecticut headed by women with children fall below the federal poverty level. Eliminating the wage gap would provide critical income to these families.”

The report also indicated that “among all full-time, year-round workers, Connecticut women earn, on average, 22%-24.2%less than men. This gap is even more pronounced among minority women. Understanding this inequity is not a simple matter. Many factors contribute to the overall wage gap including education and skills, experience, union membership, training, performance, hours worked and the careers women and men choose. However, even after these factors are controlled for, an estimated wage gap of 5-10% remains.”

In 2012, the National Partnership for Women and Families reported that “If the wage gap were eliminated, a working woman in Connecticut would have enough money for approximately:

  • 109 more weeks of food
  • 7 more months of mortgage and utilities payments
  • 14 more months of rent
  • 44 more months of family health insurance premiums
  • 3,410 additional gallons of gas

The Connecticut Task Force issued a series of recommendations to address the pay equity gap, focused on current workplaces, businesses, training and education.  Apparently, efforts need to begin sooner, when youngsters begin household chores and ask for an allowance.

gender gap map

CT Women Underrepresented Among Top Earners; 4th Widest Gap in US

In only three states in the nation are women more underrepresented among the top 1 percent of wage owners, when compared with the state’s overall female population. Connecticut ranks 4th – after South Dakota, New Hampshire and Wyoming – in underrepresentation of women among the top earners in the state. Connecticut has a ratio of 6 men for every woman in the state’s top 1 percent of wage earners. South Dakota has the widest gap and largest ratio, at 8.2.

In Connecticut, 51.3 percent of the state’s population is female, yet only 14.4 percent of the top 1 percent of wage earners in the state are women. That is a gap of 36.9 percent, ranking the state fouTheOnePercentrth.  In Wyoming the gap is 37.1 percent, in New Hampshire 38.6 percent, and in South Dakota, 39 percent. In South Dakota, with the widest gap, only 10.9 percent of the wage earners in the top one percent are women.

On the other end of the spectrum, the gap in Delaware is 10.6 percent, in Hawaii 16.8 percent, Rhode Island 17.8 percent and Vermont 21.7 percent. The ratio of males to females among the top one percent earners is 1.4 in Delaware, 2.0 in Hawaii, 1.9 in Rhode Island and 2.5 in Vermont, compared with Connecticut’s 6.0.

Bloomberg ranked the U.S. states and the District of Columbia on the extent to which females are underrepresented in the 1% income bracket, utilizing U.S. Census data.

Connecticut also had the nation’s second highest threshold income to gain entry into the one percent club, at $429,793. Only Alaska, at $500,052 was higher. Just slightly lower than Connecticut was the District of Columbia, New York, New Jersey, North Dakota and Minnesota ($387, 414). At the opposite end of the states tally was Wyoming, with an income of $244,207 placing individuals in the state’s top one percent of earners.

In the percentage of women in the overall population, Connecticut ranked 10th, at 51.3 percent. Only 10 states have more men than women in their population. Alaska has the highest percentage of men, at 52.1, and the District of Columbia the highest percentage of women, at 52.7. Following closely behind are Rhode Island and Mississippi, both with 51.7 percent of their population being female.

Using data from the U.S. Census, Bloomberg calculated the approximate 99th percentile, or top 1%, of inflation-adjusted wage or salary income figures for those ages 16 and older and employed. Gender information was extracted and the gap between the percentage of females in the 1% bracket and the percentage of females in the state's population was calculated.

Hartford Region Improves Among Nation's Best Performing Cities in 2013

The Hartford region was the state’s only metropolitan area to improve its ranking relative to other metropolitan areas around the country in an analysis of job growth and regional economic factors in 2013 that ranked the nation’s top 200 Best Performing Cities. The top ranked Connecticut metropolitan area was Hartford-West Hartford-East Hartford, which ranked #85 among the nation’s top 200, an improvement in ranking from #93 the previous year.state map

Connecticut’s other major metro areas dropped in the rankings: Bridgeport-Stamford-Norwalk dropped to #106 from #94 in 2012, New Haven-Milford fell to #142 from #109 , and Norwich-New London ranked #187, falling from #152 the previous year.

Best Performing Cities Index Report (PDF)The 2013 Milken Institute Best-Performing Cities Index ranks U.S. metropolitan areas by how well they are creating and sustaining jobs and economic growth. The components include job, wage and salary, and technology growth.

Topping the list of Large Cities were Austin-Round Rock–San Marcos, Texas and Provo-Orem, Utah followed by San Francisco-San Mateo-Redwood City, CA, San Jose-Sunnyvale-Santa Clara, CA and Salt Lake City, UT. Rounding out the top 10 were the metropolitan areas of Seattle, Dallas, Houston, Boulder, and Greeley, CO.

Biggest gainers on the list include Hagerstown-Martinsburg, Md.-W.V. (70th, up 100 slots); Tulsa, Okla., (42nd, up from 118th), and Phoenix, (66th, up from 122nd). Within the top 25 metro areas, Texas claimed seven spots; Colorado and California each had four.

The website interactive features offer a means of comparing cities in the various economic factors.  In most years, according to the study authors, the factors evaluated in the index give a good indication of the underlying structural performance of regional economics.

A nonprofit, nonpartisan economic think tank, the Milken Institute works to improve lives around the world by advancing innovative economic and policy solutions that create jobs, widen access to capital, and enhance health.