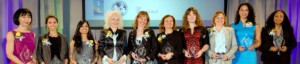
Fifty-six women, from across Connecticut, were honored for their innovation and leadership during the eleventh annual Women of Innovation awards gala, held this week. This awards program recognized women innovators, role models and leaders in the fields of science, technology, engineering, and math as well as outstanding women at the high school and collegiate level.
“The Council is honored to recognize Connecticut’s most extraordinary and talented women representing a cross section of the state’s most important technology companies and educational institutions.” said Bruce Carlson, President and CEO of the Connecticut Technology Council.
Of the 56 women honored, 10 we re recognized as category winners; there are two winners in both the Research and Collegian categories: Academic Innovation and Leadership: Medria Blue-Ellis, Principal, Engineering & Science University Magnet School; Collegian Innovation and Leadership (two winners): Sapna Gupta, Ph.D. Student, University of Connecticut, Monika Weber, Ph.D. Student, Yale University; Community Innovation and Leadership: Keshia Ashe, Co-Founder & CEO, ManyMentors; Entrepreneurial Innovation and Leadership: Christina Lampe-Onnerud, Founder & CEO, CLOTEAM LLC; Large Business Innovation & Leadership: Yu-Hui Rogers, Site Director, The Jackson Laboratory for Genomic Medicine; Research Innovation and Leadership (2 winners): Serap Aksoy, Professor, Yale School of Public Health, Radenka Maric, Connecticut Clean Energy Professor in Sustainable Energy, University of Connecticut; Small Business Innovation and Leadership: Lisa Braden-Harder, CEO, Appen; and Youth Innovation and Leadership: Anubhuti Mathur, High School Student, Glastonbury High Sch
 ool.
ool.
Presenting sponsors of this year’s event, held at the AquaTurf in Plainville, were Boehringer Ingelheim USA Corporation, Covidien, Day Pitney LLP, and United Technologies Corporation.
Efforts to interest girls in the STEM fields are underway elsewhere in Connecticut as well. UIL Holdings Corporation is among the organizations encouraging girls to pursue careers in science, technology, engineering and math (STEM) by supporting three Generating Girls Opportunities (G2O) Expos.
 These expos offer girls exposure to STEM fields, as well as the opportunity to participate in hands-on experiments. The next G2O Girls & STEM Expo to be held April 10 at Central Connecticut State University. It is a half-day interactive event for 9th and 10th grade girls introducing participants to all the possibilities of STEM (Science, Technology, Engineering & Math) through workshops and activities led by college professors and STEM professionals.
Activities are designed to inspire girls to question, create, design, test, explore, and more! They learn about possible STEM careers and talk to colleges and employers to help them plan for the future. The expos, organized by the Connecticut Women’s Education and Legal Fund (CWEALF), are designed to engage the students and teachers in expanding educational opportunities in STEM programs and careers.
A study commissioned by the Girl Scout Research Institute found that girls are interested in STEM fields and aspire to STEM careers, but need more exposure and adult support to carry this interest into the future. Additional expos will be held in West Hartford at the University of Saint Joseph on May 4 and at Mitchell College in New London on June 5.
The Connecticut Technology Council (www.ct.org), which organizes the annual Women of Innovation, is Connecticut’s industry association for the technology sector. CTC’s mission is to connect people, ideas and opportunities to the global technology and innovation community.
________________________________________
 2015 Women of Innovation
Medria Blue-Ellis is the principal of ESUMS, a Magnet School of Excellence and CT School of Distinction. Her Curriculum expertise, creative thinking, and persistence are shared with the female STEM teachers she mentors. Her encouragement of female students to excel in STEM manifests in accomplishments such as the 2014 Verizon App Challenge State Finalist. Medria was one of 100 school leaders, educational advocates, and researches convened at the Jack Kent Cooke Foundation “Closing the Excellence Gap” conference.
Sapna Gupta is a graduate research assistant at the Center for Clean Energy Engineering and a Ph.D. candidate in materials science and engineering at UCONN. Sapna’s academic achievements, innovative research and creativity are evident in the many fellowships, distinctions, and awards she has received, including her honorable mention for the 2014 Baker Student Researcher award. She is founder and president of UCONN Keramos, and delegate of the ACerS PCSA
Monika Weber is a Ph.D. candidate in electrical engineering at Yale University and the co-inventor of Fluid-Screen, a small device that detects bacteria in 30 minutes. She has won the Grand Prize in the NASA “Create the Future” Design Contest 2011” and the Gold Prize in MassChallenge and received over $200,000 in technology and entrepreneurial awards. Monika combines leadership skills with strong technical expertise, creativity and business acumen.
Keshia Ashe is a Ph.D. candidate in chemical engineering at UCONN and co-founder and CEO of ManyMentors. ManyMentors is a STEM online and in-person mentoring nonprofit organization that connects university mentors with middle and high school students interested in STEM degrees and careers. She is a mentor, role model, TEDx speaker, and an unwavering advocate for STEM education in Connecticut.
Christina Lampe-Onnerud is known for her innovative work developing high-performance, low-cost, safe, environmentally-friendly batteries for portable electronics, electric vehicles and energy storage. She is founder of Boston-Power (IPO in 2016) and CLOTEAM, as well as holder of 80+ patents and author of numerous scientific articles. She was recognized as a Technology Pioneer by the World Economic Forum where she serves as an advisor on global innovation and renewable transport.
Yu-Hui Rogers is leading the JAX-GM Administration and Operation Team in establishing its new research institute in Connecticut. She was the vice president of Core Technology Development at the J. Craig Venter Institute where she was responsible for technology development and a large-scale genomic operation. She was instrumental in the development and implementation of a high-throughput sequencing pipeline that enabled the completion of the first human genome sequence at Celera Genomics.
Serap Aksoy is a professor at the Yale School of Public Health where she works on insects that transmit disease-causing microbes to animals and plants. She lectures internationally, maintains ongoing collaborative research programs, and has made landmark contributions to the functional and evolutionary aspects of insect-microbe interactions. Through her discoveries, she developed innovative methods that use beneficial bacteria to render insects inhospitable for disease-causing pathogens, thereby reducing their disease transmission potential.
Radenka Maric joined UCONN in 2010, where she focuses on developing new materials and novel structures for energy storage and conversion, structural ceramics and hydrogen production and separation. Previously, she was group leader and program manager at the National Research Council of Canada’s Institute for Fuel Cell Innovation, program manager at nGimat and senior scientist/team ILeader at the Japan Fine Ceramics Center in Japan. Radenka has published over 150 scientific papers.
Lisa Braden-Harder started her career in IBM’s research division, moving on to found the Butler Hill Group in 1993. There, she leveraged her background in linguistic products ranging from grammar checkers to search engines. In 2011, the company merged with Appen, an Australian company also engaged in taking devices to global markets. In 2013, she became CEO of the combined entity and in January 2015, led the company through an IPO on the Australian stock exchange.
Anabhuti Mathur conducts research at the UCONN Health Center and was a 2014 summer student fellow at The Jackson Laboratory. She was an Intel ISEF finalist, American Chemical Society award winner, National JSHS State Representative, Chemistry Olympiad Semifinalist, and the Anna Harrison award winner for top female scorer. Anubhuti captains Glastonbury’s Debate and Science Bowl teams, is president of the Medical Leaders Club, and runs a charitable multicultural dance organization.


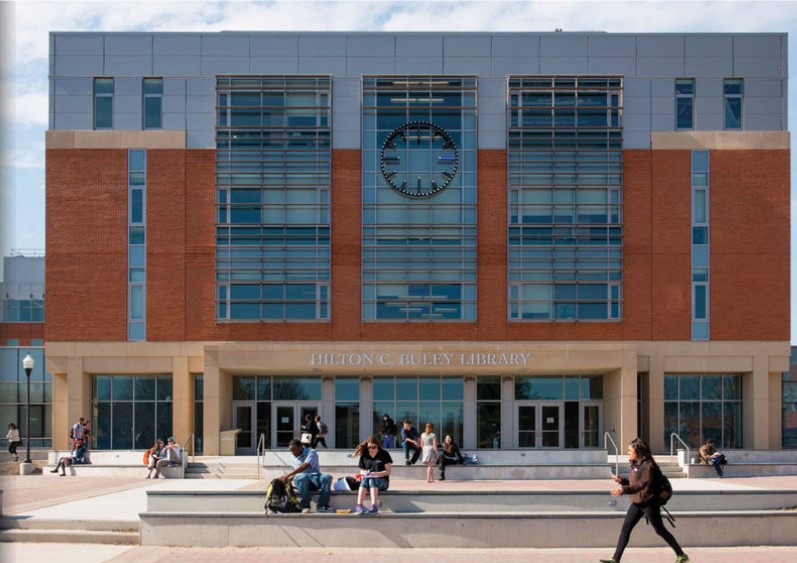 At Southern Connecticut State University in New Haven, students now have a first-rate, 21st century library in which to study, conduct research and meet with their friends and classmates, the university announced this week. A ribbon-cutting ceremony to mark the opening of the “new” Buley Library was held April 20. The event marked the completion of the $31 million project that renovated the original wing of the building. A 12,000-square-foot area that will serve as an atrium has been added to the older 98,000-square-foot wing as part of the project. When combined with the 135,000-square-foot addition that was completed in 2008, the library now encompasses 245,000 square feet.
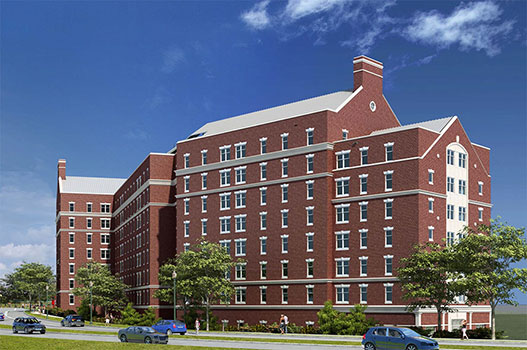 At Central Connecticut State University in New Britain, there is a Fall 2015 target date for completion of a new on-campus residence hall and food services dining facility. That will follow by just two years the opening of a major new classroom building on the CCSU campus. The four-story academic building houses classes and faculty offices for the sociology, history, anthropology, geography and political science departments, according to university officials. It includes 17 classrooms, five seminar rooms, seven labs and 71 offices for faculty and administrators. Now completing construction at the corner of Harold Lewis Drive and Ella Grasso Boulevard, the new $82.3 million, eight-story 220,000 square foot residence hall "will keep CCSU in the vanguard of higher education in operations and facilities," points out CCSU President Jack Miller, noting its ideal fit into the university's strategic plan for the recruitment and retention of new students.
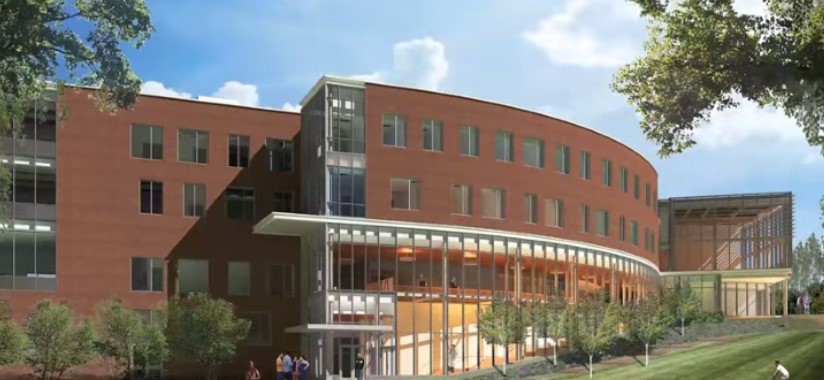 Opening this fall on the campus of Eastern Connecticut State University in Willimantic is a Fine Arts Instructional Center - a 118,000 square foot building that will contain three main performance venues; an auditorium; a procenium theater and a black box theater. In addition to the performance spaces there will be instructional labs and other spaces in support of the Performing Arts Department. There will be design studios for the Visual Arts Department including Printmaking, Sculpture, Painting and Drawing. The building will also have three general purpose classrooms and a gallery. Construction has been underway for the past two years.
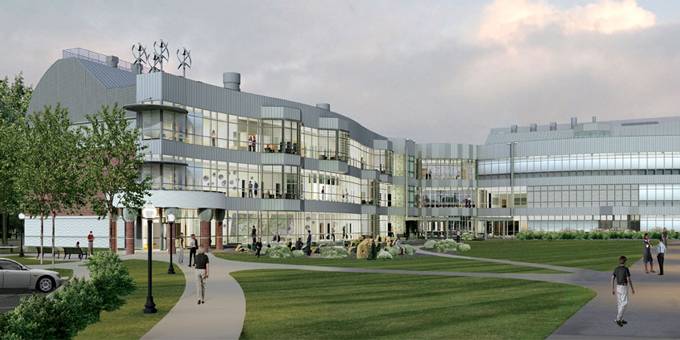 The next major opening among the CSCU institutions will likely be a Science and Laboratory Building at Southern Connecticut, due later this year. Southern's ongoing expansion of its science programs will be greatly enhanced with the construction of a 103,608-square-foot, four-level academic and laboratory science building. Situated adjacent to Jennings Hall, the current home for the sciences, the new building will enhance the ongoing expansion of Southern’s science programs and the university’s capacity to educate more students in the STEM disciplines – science, technology, engineering and mathematics.

 Gary Shapiro, president and CEO of CEA, said “The future of growth and economic prosperity in this country is most vibrant in places where policies and political climates serve to unleash the entrepreneurial spirit and can-do attitude that is part of our American DNA. Our hope is that states will use our Scorecard as a measurable guidepost to improve their policies supporting innovation.”
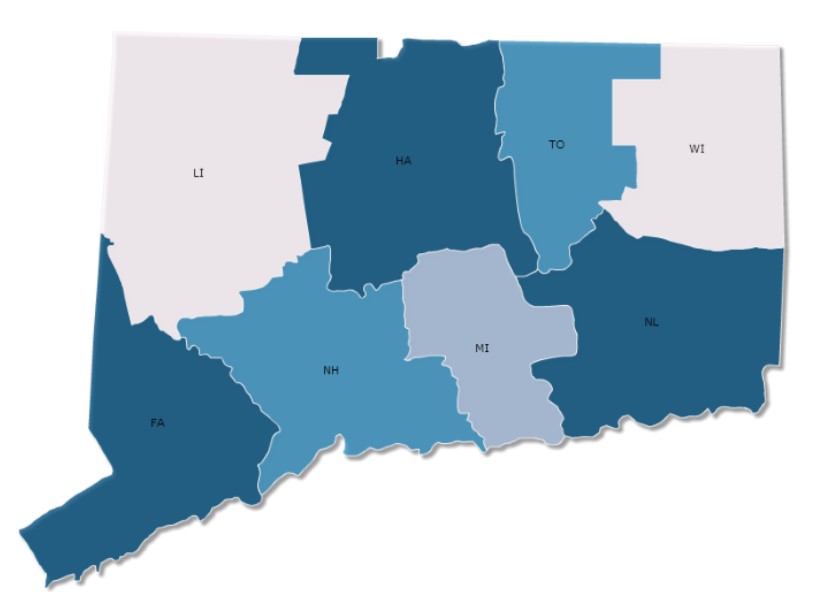

 According to a study by the U.S. Public Interest Research Group, Americans are driving fewer total miles today than eight years ago, and driving fewer miles per person than we did in 1996. It is a reversal after decades of steady growth.
 st over 80 percent, according to a University of Michigan study, the website noted. If you don’t own a car, you don’t need car insurance.

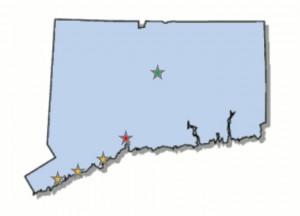 The Bridgeport-Stamford-Norwalk region ranked #5 in physical health, #43 in financial health, #58 in community ties, #63 in sense of purpose and #88 in social health.
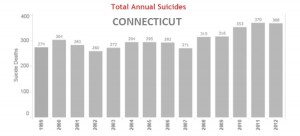 Connecticut had 368 suicides in 2012, compared with 271 in 2007, which was the lowest number in the state since 2002. Suicide is the 10th leading
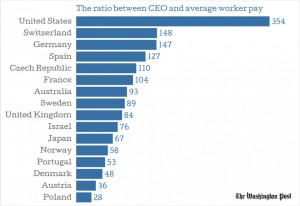
 The top 1 percent in Connecticut saw incomes grow by 35 percent between 2009 and 2012, while the bottom 99 percent of Connecticut taxpayers saw average real income growth decline by 5.4 percent during the same period, according to the report. In fact, the states in which all income growth between 2009 and 2012 accrued to the top 1 percent include not only Connecticut, but Delaware, Florida, Missouri, South Carolina, North Carolina, Washington, Louisiana, California, Virginia, Pennsylvania, Idaho, Massachusetts, Colorado, New York, Rhode Island, and Nevada.