Seniors Better Off Than Other Adults in CT; State’s Ranks #6 in Senior Advantage

Older adults living in Delaware have the largest well-being advantage relative to the overall state population, followed closely by Oregon, Iowa, New Hampshire, Michigan and Connecticut.  A new state-by-state comparison examines the comparative well-being of Americans age 55 and older, and reveals that, nationally, people in that age category have higher well-being than the rest of the population. The inaugural report is based on data from the Gallup-Healthways Well-Being Index®. The growing percentage of the American population over the age of 55 — a trend largely driven by the Baby Boomers entering later life — has important implications for a variety of stakeholders, including families, employers, healthcare providers and policymakers, according to the report’s authors. “State Well-Being Rankings for Older Americans” aims to fill the research gap.older-americans-cover-thumb

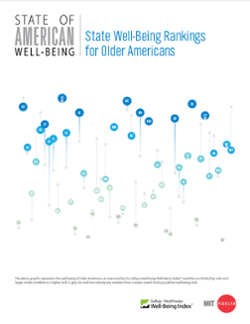
The report focuses on five elements of well-being: purpose, social, financial, community and physical. These five elements, according to Gallup and Healthways, create a composite picture of the well-being of older Americans in each state.  rankings
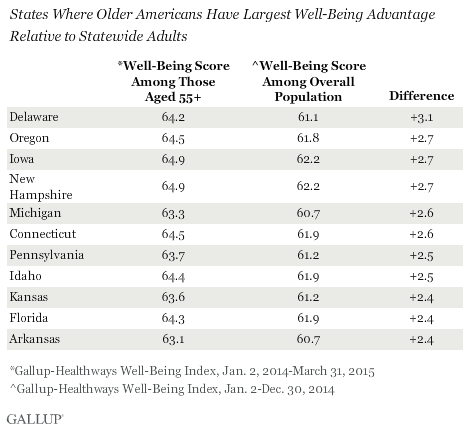
The Well-Being Index is calculated on a scale of zero to 100, where zero represents the lowest possible well-being and 100 represents the highest possible well-being.  Connecticut’s well-being score was 64.5 for those age 55+, compared with 61.9 for the overall adult population.  The difference of 2.6 was the sixth highest among the states.

The state where older Americans' well-being advantage is smallest is Wyoming, followed by Alaska, Oklahoma, Nevada, South Dakota, Maine and Vermont.

In an absolute sense, Hawaii, Montana, South Dakota, Alaska and Iowa are the top five states for overall well-being for older Americans -- states that also have high well-being rankings for the overall population.  The next five: New Hampshire, Utah, Oregon, New Mexico and Connecticut.

That places Connecticut in the top 10 in the overall rankings for well-being for older residents, and for the well-being advantage its seniors have above the overall adult population in the state.  Connecticut has the 7th oldest population in the nation. GallupHW_WBI_2C

States with the lowest well-being for older Americans are also those where well-being as a whole tends to lag behind the rest of the country: West Virginia, Kentucky and Oklahoma. . The report is based on self-reported data from 114,388 interviews with individuals age 55 and older, and was conducted in conjunction with the Massachusetts Institute of Technology (MIT) AgeLab.

“The greatest success of humankind is longer life. The challenge today for families and society is how to live longer, better with the highest state of well-being,” said Joseph F. Coughlin, director and founder of the MIT AgeLab. “Understanding our aging population, including Baby Boomers, the largest generation in our nation’s history, will be critical as we design policies and interventions to help older Americans thrive in all aspects of their lives.”

English Language Learners May Hold Key to Economic Vibrancy of Region, State

One-third of Hartford’s population is Puerto Rican, making it the 4th highest percentage of Puerto Rican people in the continental United States.  But the rapidly increasing diversity of the state’s Capitol City, and the region that surrounds it, only begins there – as do the linguistic and workforce challenges. A new report produced by The Hartford Foundation for Public Giving Latino Endowment Fund focuses on the issues faced by English Language Learners and highlights the opportunities and the challenges of increased cultural and linguistic diversity.report

Approximately one-eighth of the Greater Hartford region’s population consists of foreign-born residents, including 4,800 people who have arrived in the state since 2005.  A total of 500,000 foreign-born residents are now living in Connecticut, including 40 percent who hail from Latin American countries.

During the past 25 years, population growth in the Hartford region has been “almost entirely” driven by foreign-born people taking up residence locally, according to the report. In the Hartford region, more than 1 in 5 people speak a language other than English at home.  About three-quarters of Connecticut English Language Learner (ELL) students speak Spanish.

The report found that the region’s “schools and communities are more diverse than ever, with more than 100 different languages spoken in homes throughout Greater Hartford.”  The report raises the question, “How can we harness the assets of a multilingual population to enhance our community and create stronger links to the global marketplace?”HFPG_VertLogo_rgb

The report notes that “researchers believe that, on average, it takes 2 years to master conversational English, yet 5-7 years to master academic English.”  The report indicated that when analyzing education and workforce data, English Language Learners are far behind their English speaking peers in terms of educational attainment and income.Highlighting one of the challenges for ELL students, the reported found that over the last 4 years, two of the top three teacher shortages in Connecticut have been bilingual and world languages educators.  About 20% of all adult ELLs experienced poverty in the last year, about twice the rate in the state as a whole. In Connecticut, the earned income of ELL adults is $25,000 per year—less than half of English-speakers’ earnings.

population
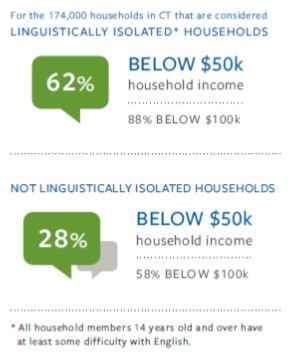
“The Latino Endowment Fund has offered this report as a means to expand the important discussion on efforts to support English Language Learners in our communities,” said Luis Cabán, chair emeritus of the Latino Endowment Fund Steering Committee. “This document provides us with an opportunity to reframe how we think about our increasingly global community and recognize the advantages of people speaking more than one language to enhance the richness of our community and create stronger links to the global marketplace.”

The number of Hispanic entrepreneurs in the United States has more than tripled since 1990 from 577,000 in 1990 to 2,000,000 in 2012, according to the report. Immigrant-owned businesses employ 10% of all American workers and generate 16% of the overall US business income.  Connecticut is home to 14,000 Latino-owned small businesses, which represents a 50 percent growth rate since 2007.

In Connecticut as of 2013, there were over 191,000 working-age adults with limited English proficiency.  This population has grown 32 percent since 20000 and now represents 10 percent of the total working-age population.  Over 58 percent of these are Spanish-speaking, the report indicated. teacher shortage

Some of the potential solutions highlighted in the report are:

  • Eliminating the state requirement that a district must have a minimum of 20 students requiring ELL support before receiving state funding. All districts that teach students who need ELL support should be eligible for state assistance.
  • Expanding dual-language immersion programs to build a more supportive multilingual environment that can cater to both urban and suburban families.
  • Developing an ESL/adult education curriculum for parents that focus on interactions with their children’s schools and teachers.
  • Providing additional support to create a smooth transition from adult education ESL classes to college-level ESL classes through the development of a coordinated curriculum.household income

“While we appreciate the recent actions by the legislature to support ELL students and their families, this report shows that much work needs to be done to assist the thousands of Connecticut children and adults who are not proficient in English,” said Nelly Rojas Schwan, chair of the Latino Endowment Fund and an assistant professor of social work and Latino community practice at the University of Saint Joseph. “The future of our state’s economy will largely be determined by how well we educate and train our English Language Learners and we hope this report will serve as a tool to aid in this discussion.”

Download a copy of the report.

White House Conference on Aging Has Connecticut Connections

It is a once-a-decade event that will feature the President of the United States and other senior administration officials. The White House Conference on Aging (WHCOA), first held a half-century ago and a key driver of federal policy towards the nation’s seniors, will be a conference reliant on digital technology befitting 2015.WHCOA box Rather than having delegates from throughout the nation stream into Washington, D.C., Americans are asked to watch events unfold via live stream – either at home, or by getting together with co-workers or people from their local communities.  Officials note that more than 600 public and private Watch Parties—in every state—have been organized and registered with WHCOA.

According to the WHCOA website, there are four “watch party” sites in Connecticut, where people can gather to watch the live video feed together. The sites are in Hamden at the Whitney Center, in Norwalk at Home Care 100, in Waterbury at the Western CT Area Agency on Aging, and in West Hartford at Hebrew Healthcare.  The WHCOA has produced a Watch Party Discussion Guide to encourage dialogue during the event, in addition to listening to speeches emanating from the White House.65

Earlier this year, regional forums leading up to the WHCOA were held in Tampa, Phoenix, Seattle, Cleveland and Boston.  Lisa Ryerson, President, AARP Foundation President, moderated the panel in Boston, which explored the topics of healthy aging and long-term services and supports. Panelists included Jewel Mullen, Commissioner, Connecticut Department of Public Health and President, Association of State and Territorial Health Officials.  The Boston  Regional Forum, held on May 28, 2015, was the fifth and last in the series of regional forums, coordinated with the Leadership Council of Aging Organizations, a coalition of more than 70 of the nation’s leading organizations serving older Americans.photo

In addition, Connecticut’s Department on Aging, Legislative Committee on Aging and Commission on Aging held a public hearing in May at the Legislative Office Building highlighting issues impacting the state’s seniors, with the testimony from that day being shared with WHCOA officials. Connecticut officials noted that Connecticut is undergoing a “permanent and historic transformation” in its demographics, and currently has the nation’s 7th oldest population.  Between 2010 and 2014, Connecticut’s population of people age 65 and older is projected to grow by 57 percent, while at the same time the population of individuals between age 20 and 64 will grow by less than 2 percent.

Monday's WHCOA  begins with a welcome from Valerie Jarrett, Senior Advisor and Assistant to the President for Intergovernmental Affairs and Public Engagement, being introduced by Bernard Nash, Caregiving in America Panel.  An early morning panel is to be moderated by actor David Hyde Pierce and will include Secretary Robert A. McDonald, U.S. Department of Veterans Affairs; Ai-jen Poo, Caring Across Generations; Harry Leider, The Walgreen Company; Frank Fernandez, BluePlus, BCBS Minnesota Foundation; and Britnee Fergins, Caregiver.Obama

Remarks by President Barack Obama, will be followed by a panel on “Planning for Financial Security at Every Age” moderated by Secretary Tom PeRobin Diamonte
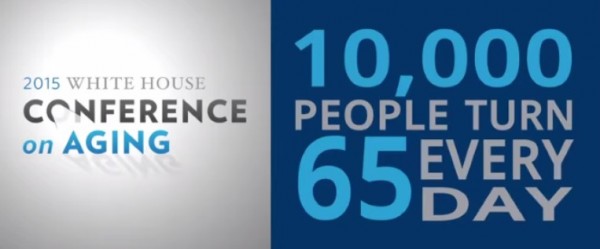
rez, U.S. Department of Labor.  The panel will include Jean Chatzky, AARP Financial Ambassador; Vickie Elisa, Mothers’ Voices Georgia; Robin Diamonte, United Technologies Corporation; and Andy Sieg, Merrill Lynch Bank of America.

Diamonte, UTC’s Chief Investment Officer, was voted CIO of the Year in April by her peers in the Investor Intelligence Network (IIN), an online forum of senior financial decision-makers. IIN is part of Institutional Investor PLC, a leading international business-to-business publisher best known for its Institutional Investor magazine.  Diamonte is responsible for overseeing UTC’s $52 billion in global retirement assets, including $24 billion in domestic pension plans, $7 billion in foreign pension plans and $21 billion in the defined contribution plan.

Following the panel that includes Diamonte, viewers will hear remarks from Nora Super, Executive Director of the 2015 White House Conference on Aging and Cecilia Muñoz, Assistant to the President and Director of the Domestic Policy Council.

Also delivering rwhite hosueemarks or participating in panels are Secretary Tom Perez, U.S. Department of Labor; DJ Patil, White House Office of Science and Technology Policy; Secretary Tom Vilsack, U.S. Department of Agriculture; professional athlete Diana Nyad; Vice Admiral Vivek Murthy, U.S. Surgeon General; Director Richard Cordray, Consumer Financial Protection Bureau; and Stephanie Santoso, White House Office of Science and Technology Policy.

In addition, Kevin Washington, President and CEO of the YMCA, will be a member of a panel on The Power of Intergenerational Connections and Healthy Aging.  Washington, who formerly led the YMCA in Hartford, was honored last month by The Amistad Center for Art & Culture in Hartford for his leadership, noting that he is the first African American to lead the nation’s YMCA organization.Kevin Washington

Throughout the day, individuals are asked to “Tweet us your questions using #WHCOA and we will pass them along to our experts participating on panels at the conference.” People are also asked how they would finish the sentence: “Getting older is getting better because …”? A PDF form can be downloaded and then sent along to WHCOA officials.  Interviews with older adults can be uploaded to be archived in the Library of Congress, and people are encouraged to share their interviews on social media using the #WHCOA hashtag.

https://youtu.be/gdAWa6wNYXs

Income Inequality Around Bridgeport Has Grown, Among Nation’s Largest Gaps, Research Shows

Commuting zones surrounding Bridgeport are among the commuting regions in the United States where neighborhood income inequality has grown notably most severe over the past 20 years, according to a new analysis developed by the Urban Institute and published in Governing magazine. From 1990 to 2010, inequality in the United States increased in many ways, the report explains, highlighting that the income, wealth, and educational attainment of residents in the most privileged neighborhoods in the U.S. escalated rapidly over these two decades. Meanwhile, “residents of the most disadvantaged neighborhoods gained little; many of these neighborhoods grew poorer,” the report indicated.

WOrlds ApartAs a result, the study found that inequality between “top and bottom income” neighborhoods intensified in the great majority of commuting zones. Even where inequality dropped, the story was not always positive: it often occurred because top-neighborhood incomes fell in the wake of economic stagnation.

The research report, “World Apart:  Inequality between America’s Most and Least Affluent Neighborhoods,” found that “the national trend toward rising incomes among top-earning households” was reflected in the nation’s top tracts show growth from $123,000 to $138,300, over 12 percent” during the period 1990-2010.  Some top neighborhoods, including those surrounding Bridgeport, “had increases of over $30,000 at the top.”

Annual income in bottom tracts, meanwhile, grew from $36,800 to $37,150 – less than 1 percent over the twenty year period.  The average income of bottom tracts declined in 209 of the 570 commuting zones studied, the report indicated.  The most severe losses at the bottom among large commuting zones, the report found, occurred in Bridgeport, Newark and Dallas. Bridgeport is one of the ten cities with the largest “neighborhood inequality index.”

The report flatly stated that “Bridgeport, which includes the entirety of Connecticut, already was one of the most unequal commuting zones in 1990.  Its top and bottom neighborhoods pulled further apart in income between 1990 and 2010; practically all its top neighborhoods are still in the suburbs and practically all its bottom neighborhoods are in central cities.”bgpt NH

The only cities with commuting zones of over 250,000 people with a higher “neighborhood inequality index” than Bridgeport, as of 2010, are Austin, Baltimore, Birmingham, Columbus, Houston, Nashville, Richmond, and St. Louis.

As a result of changes at the top and bottom, the report noted, income inequality between top and bottom tracts grew from 1990 to 2010 in 433 of the 570 commuting zones. In 237 CZs, income inequality grew because of rapid increases at the top coupled with modest increases at the bottom.

To understand the differences between neighborhoods that share the same housing and labor markets, the Urban Institute analysis used commuting zones (CZs), county-based regions defined in the 1990s. Unlike metropolitan areas, commuting zones cover the entirety of the United States, and their definitions are constant over time.

The study ranked every CZ’s tracts from lowest to highest neighborhood advantage score. Then they identified the top 10 percent and the bottom 10 percent of tracts—the most advantaged and least advantaged neighborhoods in each CZ—for further exploration. There are described as top and bottom tracts. The study analyzed the 570 CZs that had at least 10 census tracts in 2010.

The nonprofit Urban Institute is dedicated to elevating the debate on social and economic policy. The organization’s website explains that “For nearly five decades, urban scholars have conducted research and offered evidence-based solutions that improve lives and strengthen communities across a rapidly urbanizing world. Their objective research helps expand opportunities for all, reduce hardship among the most vulnerable, and strengthen the effectiveness of the public sector.”

Hartford Area Ranked #5 Up-and-Coming City for Tech Jobs

As tech grows to increasingly  impact almost every aspect of our lives, it’s not surprising that the industry is moving beyond its traditional home of Silicon Valley and taking root in regions across the nation.  Where that growth is happening is the subject of continual scrutiny and intense interest.  Now, a new analysis indicates that among the leading up-and-coming regions for tech jobs is Connecticut's Capitol Region of Hartford-East Hartford-West Hartford, which placed fifth in a review of tech jobs by ZipRecruiter. By analyzing the hiring trends nationwide, the company has compiled a list of the Top 10 Up-and-Coming Cities for Tech Jobs.  Greater Hartford was one of two regions in New England to make the top 10 list; the other is Manchester, New Hampshire, three slots behind Hartford.  They were the only Northeast cities to earn a position on the list.region

According to the company’s website, “although it once suffered the same decline characterizing many Rust Belt cities, Hartford has diversified into the insurance, healthcare, and tech industries and exhibited positive growth as of our latest jobs report.” While noting that “the city is home to headquarters for United Technologies,” ZipRecuiter also indicated that the region “continues to attract new companies with its population of entry level job seekers from local universities and excellent quality of life.”  UTC recently announced it would be moving its headquarters from Hartford to Farmington, CT, just one town west of West Hartford.

Top 5 technology jobs, according to the analysis, in the Hartford-West Hartford-East Hartford region are:

  • Applications Engineer
  • Systems Analyst
  • Infrastructure Engineer
  • Java Developer
  • Data Architect

Top-Tech-Jobs-
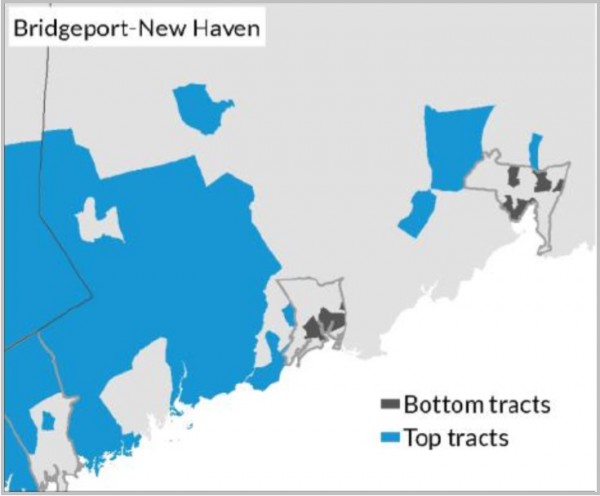
Overall, the top 5 up-and-coming regions for tech jobs in the U.S. were 1) Austin-Round Rock, TX, 2) Raleigh-Cary, NC, 3) Provo-Orem, UT, and 4) Fort Collins-Loveland, CO.  Also reaching the top 10 were 6) Indianapolis-Carmel, IN, 7) Boise City-Nampa, ID, 8) Manchester-Nashua, NH, 9) Nashville-Davidson-Murfreesboro-Franklin, TN and 10) Eugene-Springfield, OR.

ZipRecruiter allows small businesses, individual employers and recruiters to easily reach the right candidates and make the best hiring decisions with single-click postings to 100+ leading job networks azipnd online interview tools, all while eliminating bulky and expensive software. Founded in 2010, ZipRecruiter is a privately held company based in Santa Monica, California.


Largest Community Survey in U.S. Now Underway in Connecticut; 15,000 People to be Interviewed

The 2015 Community Wellbeing Survey is set to become the largest cross-sector community survey in the United States, interviewing 15,000 randomly-selected residents this spring and summer including individuals from every town and city in Connecticut. The initiative is creating the first-ever shared measures of quality of life, happiness, and community health across all neighborhoods, towns, regions, and the state as a whole. These interviews will reveal findings that are currently unavailable at a local level from any other public data source.

New Haven-based DataHaven is working with leaders from more than 100 statdatahavene and local government agencies, major health care and academic institutions, and community and philanthropic organizations to design and conduct the program.

The organization has combined many existing grassroots and regional efforts-including DataHaven's own 2012 Greater New Haven Wellbeing Survey-into a single, exceptionally high-quality survey covering all of Connecticut and a few adjacent sections of New York State.

Survey-takers are based at the Siena College Research Institute, a leading independent research organization near Albany with a staff of more than 100 highly-trained English- and Spanish-speaking interviewers. Calls began in April and will continue throughout the summer. (The survey calls will come from the 518 area code.)

“Our initial feedback from residents and our previous experience with this survey shows that people like to answer these questions,” says Mark Abraham, Executive Director of DataHaven, which is spearheading the campaign. “They are answering questions about their own happiness and health, their family’s financial security, and how their communities and neighborhoods are faring. These questions show that we care about how they feel.”

Seeing the potential impact of its results, dozens of Connecticut’s leading hospitals, government agencies, universities, and charities are backing the 2015 Community Wellbeing Survey with major donations. Supporters joining DataHaven include regional community foundations, United Ways, and health care providers located in Hartford, New Haven, Bridgeport, Stamford, Waterbury, New Britain, Norwalk, Danbury, Bristol, Derby, New London, and elsewhere.phone

This nationally recognized program provides neighborhood- and regional-level information not available from any other source on community vitality, health, family economic security, and individual happiness. Other topics such as civic engagement, transportation, housing,and employment – even satisfaction with government and community life – are included. The mission of the initiative is to produce the highest-quality, neighborhood-level information on issues that are most meaningful to local residents, and to foster collaboration between the hundreds of organizations, institutions, businesses, and agencies that are working to build stronger communities.

“With such a detailed snapshot, state and local community leaders will be able to better serve the health and well-being needs of our communities,” says Abraham.

Partners providing significant funding for the program are representative of each region of Connecticut:

  • In Fairfield County, $200,000 has been committed by leading organizations such as Fairfield County's Community Foundation, Bridgeport Hospital, Stamford Hospital, Greenwich Hospital, and the United Way of Coastal Fairfield County.
  • In south-central Connecticut, The Community Foundation for Greater New Haven along with Yale-New Haven Hospital, Workforce Alliance, United Way of Greater New Haven, and others have joined forces to commit over $100,000 in funding.
  • In Greater Hartford and New Britain, the program has drawn over $100,000 in support from the Hartford Foundation for Public Giving, Community Foundation of Greater New Britain, Trinity College Office of the President and Center for Urban and Global Studies, Saint Francis Hospital and Medical Center, Johnson Memorial Medical Center, and others.

wellbeingAdditionally, DataHaven has secured funding to ensure that residents of Connecticut's smaller cities and rural areas are included to the same degree as those living in its major metropolitan areas. Nearly $200,000 has been committed from organizations such as the Connecticut Community Foundation, Valley Community Foundation, Lawrence + Memorial Hospital, Ledge Light Health District, Community Foundation of Eastern Connecticut, Connecticut Housing Finance Authority, and others.

Results from the survey will be published in a series of local and statewide reports throughout late 2015 and 2016, helping to shed light on progress made toward various longstanding community priorities, including financial security for families and opportunities for children to succeed.

"We believe the 2015 Community Wellbeing Survey, the most comprehensive local level survey of its type in the United States, will be of great value to neighborhoods and organizations striving to make our cities and towns even better places to live and work,"says Abraham.

DataHaven is a non-profit organization with a 25-year history of public service to Greater New Haven and Connecticut. DataHaven’s mission is to improve quality of life by compiling, sharing, and interpreting public data for effective decision making. DataHaven is a formal partner of the National Neighborhood Indicators Partnership of the Urban Institute in Washington, DC. Last fall, the Community Indicators Consortium presented an “Impact Award”  to DataHaven’s Executive Director Mark Abraham, honoring Abraham with a trophy and opportunity to speak to the organization's annual assembly. Abraham illustrated how DataHaven and its partners across Connecticut have collected and used public data to advance community change.


Tolland Is CT's Youngest County as State, National Population Grow Older, Millenials Outpace Boomers

The latest estimates from the U.S. Census Bureau indicate that the nation is getting older, even as the millennials are outpacing the baby boomers.  The U.S. median age ticked up from 37.6 on July 1, 2013, to 37.7 on July 1, 2014, and each of Connecticut’s eight countries got just slightly older as well. The youngest counties in Connecticut — those with the lowest median age — were Tolland, at 38, Fairfield and New Haven, both at 39.8 and Hartford, at 40.1.  The countieages in Connecticut with the highest median age on July 1, 2014, were Litchfield at 46.3, Middlesex at 44.6 and New London at 40.9. (Median age means that half the population was older than this age and half younger.)

The Census Bureau also announced that millennials, or America’s youth born between 1982 and 2000, now number 83.1 million and represent more than one quarter of the nation’s population. Their size exceeds that of the 75.4 million baby boomers, according to newly released estimates.

Overall, millennials are more diverse than the generations that preceded them, with 44.2 percent being part of a minority race or ethnic group (that is, a group other than non-Hispanic, single-race white).  The U.S. Census examined population changes among groups by age, sex, race and Hispanic origin nationally, as well as in all states and counties, between April 1, 2010, and July 1, 2014.

Even moasdfre diverse than millennials are the youngest Americans.  The Census Bureau indicates that those younger than 5 years old became majority-minority for the first time, with 50.2 percent being part of a minority race or ethnic group, as of 2014 data. Reflecting these younger age groups, the population as a whole has become more racially and ethnically diverse in just the last decade, with the percentage minority climbing from 32.9 percent in 2004 to 37.9 percent in 2014.

Nationally, non-Hispanic, single-race whites was the largest group in 2014, at 197.9 million. Hispanics were next, with a population of 55.4 million, followed by blacks, at 45.7 million, Asians (20.3 million), American Indians and Alaska Natives (6.5 million) and Native Hawaiians and Other Pacific Islanders (1.5 million).Census_Bureau_seal

In Connecticut, the populations of each group were as follows:

Non-Hispanic single-race

  • whites 2,475,371

Race alone or in combination groups

  • Hispanics -  541,152
  • Blacks - 461,437
  • Asians - 184,332
  • American Indians and Alaska Natives - 40,267
  • Native Hawaiians and Other Pacific Islanders - 7,779

Five states or equivalents were majority-minority: Hawaii (77.0 percent), the District of Columbia (64.2 percent), California (61.5 percent), New Mexico (61.1 percent) and Texas (56.5 percent). Among the remaining states, Nevada is the closest to crossing this threshold, with a population 48.5 percent minority. More than 11 percent (364) of the nation’s 3,142 counties were majority-minority in 2014.

The nation’s 65-and-older population grew from 44.7 million in 2013 to 46.2 million in 2014. This group, which now contains the oldest four years of the baby boom generation (born between 1946 and 1964), is 21.7 percent minority, less diverse than younger age groups.

In contrast to most states, including Connecticut, where the population got older, five states experienced a decline in median age between July 1, 2013, and July 1, 2014: North Dakota, Hawaii, Montana, Wyoming and Iowa. Maine experienced the largest increase in median age among states, rising from 43.9 to 44.2 over the period.

There were only 10 states where males made up a majority of the population in 2014. Alaska had the highest male percentage (52.6 percent), followed by North Dakota (51.3 percent).

CT Ranks 35th in Economic Clout of Women-Owned Businesses; Growth Rate Ranks 43rd

According to the latest State of Women-Owned Businesses Report, women-owned firms in the U.S. now make up 30 percent of all businesses -- and they're generating about $1.5 trillion in revenue, an increase of 79 percent since 1997.  Connecticut, however, ranks 43rd in the nation in the percentage of growth, below the national average, at 42.1 percent.  The state also ranks 28th in percentage of revenue growth of women-owned businesses, and 22nd in the growth of employment levels in women-owned businesses.  Overall, Connecticut ranks 35th in the nation in the combined "economic clout" ranking of women-owned businesses, considering growth in the number of firms, revenues and employment during the past two decades.report cover 
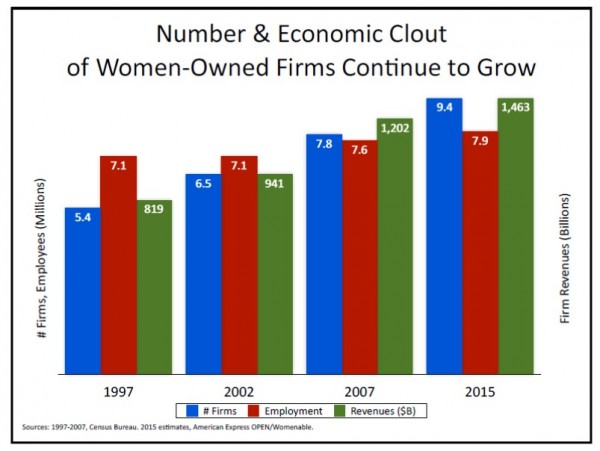
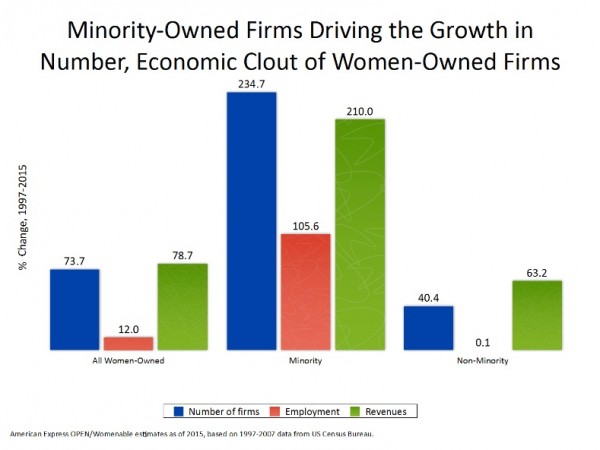
The newly released report, looking back at the past two decades, found that women-owned firms are found in every state and in every industry:

  • The number of women-owned firms in the U.S. continues to climb, and is now estimated to have surpassed 9.4 million enterprises—30 percent of all businesses in the country;
  • Women-owned firms now employ over 7.9 million workers (excluding owners), providing one in seven jobs among privately-owned businesses.
  • The fastest growing industry sector is educational services, which has seen a 67% increase in the number of women-owned firms since 2007 versus an overall 21% increase.

A study by American Express OPEN using U.S. Census data found the number of women-owned businesses has grown dramatically since 1997.  Since that year there have been an average of 608 net new women-owned firms launched each and every day across the nation—and the rate just over the past year stands at 887 per day. The number of women-owned firms is increasing at a rate 1.5 times the national average.

Connecticut has nearly 103,000 women-owned businesses employing 95,000 people and generating approximately $16.7 billion in sales, according to data outlined in the report.  Picture4

Nationally, the number of women-owned firms has increased by 74 percent since 1997. The states with the fastest growth in the number of women owned firms over the past 18 years are: Georgia (up 132%), Texas (116%), North Carolina (98%), North Dakota (89%) and New York (89%). The top ten states for women-owned firms, in terms of growth in number and economic clout, are North Dakota, Wyoming, D.C., Arizona, Georgia, Nevada, Maryland, Texas, Utah and Hawaii.  The states at the bottom of the list are Iowa, Rhode Island, Maine, Vermont and Ohio.

In 1997, there were just under 1 million (929,445) firms owned by minority women, accounting for one in six (17%) women-owned firms.  That number has skyrocketed to an estimated 3,111,300 as of 2015, now comprising one in three (33%) women--‐owned firms. These 3.1 million multicultural women--‐owned firms employ 1.6 million workers in addition to the owner and generate an estimated $268 Billion in revenues.women owned firms

The industries with the highest concentration of women-owned firms are healthcare and social assistance (53 percent of firms in this sector are women-owned, compared to a 30 percent share overall), educational services (45 percent), other services (42 percent), and administrative support and waste management services (37 percent).

In the mid-west, Illinois ranks 19th nationally with 68 percent growth in the number of female business owners over the last 18 years, while Indiana placed 45th nationwide with 37.7 percent growth (somewhat below Connecticut's ranking).  New Jersey ranked 25th for growth in the number of women-owned businesses, with a 58.3 percent growth rate between 1997 and 2015, and 40th for growth in revenue, at 58.2 percent.

The report also found that the number of minority women who own businesses has grown significantly. In 1997, minority women owned 17 percent of women-owned firms in the United States. Today, minority women own 33 percent of the nation's 9.4 million women-owned companies. African-American women own 1.3 million businesses and Latinas own 1.1 million companies.swob-report-weeks-openforum-embed1

The report points out that "the only bright spot in recent years with respect to privately-held company job growth has been among women-owned firms.  They have added an estimated 340,000 jobs since 2007.  Among men-owned and equally-owned firms, employment has declined over the past eight years."

The study also found that start-up activity among women is on the rise, as the daily rate of net new women-owned firms was 602 in 2011-12, 744 in 2012-13, 1,288 in 2013-14 and this past year was 887 net new women-owned firms per day - all higher than the overall 554 per day over the entire 2007-15 period, according to the report.

Among the 484 net new minority-owned firms per day last year were 223 African-American women-owned firms, 168 Latina-owned firms and 105 Asian American owned firms started each day in 2014.


Smith, Johnson and Brown are Connecticut’s Most Popular Last Names

The top surname in Connecticut and the United States is Smith.  The next most popular are Johnson and Brown.  Brown is most common in California, Nevada and the Northeast, and ranks 4th nationally, according to data compiled from the Social Security Administration by the website MooseRoots. Williams is 6th in Connecticut, but the third most popular in the nation.  Jones is 7th in Connecticut and 5th ranked nationally.  Miller, which is most popular in the Pacific Northwest and across the Rust Belt, ranks 6th in the nation but 5th in Connecticut.d13e63f8-33d1-4650-8cbc-8210d5ba55a1CT names

The website points out that “baby name trends can change wildly from generation to generation, but last names tend to stick around. Still, immigration, birth rates and geography can all have an effect on the overall ranking, which can shift from decade to decade.”

Smith’s popularity is unmatched: the name is the most prevalent in a majority of US states, only slightly less popular in New Mexico and some northern states.  Johnson’s US popularity can be split into three regions: less popular in the East, more popular in the West, and especially popular in the North, according to the website’s analysis. Most popular in the Southeast, Williams is notable for being more evenly split between whites and blacks.

While Davis is a predominantly white name, nearly one third of Americans with the name identify as black.  Davis ranks 7th nationally, and 9th in Connecticut.  The Nutmeg State’s 4th most popular last name is Anderson, which ranks at #12 in the U.S.  Anderson is described as “a distinctly northern name, most popular among states like Montana, North Dakota, Sodavis
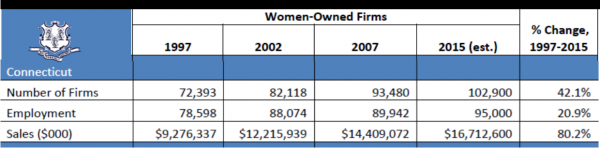
uth Dakota, Wisconsin, and Minnesota, where it ranks 2nd.  Anderson also ranks high in Massachusetts and Rhode Island, at #6.

The top Hispanic surname nationally is Garcia, ranked at #8.  In Connecticut, Garcia ranks #317 among last names of state residents, according to the data.  It is directly followed by Rodriguez, ranking #9 in the U.S. and #114 in Connecticut.  Over 90 percent of individuals with a last name of Rodriguez identify as Hispanic. The name is most popular in large states such as New York and Florida, as well as across the entire Southwest.

smithThe #10 surname in the U.S. is Wilson, which is described as having “a checkerboard-like popularity across the United States.”  In Connecticut, Wilson ranks as the 13th most popular last name.

In Connecticut, the 11th most popular last name is White, which ranks #20 among the nation’s population.  While White is predominantly a Caucasian surname, the website points out, it is still reasonably common among blacks. Geographically, the name is most popular in the Northeast, particularly among the New England states.  White ranks as #6 in Maine and New Hampshire, #8 in Vermont, #7 in Massachusetts and #10 in New York  The only other states where White is a top-10 surname are Missouri (#10) and West Virginia (#9).  In addition to Connecticut, White ranks at #11 in Mississippi.

The MooseRoots website “combines historical records with relevant supporting information to provide unique insights into your family's past.”  It is operated by FindTheBest, a technology company focused on collecting and interpreting data.


Leadership Greater Hartford Connects More Than 400 Volunteers with Nonprofit Board Service

In just over six years, more than 400 people in the Greater Hartford area have joined the board of directors of local nonprofit organizations, through an innovative matching program run by Leadership Greater Hartford.  The program has proven both popular and successful, and is seen as a win-win for the nonprofit organization in need of expertise and individuals looking for ways to contribute to the well-being of the community. The Leaders on Board program has matched 404 individuals – from young professionals to retirees - with more than 100 nonprofit organizations since January 2009.  The program attracts individuals with an interest in serving on a board, and looking to develop their leadership skills and serve the community.  Potential board members receive training in nonprofit organizational structure and management, are introduced to the role and responsibilities of board members and are encouraged to explore their own individual skills. The training session provides the foundation for effective board service. LOB no Express Logo 34

Leaders on Board, unique in Connecticut and perhaps the largest initiative of its kind in the region, provides a critical connection for nonprofit organizations who are looking for board members that have been trained in the basics of board membership and have expressed an interest in serving on a nonprofit board.  In some cases, individuals’ employers encourage such community activism, in others, the person is seeking to give back to the community or broader their involvement in issues that are of particular interest.  Corporations and businesses participate in the Leaders on Board program by offering board governance training to encourage their employees who are interested in serving the community.

The program works in a round-robin matching session, where representatives of nonprofit organizations conduct brief one-on-one interviews.  At the end of the session, both the individual and the organizations indicate where they think there might be a match.  If there’s agreement, there are further follow-up conversations to determine if selection to a specific board should go forward.  Often, the answer is yes.

“I decided to participate in leaders on Board because I was looking for a way to become a board member on a local, small to medium-sized nonprofit organization," explained Bill Valentine, Donor Relations Manager, United Way of Central and Northeastern CT. "Leaders on Board is the ideal way to learn the basic information about the responsibilities of being a board member and to learn about the organizations that are looking for new board members.”

At times, prospective board members learn of nonprofit organizations they had not been aware of or knew little about.  For people new to the region, and even those who have spent a career in Greater Hartford, the variety of nonprofit organizations, and they work they pursue with various populations, can be eye-opening.  The list of organizations that have placed members on boards through the Express Match process is quite impressive – a who’s who of community organizations.logo_block

In 2013, the Association of Leadership Programs, a national organization with affiliates across the country, presented Leadership Greater Hartford with its first “Excellence in Innovation” award for the implementation and success of the Leaders on Board program.  Recent years have also seen greater diversity among prospective board members, and interest by nonprofit organizations in having boards that more closely reflect the diversity of the community they serve.

"I had been considering pursuing board membership for a few years when The Junior League of Hartford offered its members a chance to participate in Leaders on Board," recalled Patricia Sasser, Dean of Students at Loomis Chaffee.  "The Leaders on Board orientation provided great information on what a prospective board member needs to know about board service; it definitely set me up for success.  I felt prepared and excited when I attend my first Leaders on Board Express Match. Having a chance to speak with different organizations about their mission and purpose opened my eyes to all the different types of organizations I could support. I found several that really spoke to my heart and was excited when I was matched with an organization I admired."

Among those who have recently accepted board of directors positions, following the most recent Leaders on Board session:

  • Ann Means - Hartford Preservation Alliance
  • Chris Whelan - First Choice Health Centers
  • Sue Murphy & George Montowski - Hebrew Health Care
  • Nancy Frede - Hartford Knights Youth Foundation
  • Jessica Dansereau & Veda White - Lupus Foundation of America - CT Chapter
  • Veda White - Trinity Academy
  • Michael Fournier, Richard Moriarty and Patrick Garrity - Kinsella Arts, Inc.
  • Chris Thomas - Mental Health Association of CT
  • Jim Barrett - St. Philip House
  • Bernard Jenkins, Meri Horowitz and Gary Brochu - Coram Deo Recovery, Inc.
  • Richard Moriarty and Patrick Garrity - Kinsella Arts, Inc.
  • Karen Adamson, Maia Brooks, and Anthony Viggiano - Project Genesis
  • Aaron Clay and Jasmine Baten - West Hartford YMCA

Leaders on Board operates with support from the Hartford Foundation for Public Giving.  For more information, contact Mae Ryan Maloney at 860.951.6161 x1900 or email Mae.Maloney@leadershipgh.org. The mission of Leadership Greater Hartford is to develop, connect and inspire diverse leaders to build strong and vibrant communities.

https://youtu.be/vuXF7lKGuew