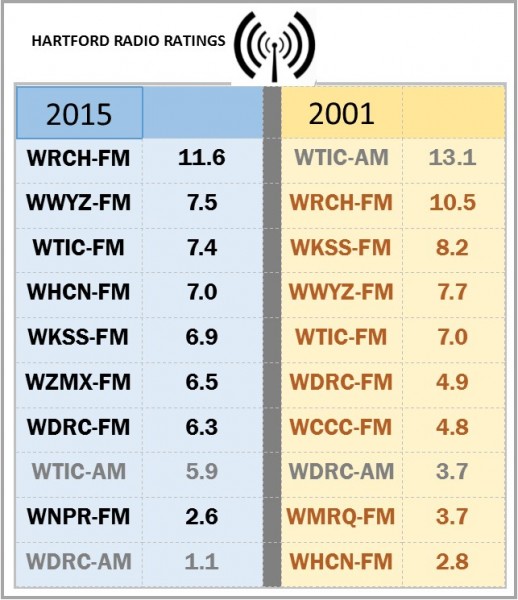
Caregiving Is Critical Issue as "Incredible Demographic Transformation" Continues, Aging Report Stresses

The United States continues to experience “incredible demographic transformation,” according to the Final Report of the White House Conference on Aging (WHCOA), a year-long, nationwide endeavor throughout 2015. In Connecticut, with the nation’s 7th oldest population, input was provided by legislative and executive branch agencies, which held hearings and offered expert testimony from organizations including AARP, the state Department on Aging, Legislative Committee on Aging and Commission on Aging. “No topic attracted more attention in the lead-up and follow-up to the 2015 WHCOA than caregiving. It echoed across all four of the conference issue areas,” the report indicated, referencing the four common themes that emerged as particularly important to older Americans: Retirement Security, Healthy Aging, Long-Term Services and Supports, and Elder Justice.cover  The final report noted the participation, at the Boston Regional Forum, of Connecticut’s Commissioner of the Department of Public Health, Jewel Mullen.

Among the findings in the report, issued by the White House, that will demand the attention of policy makers in the next decade:

  • Over 10,000 baby boomers are turning 65 every day, and the fastest growing demographic in the U.S. is women over age 85. The proportion of older adults representing racial and ethnic minorities is also increasing rapidly.
  • There is a need to break down the silos between housing, transportation, health care, and long-term services and supports in order to support healthy aging. The United States must also take advantage of an “increasing array of web-based technologies, robotics, and mobile devices” that “help older adults access the services they need, stay connected to family and friends, and remain active and independent.”
  • The majority of assistance for older Americans is generally provided at home by informal caregivers, especially family and friends, and are often the “primary lifeline, safety net, and support system for older adults.” Although rewarding, caregiving can be demanding, and “informal caregivers need to be supported and sustained with appropriate resources.”
  • With family structures changing as Americans are having fewer children and increasingly moving away from families of origin, the availability of family members to provide care is diminishing. “Direct care is a demanding profession with low wages, long hours, and limited benefits. It is critical for there to be efforts to recruit and retain a sufficient number of direct-care workers to keep pace with the growing need.”chart

The White House has held a Conference on Aging every decade, beginning in 1961, to identify and advance actions to improve the quality of life of older Americans. In 2015, the United States marked the 50th anniversaries of Medicare, Medicaid, and the Older Americans Act, as well as the 80th anniversary of Social Security. The White House Conference on Aging provided "an opportunity to recognize the importance of these key programs as well as to look ahead to the next decade."

At a public hearing in May at Connecticut's Legislative Office Building, state officials noted that Connecticut is undergoing a “permanent and historic transformation” in its demographics.  Statistics released as part of the WHCOA report echoed that observation.

65-600x249On July 13, 2015, President Obama hosted the sixth White House Conference on Aging, joining older Americans and their families, caregivers, and advocates at the White House and virtually through hundreds of watch parties across the country.

The July event built on a year-long dialogue; the White House Conference on Aging launched a website to share regular updates on its work and solicit public input; engaged with stakeholders in Washington, D.C. and listening sessions throughout the country; developed policy briefs on the emerging themes for the conference and invited public comment and input on them; and hosted regional forums with community leaders and older Americans in Tampa, Florida; Phoenix, Arizona; Seattle, Washington; Cleveland, Ohio; and Boston, Massachusetts.  Additional hearings, including those in Connecticut, were shared with conference officials.  Individuals and groups participated via live webcast in watch parties held in every State and were able to ask questions of panelists and others via Twitter and Facebook.

The Final Report, completed in late December and publicized by the White House this week, now goes to policy makers at the federal and state level to review findings and consider policy actions to respond the critical issues cited as requiring attention.

ph-whcoa-blog-collage


Average Age of Mothers Increasing in CT and Nationwide, Federal Data Reveals

First-time mothers are older than ever, new federal data has revealed.  Since 2000, the average mother’s age at the birth of her first child has increased in every state in the nation, rising 1.9 years or more in D.C., California, Oregon, and Utah, while increasing by less than a year in Connecticut, Michigan, New Hampshire, and West Virginia. Overall, the average age of mothers has increased from 2000 to 2014 for all birth orders, with age at first birth having the largest increase, up from 24.9 years old in 2000 to 26.3 years in 2014, according to newly released data compiled by the Centers for Disease Control and Prevention.  Connecticut is among a dozen states with the smallest increases in the average age of first-time mothers. graph

The federal agency points out that “a mother's age at birth, and particularly the average age when a mother has her first child, is of interest to researchers and the public. Mean age can affect the total number of births a mother has over a lifetime, which in turn impacts the composition and growth of the U.S. population. Age of mother is associated with a range of birth outcomes, such as multiple births and birth defects, the agency noted.

The largest factor in the rise a mother’s average age when her first child is born is the decline in the proportion of first births to mothers under age 20, down 42 percent from 2000 to 2014, or from approximately 1 in 4 births to 1 in 7.

Increases in the average age for all birth orders were most pronounced from 2009 to 2014, according to the data.  While the average age at the birth of a mother’s first child was fairly stable for the first half of this time period, greater increases were observed from 2009 (25.2 years) to 2014 (26.3 years).new mom

Increases from 2000 to 2014 in average age for higher birth orders were less than those for first births, rising 1.4 years for first births, 1.0 years for second births, 0.8 years for third- and fourth-order births, and 0.5 years for fifth- and higher-order births.  As a result of the different rate of increases by birth order, the gap in the average age between sequential birth orders is less than previously. For example, the difference in a mother’s average age at first birth compared with the mean age at second birth was 2.8 years in 2000 and fell to 2.4 years in 2014.

States with larger increases (1.7 years or more) in the average age at first birth tended to be in the western United States (California, Oregon, Washington, Utah, and Colorado), the data indicated. Greater increases were also seen in Illinois, Arkansas, and D.C.

map
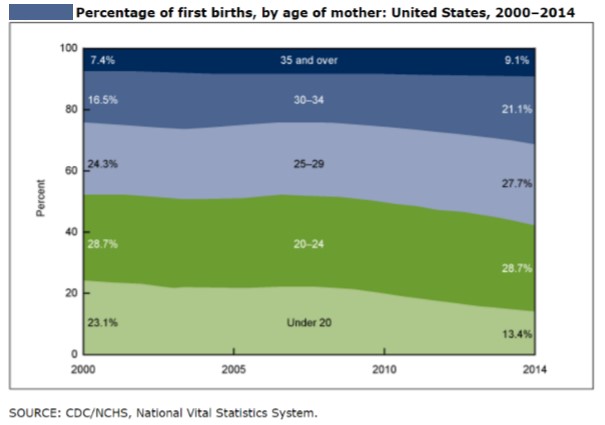
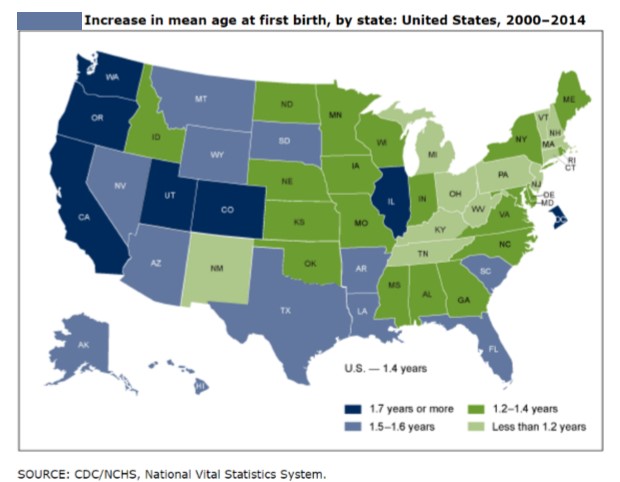
The report emphasized that over the past several decades, the United States continued to have a larger number of first births to older women along with fewer births to mothers under age 20. “This trend and the more recent uptick in delayed initial childbearing can affect the number of children a typical woman will have in her lifetime, family size, and for the overall population change in the United States,” the federal agency pointed out.

This report contains data from the birth data set, which is part of the National Vital Statistics System (NVSS). NVSS contains all live births reported in the United States. The birth data set is the primary data set for analyzing birth trends and patterns in the United States.


Advertisers Target Hispanic and Black Youth with Unhealthy Snack Ads, UConn Center Study Finds

The University of Connecticut’s Rudd Center for Food Policy & Obesity is calling on media companies to “set nutrition standards” for snack ads aimed at children and teens and “stop targeting advertising high-calorie, nutritionally poor foods to all young people,” but “especially advertising aimed at Black and Hispanic youth.” The recommendations come in the wake of a report that found that Black and Hispanic children “are exposed to more food advertising than white non-Hispanic children” and much of it is for unhealthy foods that have a greater likelihood of adversely impact children’s health.rudd-logo-300x77

The Rudd Center’s report, Snack Facts, found that Black children saw 64 percent more snack food ads on TV compared to white children, and Black teens viewed 103 percent more compared to white teens.  The disparity, according to the report issued last fall, had increased between 2010 and 2014, the most recent year studied.  “FACTS” is an acronym for “Food Advertising to Children and Teens Score.”

The findings also indicated that in addition to a barrage of advertising for unhealthy snacks, Black children and teens saw approximately 50 percent and 80 percent more ads for healthier fruit and yogurt brands – although the positive findings were generally outdistanced by findings of concern.  Black children also saw 99 percent more ads for savory snacks and Black teens saw 129 percent more, compared with white children and teens.spanish snak ads

From 2010 to 2014, TV ads for savory snacks (salty or spicy) viewed by black children increased 48 percent and ads viewed by black teens increased 95 percent.  “Given that youth of color suffer from higher rates of obesity and other diet-related diseases,” the Rudd Center indicated, “snack food advertising likely exacerbates health disparities affecting their communities.”

Two-thirds of 2- to 5 year-olds and more than half of youth ages 6 to 19 report having three of more snacks per day, and Americans are spending more on snacks – an increase of more than $100 million from 2012 to 2015, according to data cited in the report.

The Rudd Center report found that snack advertising on Spanish language television had changed dramatically between 2010 and 2014, and not for the better:

  • Yogurt advertising declined by 93 percent, and not one fruit brand advertised on Spanish-language TV in 2014.
  • Spending on savory snack ads (salty/spicy snacks) skyrocketed 551 percent and sweet snack ads rose 30 percent.
  • Ads for unhealthy snacks comprised 88 percent of snack food ads viewed by Hispanic children on Spanish-language TV in 2014, a dramatic jump from 39 percent in 2010.

The 102-page report reviewed the advertising practices of specific companies in the snack food industry, and highlighted changes in advertising emphasis.  It also tracked trends in advertising on social media.  The advertising analysis examined 90 brands spending more than$1 million in total advertising in 2014 from 43 different companies, according to the report. chips

The report suggested that “media companies could provide lower rates for advertising that promotes nutritious foods,” noting that aggressive marketing of unhealthy snack foods to children and teens exacerbates the crisis of poor diet and related diseases among young people.”

Snack FACTS examined the nutritional quality and advertising for 90 snack food brands offered by 43 companies that were marketed to U.S. children and teens on TV, internet, and in schools in 2014. Researchers analyzed healthier snacks, including yogurt, fruit, and nuts, as well as unhealthy snacks, including sweet and savory snacks such as cookies, chips, and fruit snacks, comparing 2010 and 2014 when possible.

The report also indicates that “companies have recognized the business opportunity in marketing healthy snacks to young people,” and urges those companies to respond in children and youth’s best interest.

The Rudd Center for Food Policy & Obesity, which affiliated with UConn a year ago after a decade at Yale University, is a non-profit research and public policy organization devoted to improving the world’s diet, preventing obesity, and reducing weight stigma. The Rudd Center is described as “a leader in building broad-based consensus to change diet and activity patterns, while holding industry and government agencies responsible for safeguarding public health.”  Research related to the report was funded by a grant from the Robert Wood Johnson Foundation.snack food

Increasing Percentage of Children in Single-Parent Families; CT 21st in US

Single-parent households are growing more common across the U.S., new research reveals.  Connecticut ranks 21st in the percentage of children in single-parent families, although the number has steadily climbed in Connecticut as nationwide, according to data compiled by the Annie E. Casey Foundation.data Nearly 25 million children— 35% of the country’s children — lived in single-parent families in 2014, the latest full-year data.  That is an increase of 392,000 since 2010.

In Connecticut, the percentage has grown from 32 percent in 2010 to 34 percent in 2014, an increase of 3,000 children in single-parent families, but keeping the state below the national average.  In 2000, the percentage in Connecticut was 27 percent, with 211,000 children in single-parent families, compared with 252,000 in 2014, according to the data.kids

Compared with children in married-couple families, those raised by one parent are more likely to drop out of school, have or cause a teen pregnancy and get divorced as an adult, according to research.

Forty-six states reported an uptick in the number of children raised in single parent households, with the largest jumps occurring in New Hampshire and Delaware.

Utah has the lowest incidence of kids being raised by one parent (19%) followed by Idaho (26%), Wyoming (27%), Minnesota (29%), Iowa (29%), North Dakota (29%) and Nebraska (29%).  Louisiana (47%) and Mississippi (47%) top the list, with nearly half of all kids growing up in single-parent families.  The other states with a high percentage of single-parent children are South Carolina (43%), Delaware (42%) and New Mexico (41%).map

The report, released last month, also found that nationwide 26 perlogocent of children live in mother-only households and 8 percent live in father-only households.  Those numbers are virtually unchanged since 2010.  Back in 2000, however, 69 percent of children lived in married-couple households, 25 percent in mother-only homes and 6 percent in father-only households.

In Connecticut, the percentage of children living in married-couple households has fallen from 74 percent in 2000 to 67 percent in 2014.  The percentage of children living in mother-only households has increased from 21 percent to 26 percent, while the number of children in father –only households has grown by 16,000 between 2000 and 2014, from 5 percent of children to 7 percent of children.


Income Inequality in CT's 4th Congressional District is 4th Largest Gap in Nation; 2nd District Has Least Income Inequality in State

Connecticut’s 4th Congressional district, centered in Fairfield Country, has been ranked as the district with the 4th highest level income inequity in the nation.  A year ago, the 4th C.D. was ranked fifth. A ranking of congressional districts of by their level of income inequality, conducted by Bloomberg, uses the Gini coefficient, a formula that measures the distribution of income across a population. The closer a Gini number is to 1, the greater the level of inequality; the closer to zero, the closer to perfect equality. The average score for the United States was 0.4804.

All of Connecticut’s ctcountiesCongressional Districts, with the exception of the Fourth District, did better than the national average in the degree of income inequality.

Bloomberg Businessweek has previously pointed out that the U.S. congressional districts with the most inequality share certain traits: “they contain a small, enormously wealthy elite surrounded by impoverished neighbors.” Most of the districts with the greatest disparity are located in or near major urban metropolitan areas.

The greatest income inequality in the most recent analysis indicated that the Congressional Districts with the most income inequality are Pennsylvania’s 2nd District, New York’s 10th District, and Florida’s 27th District.  Following Connecticut’s 4th District on the list are Illinois; 7th District, and three additional Congressional Districts in New York – the 12th, 7th and 16th.  Rounding out the 10 C.D.’s with the most income inequality are Ohio’s 11th District and Georgia’s 5th District.inequality

In Connecticut’s 4th Congressional District, which includes Bridgeport, the state’s largest city, as well as the communities often referred to as the “Gold Coast,” 59.3 percent of the population has household income in the highest quintile, while 6.7 percent of households have income below the poverty level.

Connecticut’s 5th Congressional District (.4810) ranked number 88 on the list of Congressional Districts with the most income inequality among residents.  The state’s 3rd Congressional District (.4792) ranked at number 95, and the 1st C.D. (.4631) at number 175.  Much later in the rankings, Connecticut’s 2nd District (.4261) came in at number 387, indicating it is the C.D. in Connecticut with the least income inequality.

The Gini coefficient, which is calculated by the U.S. Census from household income share by quintiles, was used to measure distribution of wealth. It ranges from zero, which reflects absolute equality, to one, complete inequality. The data was updated in November 2015, using 2014 data.  In 2014, a person living alone making less than $12,071 was classified as in poverty. The threshold increases for each additional household member and varies by the number of adults and children in each household.


Hartford Radio Ratings Reflect Dominance of FM Stations

The most recent radio ratings in the Hartford market confirm the dominance of FM radio and the continued long slide of AM radio and audience levels overall.  The top seven most listened-to stations in the market are FM, led by perennial ratings leader WRCH-FM, a CBS Radio owned Adult Contemporary format station, with an 11.6 rating. Tightly bunched behind WRCH-FM are WWYZ-FM (country music), with a rating of 7.5, WTIC-FM (hot adult contemporary) at 7.4, WHCN-FM (classic hits) at 7.0 and WKSS-FM (contemporary hits) at 6.9. on air

Rounding out the top eight are WZMX-FM at 6.5, WDRC-FM at 6.3, and WTIC-AM at 5.9.

Then the ratings drop down to WNPR-FM at 2.6, WDRC-AM at 1.1, WFCR-FM (based in Amherst, MA) at 0.9 and WPOP-AM at 0.1.  WPOP recently switched to a news/talk format, and plans to broadcast Hartford Yard Goats minor league baseball games.  WDRC-FM switched to a Classic Rock format, similar to the music that played a decade ago on WCCC and WHCN.

The ratings profile, covering listening habits in November 2015, contains an quarter hour share (AQH) rating -- the average number of persons, ages 6+, who listened during any average quarter hour from 6am to midnight, Monday through Sunday in the Survey Area, Metropolitan Hartford.radio ratings

Fifteen years ago, before smart phones, internet radio, satellite radio and a limitless supply of alternate listening options, the numbers were higher across the board, and AM radio – in the case of WTIC – was often at the top of the list, or not far behind.

Here’s what the ratings looked like in April 2001:

WTIC-AM1080 was the most-listened-to radio station in the Hartford market, posting a 13.1 share in the winter rating period, up from the 10.3 it logged in the fall ratings.  WRCH fell from 11.8 to 10.5 to finish second. WKSS-FM also suffered a ratings drop, as reported at the time by the Journal Inquirer. The station racked up an 8.2 rating, down from the 9.7 it chalked up during the fall ratings period.

WWYZ-FM advanced from a 6.6 to a 7.7 to finish fourth overall.  WTIC-FM enjoyed a slight improvement, advancing from 6.8 to 7.0.  Rounding out the Top 10 were WDRC-FM (4.9), WCCC-FM (4.8), WDRC-AM (3.7), WMRQ-FM (3.) and WHCN-FM (3.1, up from 2.8).

Finishing 11th was WZMX-FM, which slid from a 3.1 in the fall to a 2.7 in the winter. WAQY-FM (West Springfield,MA), , finished 12th with a 1.9 rating.  The area's all-sports station, WPOP-AM1410, was far back in the pack with a 0.7 share.

Among the morning programs, in overall ratings, WTIC's Ray Dunaway and Diane Smith attained a 17.2 rating. WRCH was second with an 8.8 share. WTIC-FM was third with an 8.4 share, followed by WWYZ and WKSS. WCCC-FM gained a half-point to finish sixth with a 6.4 share.WRCH1

A new station took high honors among the 25-54 demographic among morning shows. WTIC-FM and host Gary Craig posted an 11.3 to grab the No. 1 spot.  WTIC-AM was second with a 10.4 rating.  WRCH was third, followed by WCCC.howard stern

In the 18-34 age bracket, WKSS was No. 1, WCCC was second overall in the young demographic. In morning shows, WCCC and Howard Stern continued in the No. 1 position. WCCC grabbed a 15.6 share in the morning, WKSS was second, at 12.8.  WMRQ and its morning host, former Twisted Sister lead singer Dee Snider, attained a 10.7 rating.

$100,000 Grant to Nonprofit Collaborative Efforts to Assist Immigrants in Connecticut

George Soros has been a prominent international supporter of democratic ideals and causes for more than 30 years. His philanthropic organization, the Open Society Foundations, supports democracy and human rights in more than 100 countries. Now, the Open Society Foundation’s Emma Lazarus II Fund has officially granted $100,000 to The Community Foundation for Greater New Haven (CFGNH) on behalf of the Immigrant Strategic Funders Collaborative for Connecticut (The Collaborative) for the period that began on November 1, 2015 and continues through December 31, 2016.Open Society Foundation Logo

The Collaborative aims to provide matching funds to enhance statewide efforts and local work supporting Connecticut’s immigrant families.

The Collaborative seeks to increase the numbers of applicants for administrative relief under these programs, to ensure the applicants are screened for eligibility for more permanent immigration benefits and to continue to expand current advocacy work in support of stronger protections from detention, deportation and abuse.immigrant

The grant comes as the organization prepares to move forward with implementation of both Deferred Action for Parental Accountability (DAPA) and the expansion of Deferred Action for Childhood Arrivals (DACA), under President Obama’s 2014 Executive Actions.  Officials indicate that to achieve their objectives, The Collaborative will prioritize the following:

  • Increasing access for undocumented immigrants to a full spectrum of immigration services, including legal services;
  • Promoting the understanding of DACA and DAPA and to support outreach to DACA-eligible and DAPA-eligible residents across Connecticut;
  • Strengthening advocacy efforts at the local and State levels in support of public policy and public funding that will address the needs of undocumented immigrants and will advance the utilization of DACA and DAPA; and
  • Enhancing the capacity of immigrant serving and advocacy nonprofit organizations through funding and through supporting the sharing of knowledge and best practices.

community-foundation-560x302Thus far, eight leading funding institutions in Connecticut have expressed their intentions to commit financial contributions in support of the Collaborative goals utilizing their institutional grant-making process.  Those organizations include Fairfield County’s Community Foundation, Hartford Foundation for Public Giving, Hispanic Federation, Perrin Family Foundation, Progreso Latino Fund (a committee-advised fund at CFGNH), Tariq Farid Foundation and The Community Foundation for Greater New Haven.

Officials say that the success of The Collaborative will depend largely on the partnerships it can build with service providers, advocacy organizations and others throughout the State of Connecticut that share the goal of enhancing the lives of undocumented immigrants. The Collaborative is working with a growing list of organizations, with further additions anticipated.  Among those thus far:

  • Apostle Immigration Services (New Haven)
  • Center for Latino Progress (Hartford)
  • City of New Haven
  • City of Hamden
  • Congregations Organized for a New Connecticut (New Haven and Bridgeport)
  • Connecticut Parent Power (Statewide)
  • Connecticut Students for a Dream (Statewide)
  • Elm City Internationals (New Haven)
  • Hartford Public Library (Hartford)
  • International Institute of Connecticut (Statewide)
  • Junta for Progressive Action (New Haven)
  • Neighbors Link Stamford (Stamford)
  • New Haven Legal Assistance Association (New Haven)
  • Unidad Latina en Acción (New Haven)
  • Yale Law School Worker and Immigrant Rights Clinic (New Haven)

CT Cities Above Average in Pursuing Equal Rights for LGBT Residents, Led by New Haven, Stamford

The Human Rights Campaign (HRC), the nation’s largest lesbian, gay, bisexual, and transgender (LGBT) civil rights organization, has released its fourth annual report assessing LGBT equality in 408 cities across the nation, including seven in Connecticut. The average score for cities in Connecticut is 74 out of 100 points, above the national average of 56. The 2015 Municipal Equality Index (MEI), the only nationwide rating system of LGBT inclusion in municipal law and policy, shows that cities across the country, including in Connecticut, continue to take the lead in supporting LGBT people and workers, even when states and the federal government have not.MEI-cover-1600x900

Connecticut’s municipal scores are: New Haven: 99, Stamford: 91, Hartford: 91, Waterbury: 70, New Britain: 63, Storrs (Mansfield): 54, and Bridgeport: 51.  Across the country, 47 cities earned perfect 100-point scores, up from 38 in 2014, 25 in 2013 and 11 in 2012, the first year of the MEI. This year’s MEI marks the largest number of 100-point scores in its history.  Stamford scored the biggest jump in Connecticut from last year's analysis, advancing nearly 30 points while four other Connecticut cities also included last year earned similar scores in 2015.

For LGBT Americans, legal protections and benefits vary widely from state to state, and city to city. The MEI rates cities based on 41 criteria falling under five broad categories:

  • Non-discrimination laws
  • Municipality’s employment policies, including transgender-inclusive insurance coverage, contracting non-discrimination requirements, and other policies relating to equal treatment of LGBT city employees
  • Inclusiveness of city services
  • Law enforcement
  • Municipal leadership on matters of equality

The review indicates that in 31 states, LGBT people are still at risk of being fired, denied housing or refused service because of who they are, and who they love. The lack of legal protection in many states is driving the HRC effort to pass the Equality Act, which would extend nationwide non-discrimination protections to LGBT Americans. Officials say that the MEI is a crucial tool in evaluating the patchwork of LGBT policies and practices in cities and towns across the nation.

New Haven received an initial score of 94, before receiving 5 bonus points for municipal services and being a “welcoming place to work.”  The Elm City earned perfect scores in 4 of the 5 categories - for non-discrimination laws, municipal services, law enforcement and the relationship with the LGBT community.  Hartford earned a perfect score in three categories, but fell short in “law enforcement” and “municipality as an employer”.  The city has an initial score of 84, before receiving 7 bonus points, for providing services to LGBT elderly, youth, homeless, and people living with HIV/AIDS. muni index

Bridgeport earned a perfect score in one category, non-discrimination laws, but a 0 in the “municipality as employer” category.  The city did, however, receive 2 bonus points for being a “welcoming place to work.”

In 2014, the MEI included only five cities in Connecticut – Bridgeport, Hartford, New Haven, Stamford and Storrs (Mansfield). Stamford jumped 29 points in a year, while New Haven and Hartford each lost a point between last year and this year’s survey.  Bridgeport and Storrs also dropped slightly in the new ratings. The scores last year:  New Haven: 100, Hartford: 92, Stamford: 62, Storrs 59, Bridgeport: 57. Stamford’s much higher rating was driven by three categories: non-discrimination laws, where the score moved from 18 to 30, relationship with the LGBT community, which increased from 2 to 8 and also picked up 7 bonus points, and municipal services, which increased from 10 to 16.

“Across our country, cities and towns both big and small aren’t waiting for state or national leaders to move LGBT equality forward,” said HRC President Chad Griffin. “Instead, these municipalities are taking action now to improve the lives of countless LGBT Americans. In what has been an historic year for equality, a record-breaking number of municipalities this year have earned top scores in our Municipal Equality Index for their inclusive treatment of their LGBT citizens and workers. They are making a powerful statement that no one should have to wait for full equality - the time is now.”

Key findings contained in the MEI, issued in partnership with the Equality Federation, provide a revealing snapshot of LGBT equality in 408 municipalities of varying sizes, and from every state in the nation. The cities researched for the 2015 MEI include the 50 state capitals, the 200 most populous cities in the country, the five largest cities in every state, the city home to the state’s two largest public universities, and an equal mix of 75 of the nation’s large, mid-size and small municipalities with the highest proportion of same-sex couples.

"This year, an unprecedented wave of discriminatory legislation attempted to roll-back our efforts for LGBT equality,” said Rebecca Isaacs of the Equality Federation. “Despite that challenge, over 20 towns and municipalities passed non-discrimination ordinances, some in the most unexpected places. These wins, along with historic LGBT visibility, speak to the tenacity of our advocates all across the country, many of whom donate their time to achieve fairness and equality. The MEI is an important tool for our movement that illustrates our successes and the work ahead of us. We will not stop until all Americans have a fair opportunity to provide for themselves and their families, free from the scourge of discrimination."

The 2015 MEI revealed that 32 million people now live in cities that have more comprehensive, transgender inclusive non-discrimination laws than their state or the federal government. Cities with a higher proportion of same-sex couples tended to score better, officials said, and the presence of openly-LGBT city officials and LGBT police liaisons also were correlated with higher scores.  The average city score was 56 points, with half of the cities researched scoring over 61 points. Eleven percent scored 100 points; 25 percent scored over 77 points; 25 percent scored under 31 points; and five percent scored fewer than 10 points.

At the state level, earlier this year, the Connecticut legislature approved a new law ensuring that transgender people can change their birth certificates to reflect their correct name and gender without unnecessarily expensive and invasive obstacles. The new law simplifies the process by empowering transgender people to change their birth certificate by providing a statement of appropriate treatment by a healthcare provider.  It took effect on October 1.  Similar laws have been approved in Hawaii, California, Iowa, New York and Vermont.

The full Human Rights Campaign report, including detailed scorecards for every city, as well as a searchable database, is available online at www.hrc.org/mei.

Fairfield County’s Community Foundation Strives to Create Opportunities for Young Adults Close to Home

For Fairfield County’s Community Foundation, two local trends are unmistakable.  Connecticut’s population is aging, and too many young people are unable to become self-sufficient by age 25. The recognition that as older, experienced workers retire, Connecticut’s economy will increasingly rely on young adults to provide goods and services, lead companies, and start new businesses has been the impetus for action, and a new initiative underway this fall.thrive

Fairfield County’s 100,000 young people ages 16 to 24 face youth unemployment rates between 13.6 percent and 49.5 percent, one of the nation’s most expensive housing markets, and a shortage of living-wage entry jobs.

A multi-faceted initiative, Thrive by 25, has begun with the clear goal of advancing opportunity for the region’s young adults – no easy task in Fairfield County.thrive

“If our young people are not prepared for tomorrow’s jobs, or they relocate to find quality jobs and housing they can afford, employers will recruit from other states or leave. Businesses will struggle. Unemployment will rise, our tax base will shrink, and the need for government services will increase,” the organization’s website sums up the challenge.

“Our vision is for every young person in Fairfield County to achieve self-sufficiency, thrive by 25, and enrich their communities. We see three paths to this accomplishment: college readiness and scholarships, vocational education, and quality internships,” the website indicates.fccf_large

The program brochure is encouraging, noting that in a local survey 95 percent of respondents ages 18 to 25 have some vision of what they want to achieve in a career and many are interested in completing a master’s degree.  In addition, the “intersection of jobs and education” is highlighted:  “a growing body of research suggests that low-income teens who participate in after-school internships and summer jobs during high school are likely to have higher grades, better attendance, a greater likelihood of graduation, and a higher average salary throughout their lifetime.”

unemploy statThe action plan is spurred by clear concerns: “When young people are not attending school or working, they cannot attain necessary education or work experience, support themselves, save for their future, or contribute to the economy. What future do they face? What future does Fairfield County face?”
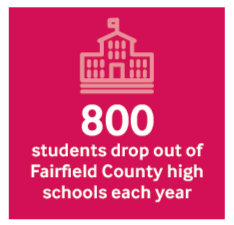
Seven steps have been developed to guide the effort:

  1. Listen to Fairfield County’s young adults.
  2. Reach out to others who have a role in making an impact on these issues.
  3. Make vocational-technical secondary school programs, apprenticeships and personalized training more widely available to high school students.
  4. Enhance early college programs and the transition from high school to college
  5. Tap into the lessons learned from other local and national efforts
  6. Ensure local nonprofits are prepared to be key participants in Thrive by 25
  7. Focus the Community Foundation’s resources as effectively as possible

A highly attended Kick-off Breakfast at the Trumbull Marriott launched the initiative, with JPMorgan Chase & Co. announcing an expansion in their commitment to Connecticut, joining the Community Foundation in supporting the Pathways to Careers Fairfield County pilot with a $200,000 grant. The grant is part of JPMorgan Chase & Co.’s New Skills at Work initiative, which seeks to address the skills gap that exists across many industries, where not enough trained workers have the specific skills to fill the jobs available.800

Pathways to Careers Fairfield County is a multi-sector partnership with high-opportunity and high-growth employers and is based on Our Piece of the Pie’s Pathways to Careers model. Our Piece of the Pie, a Hartford-based, urban youth development and workforce opportunity non-profit organization, has developed the successful upstate CT Pathways to Careers program into a best-practice model for moving young people quickly into jobs with career pathways.

Fairfield County’s Community Foundation promotes philanthropy as a means to create change in Fairfield County, with a particular focus on innovative and collaborative solutions to critical issues impacting the community. Individuals, families, corporations and organizations can establish charitable funds or contribute to existing funds.

The vision of the Thrive by 25 initiative is “to give all Fairfield County youth the opportunity to thrive by age 25 – no matter their family income, school district or zip code.”  For more information, visit www.FCCFoundation.org.


CT’s Dropping College Enrollment Expected to Rebound with Different Demographics

Parents of third graders, take note: If demographic patterns hold, your children could be in the largest U.S. college freshman class ever – and likely the most diverse as well.  Although the high numbers may be lower in Connecticut and the Northeast than elsewhere in the country, the demographic changes are strongly expected. The projections are based on the latest analysis from the Pew Research Center, reflecting that in 2007 U.S. births surpassed 4.3 million – a level not seen since 1957, when college enrollment was less common. Based on current trends, demographers make assumptions about the share of those children who will eventually graduate from high school and go on to college.

imageAccording to the Western Interstate Commission on Higher Education (WICHE), the high school class of 2025 will be the largest and most ethnically diverse class in the nation’s history – but before the bump, there is a decline.  That’s what colleges and universities are experiencing now.

This academic year at the state’s four regional state universities (Central, Southern, Eastern and Western), enrollment declined by 1,061 full- and part-time students, a 3 percent drop. Capital Community College in Hartford experienced the largest enrollment drop among the state’s 12 community colleges with 731 fewer students, an 18 percent dip.  Other colleges with sizable drops included Asnuntuck in Enfield (10 percent), Gateway in New Haven (9 percent); Quinebaug Valley in Killingly (8 percent); and Housatonic in Bridgeport (1 percent).  Overall, the state college admissions decline was 6.1 percent. FT_15.09.10_class2025

With support from the State Capitol, UConn has been able to swim against the tide - the largest freshman class ever at the University of Connecticut — 3,800 students — began the current semester at the Storrs campus. This year's freshman class at Storrs has 220 students more than last year's class of 3,580, and this year's class includes a slightly higher percentage of out-of-state students — 43 percent, compared with 40 percent last year, according to published reports.  Diversity of the students has declined slightly this year, even as the number of international students has climbed dramatically, more than doubling over the past two years.

In Virginia, public four- and two-year schools expect to see a 5 percent head count increase by the 2021-22 academic year, according to projections submitted to the State Council of Higher Education for Virginia, before the numbers begin to rebound. Nationwide since 2009, the number of first-time, full-time freshmen has come down somewhat (from 2.5 million to 2.4 million in 2013), Pew reports.

Generally, the number of first-time, full-time college freshmen tracks closely with the number of births from 18 years earlier. In the post-recession era, about 70 percent of high school graduates go on to be first-time, full-time freshmen in either a two- or four-year college.

The last enrollment peak happened in 2009, when the children of Baby Boomers reached college age (and 18 years after 1991’s 4.1 million births). FT_15.09.10_class2025_200pxIn addition, the Great Recession encouraged many young adults to ride out the difficult job market by continuing their education.

After the current admissions downturn, the next “college admissions bubble” is due to arrive with dramatic demographic shifts as well. Immigration and births of second-generation immigrants are likely to drive up the shares of Hispanic and Asian students.

Already, over the past two decades, the share of students graduating from public high schools who are white and non-Hispanic has declined dramatically – from 73 percent in 1995 to 57 percent in 2012, according to the most recent data available, Pew reports. In that time period the shares that are Hispanic and Asian have grown. WICHE projects that this trend will continue, with the public high school graduating class of 2025 being barely majority white (51 percent).chart

The WICHE report Knocking at the College Door predicted in 2013 that in the South, the most populous region in the country, the number of high school graduates in 2027-2028 would be 8 percent larger than it was in 2008-2009. The situation in the Northeast, which the report defines as Connecticut, Pennsylvania, Maine, Massachusetts, New Hampshire, New Jersey, New York, Rhode Island, and Vermont, is less rosy, according to the Rockefeller Institute of Government. In this region, the number of high-school graduates is expected to decline by 10 percent between 2009 and 2028. This means approximately 65,000 fewer students will be coming through the educational pipeline and moving into higher education, according to the report.

Nonetheless, a report prepared in 2014 for the Connecticut Board of Regents for Higher Education, Transform CSCU2020, called for the 17-institution system to take steps to increase enrollment by 2019.  The report, now largely discredited, called for increased enrollment at every institution, with some as high as 10-15 percent.

The consultant repmaport called for an increase of 36,000 students system-wide without adding additional faculty or space.  The 17 institutions currently have a total of 92,000 students.  The report recommended experimentation with price reductions for out-of-state-students, changing the name of the state system, asserting a new brand position, developing a new logo and color palette, maintaining low tuition increases, centralizing and outsourcing administrative services such as call centers and marketing, and developing goals for students success and metrics to track progress.