Economic Insecurity Plagues More Than Half of Single Seniors in CT, Report Finds
/More than half of single adults age 65 and older in Connecticut can’t afford food, housing or other basic necessities, based on their income. The “economic insecurity” of that population ranks Connecticut the 13th highest rate in the nation. In the neighboring states of Massachusetts, New York, and Rhode Island, the situation is even worse. Massachusetts, in fact, has the second highest rate in the nation. Nationwide, 53 percent of single older adults fall below the index’s target value. In Connecticut, the percentage is 56.1 percent.
The report, Living Below the Line: Economic Insecurity and Older Americans Insecurity in the States 2016, was published by the Center for Social and Demographic Research on Aging Publications at the University of Massachusetts Boston’s Gerontology Institute.
According to the report’s analysis, only about 15 percent of older Connecticut residents living alone fall below the poverty line, but 56.1 percent don’t make enough to live on, and often do not qualify for public assistance, because of the relatively high cost of living in the state. The gap, the report points out, is 40.8 percent of Connecticut’s single elderly, among the largest in the nation. Only four states have a larger percentage of that population below the index rate but above the poverty rate, reflecting the substantial economic insecurity in the state among the single elderly population.
The states with the largest percentage of single older adults situated below the index are Mississippi, Massachusetts, New York, Vermont, New Jersey, Rhode Island, Louisiana, New Hampshire, Arkansas, Kentucky, Maine, and Hawaii.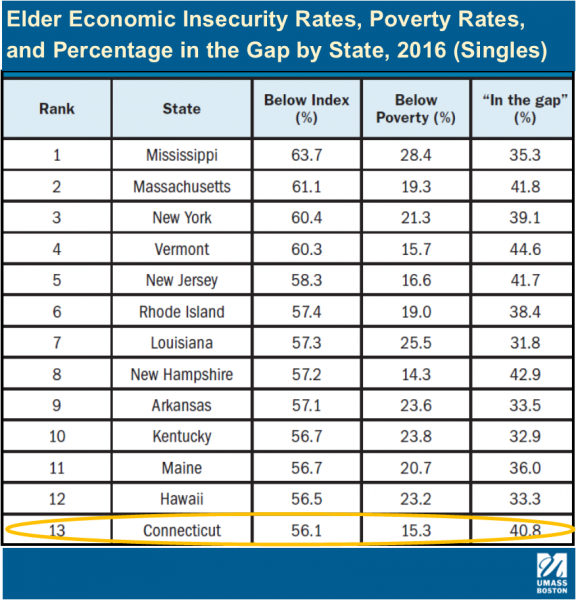
The report notes that “Northeastern states at the top of the rankings are characterized first and foremost by high Elder Index values, reflecting the high cost of living in these locations, whereas Southern states at the top of the rankings are characterized predominantly by low incomes.”
In considering the economic insecurity of elderly couples, Connecticut fared better in the analysis, ranking 25th, midway among the states. Still, fully one-quarter (25%) of the state’s elderly couples were below the index level, although only 2.9 percent fell below the poverty rate for income.
Most older adults rely on Social Security benefits as a key component of their incomes, the report pointed out. The Social Security Administration estimates that Social Security benefits provide one-third of all income received by older adults, and that lower-income elders are especially reliant on Social Security. The UMass-Boston analysis indicated that on average, half of older adults who live below the Elder Index rely on Social Security for at least 90 percent of their incomes. In Connecticut, that percentage is 46.9 percent of single older adults and 45.2 percent of older couples.
The report concluded that “many older adults who live alone do not have the means to live with economic security. These older adults are of special concern, and policy and programs that address the concerns of single or couple elders living on their own— congregate and home-delivered meals, transportation, falls prevention, employment and training—should also be of special concern to federal, state and local governments.”
Noting that “Elder Economic Insecurity Rates demonstrate that a large proportion of every state’s independent older adults lack incomes that would allow them to escape the threat of poverty, to remain independent, and to age in their own homes,” the analysis implored that “each state must learn to recognize the economic security gap and those who fall into it.”
Developed by the Gerontology Institute at the University of Massachusetts Boston and Wider Opportunities for Women, and maintained through a partnership with the National Council on Aging (NCOA), the Elder Index defines economic security as the income level at which elders are able to cover basic and necessary living expenses and age in their homes, without relying on benefit programs, loans or gifts.

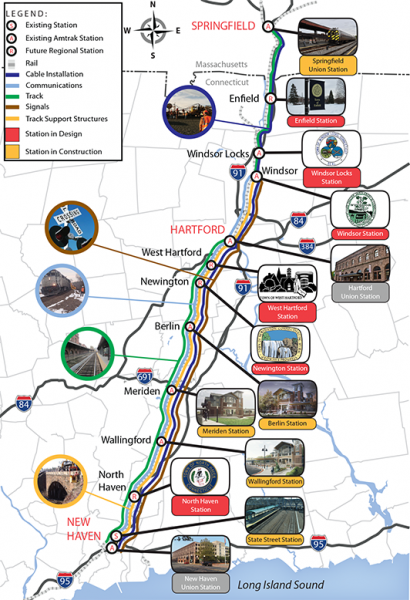 The Hartford Line will act as a regional link with connections to existing rail services, including Metro-North, Shoreline East, and Amtrak Acela high-speed rail services on both the New Haven Line to New York and on the Northeast Corridor to New London and Boston. There will also be direct bus connections to the Bradley Airport Flyer and to CTfastrak. With a heightened level of direct and connecting service linking the region, the hope is that towns along the future Hartford Line will become magnets for growth – ideal places to live and to relocate businesses that depend on regional markets and travel.
 Also, very much a part of the strengthening transportation options with the potential to spur economic development is
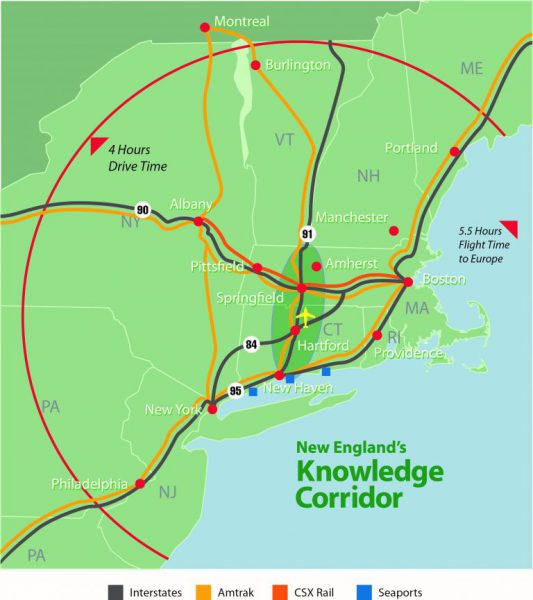
 Rounding out the top 10 are Wisconsin, Iowa, New Hampshire, Louisiana, Rhode Island, Colorado, Nebraska and South Dakota. The states were ranked based on the most gyms using these four categories: total number of gyms, state population in 2016, people per gym, and gyms per capita (100,000 people). Totals were based on the 14 largest gym chains in America. There were more than 36,000 health clubs in the U.S. last year, up from 29,000 a decade ago.

 In Connecticut, April 5, 2017, was the Connecticut SAT School Day administration. SAT scores are used by the Connecticut State Department of Education (CSDE) for school and district accountability purposes, state Education Commissioner Diana Wentzell explained in a
  Hyman found that, prior to the policy, a substantial number of Michigan’s low-income students didn’t take the ACT even though they would have scored at or above the standard for college readiness. That might been due to financial or logistical barriers, like the cost of the test (between $30 and $50) or difficulties traveling to an exam center on a Saturday. (Both the SAT and ACT offer fee waivers to low-income students, but the study notes that the waivers are underused.)
 ted Nations and vetted by the State Department in a process that takes at least 18 months. By comparison, a million or so legal immigrants arrive annually. From October 2001 through 2016, Burma, Iraq, Somalia, Bhutan, and Iran are the top five nations that send refugees to the U.S.
 There were nine states that had less than 500 refugees from a single country since October 2001: Alabama, Alaska, Arkansas, Delaware, Hawaii, Mississippi, Montana West Virginia and Wyoming.