Immigration May Be Key to Connecticut's Economic Future (Again)

Immigrants may be a pivotal component in Connecticut’s economic strength – or weakness – in the coming decade, according to recent statistics.  Population projections from the University of Virginia’s Demographics Research Group, reported by the American Immigration Council, show that in many states in the Northeast and Midwest, including Connecticut, growth of the working-age population is slowing due to aging, lower fertility rates, and people moving out of the state. The aging of the workforce in the working-age population can mean shrinking workforces and potential economic problems, the Council reported recently. As a result, “states need to think about how immigration can ameliorate impending trouble.”

By 2020, the number of working age adults (age 25-54) is expected to decline in 16 states. For example, in Maine, while the overall population is expected to decrease by about two percent, the working age population will decline by 16 percent. Vermont and West Virginia can also expect declines of more than 10 percent, while Connecticut, Illinois, Michigan, New Hampshire, Ohio, Pennsylvania, Rhode Island and Wisconsin can expect more than five percent decline, according to the data.

Those states “will become less attractive to the people who are already there, and less attractive to newcomers,” according to UC-Berkeley demographer Ronald Lee, who explained that a shrinking working-age population can hurt a state’s economy: businesses close due to a lack of workers and customers, housing prices drop, schools close, and tax revenue declines.

The decline in the working-age population will not be offset by births, the Council reported, citing data the projects the current total fertility rate is about 1.86 children per woman and would need to be at least 2.08 for the population to replenish itself. At the same time, the U.S. population is getting older and living longer. The Bureau of Labor Statistics (BLS) projects that by 2024, Americans age 55 and older will increase by 18.2 million—reaching 102.9 million, or 38.2 percent of all people in the country.

Reliance on immigrants is nothing new for Connecticut.  The Connecticut Business and Industry Association recently cited statistics from the New American Economy, which indicated that 494,059 Connecticut residents were born abroad.  That is 14 percent of the state’s population, compared to 13 percent across the United States.

For example, almost a quarter (23%) of Connecticut workers in science, technology, engineering, and math fields such as healthcare and bioscience were immigrants.  Over 36,000 foreign-born Connecticut residents are self-employed, with immigrant-owned businesses generating $1.1 billion income in 2014 while employing 73,047 people. “Immigrants are already playing a huge part ensuring that Connecticut remains a leading innovator in industries like healthcare and bioscience,” according to the analysis.

The report also notes that foreign-born workers currently make up 21.3 percent of all entrepreneurs in the state, despite accounting for 13.7 percent of Connecticut’s population.

Immigration mitigates the downward population trends that are anticipated, in Connecticut and beyond. In many areas of the country, the foreign born have accounted for more than 20 percent of the growth of the adult population since 1990. In some areas – mainly in the Midwest – overall adult population would have declined if not for an increase in the foreign born population. Almost half of immigrants admitted between 2003 and 2012 were between the ages of 20 and 40, while only 5 percent were ages 65 or older, the Council reported.

Economic Insecurity Plagues More Than Half of Single Seniors in CT, Report Finds

More than half of single adults age 65 and older in Connecticut can’t afford food, housing or other basic necessities, based on their income.  The “economic insecurity” of that population ranks Connecticut the 13th highest rate in the nation.  In the neighboring states of Massachusetts, New York, and Rhode Island, the situation is even worse.  Massachusetts, in fact, has the second highest rate in the nation. Nationwide, 53 percent of single older adults fall below the index’s target value.  In Connecticut, the percentage is 56.1 percent.

The report, Living Below the Line: Economic Insecurity and Older Americans Insecurity in the States 2016, was published by the Center for Social and Demographic Research on Aging Publications at the University of Massachusetts Boston’s Gerontology Institute.

According to the report’s analysis, only about 15 percent of older Connecticut residents living alone fall below the poverty line, but 56.1 percent don’t make enough to live on, and often do not qualify for public assistance, because of the relatively high cost of living in the state.  The gap, the report points out, is 40.8 percent of Connecticut’s single elderly, among the largest in the nation.   Only four states have a larger percentage of that population below the index rate but above the poverty rate, reflecting the substantial economic insecurity in the state among the single elderly population.

The states with the largest percentage of single older adults situated below the index are Mississippi, Massachusetts, New York, Vermont, New Jersey, Rhode Island, Louisiana, New Hampshire, Arkansas, Kentucky, Maine, and Hawaii.

The report notes that “Northeastern states at the top of the rankings are characterized first and foremost by high Elder Index values, reflecting the high cost of living in these locations, whereas Southern states at the top of the rankings are characterized predominantly by low incomes.”

In considering the economic insecurity of elderly couples, Connecticut fared better in the analysis, ranking 25th, midway among the states.  Still, fully one-quarter (25%) of the state’s elderly couples were below the index level, although only 2.9 percent fell below the poverty rate for income.

Most older adults rely on Social Security benefits as a key component of their incomes, the report pointed out. The Social Security Administration estimates that Social Security benefits provide one-third of all income received by older adults, and that lower-income elders are especially reliant on Social Security. The UMass-Boston analysis indicated that on average, half of older adults who live below the Elder Index rely on Social Security for at least 90 percent of their incomes.  In Connecticut, that percentage is 46.9 percent of single older adults and 45.2 percent of older couples.

The report concluded that “many older adults who live alone do not have the means to live with economic security. These older adults are of special concern, and policy and programs that address the concerns of single or couple elders living on their own— congregate and home-delivered meals, transportation, falls prevention, employment and training—should also be of special concern to federal, state and local governments.”

Noting that “Elder Economic Insecurity Rates demonstrate that a large proportion of every state’s independent older adults lack incomes that would allow them to escape the threat of poverty, to remain independent, and to age in their own homes,” the analysis implored that “each state must learn to recognize the economic security gap and those who fall into it.”

Developed by the Gerontology Institute at the University of Massachusetts Boston and Wider Opportunities for Women, and maintained through a partnership with the National Council on Aging (NCOA), the Elder Index defines economic security as the income level at which elders are able to cover basic and necessary living expenses and age in their homes, without relying on benefit programs, loans or gifts.

Three Metro Regions in CT Are Among Top 30 Most Educated in the US

Three Connecticut metropolitan areas are among the top 30 “most educated cities in America,” according to a new analysis.  The Bridgeport-Stamford-Norwalk area ranked #12 in the nation, narrowly missing the top 10.  Hartford-West Hartford-East Hartford placed 22nd, and New Haven-Milford ranked 29th in the ranking developed by the financial website WalletHub. The Bridgeport-Stamford-Norwalk region ranked fourth in the nation for the highest percentage of individuals who have earned Bachelor’s degrees and fifth in the percentage of “graduate or professional degree holders,” according to the analysis.  The New Haven area ranked second in the nation in the quality of universities.

Overall, the top 10 most educated cities were Ann Arbor, Washington DC, San Jose, Durham, Madison, Boston, Provo, San Francisco, Austin and Tallahassee, according to the analysis.

To identify the most and least educated cities in America, WalletHub’s analysts compared the 150 most populated U.S. metropolitan statistical areas, or MSAs, across two key dimensions, including “Educational Attainment” and “Quality of Education & Attainment Gap.”  Data used to create the overall ranking were collected from the U.S. Census Bureau, Bureau of Labor Statistics, GreatSchools.org and U.S. News & World Report.

The Ann Arbor, MI, metro area has the highest share of bachelor’s degree holders aged 25 and older, 52.7 percent, which is 3.8 times higher than in Visalia-Porterville, CA, the metro area with the lowest at 13.8 percent.

Economic Policy Institute analysts point out that one way to strengthen an economy is to attract well-paying employers “by investing in education and increasing the number of well-educated workers.” In states where workers have the least schooling, for instance, the median wage is $15 an hour compared with $19 to $20 an hour in states where 40 percent or more of the working population hold a bachelor’s degree or higher.

A similar study by WalletHub earlier this year, comparing states, ranked Connecticut as having the fourth highest educated state population, just behind Maryland, Massachusetts and Colorado.


Knowledge Corridor to Gain Boost as More Frequent Rail Runs Through It

For years, the tag line has been “innovation runs through it.”  In the coming year, there will also be more frequent rail service running through it, and that may make all the difference in the world. When proponents of economic development in what’s known as “New England’s Knowledge Corridor” get together for a conference this fall, it will be with the backdrop of the three anchor cities that span two states – New Haven, Hartford, and Springfield – being more connected than ever, with the start of the new regular rail service between the cities just months away.

The half-day conference, “Leveraging the Knowledge Corridor’s Transportation Assets and Investments to Drive Economic Progress,” will be held at Union Station in Springfield on October 18.  It will serve as the coalition’s 2017 “State of the Region” conference.

The keynote speaker will be Robert Puentes, President/CEO of the Eno Center for Transportation.  Panelists will include five members of Congress from the region:  Richard Neal and James McGovern from Massachusetts and John Larson, Rosa DeLauro, and Elizabeth Esty from Connecticut.

Plans also include talks by Connecticut Commissioner of Transportation James Redeker and his counterpart in the Bay State, Stephanie Pollack, Secretary/CEO of the Massachusetts Department of Transportation.  Officials also anticipate releasing the results of the 2017 New England Knowledge Corridor Business Survey.

"In the Knowledge Corridor, we’re convinced that the transportation assets we have; new ones that will be coming online in the  next year or two, plus; those we are planning to see realized over a longer range time line constitute the bedrock of a competitive 21st century economy that enables ready and affordable access to skilled workers, attractive markets and motivated consumers on a global scale," Tim Brennan, Chairman of New England Knowledge Corridor Partnership and Executive Director of the Pioneer Valley Planning Commission, told CT by the Numbers.

On Monday, Governor Dannel P. Malloy announced that a joint venture of TransitAmerica Services and Alternate Concepts has been selected as the service provider that will operate and manage service on the Hartford Line – which is expected to launch in May 2018.

Work is continuing throughout the summer, including grade crossing upgrades in Wallingford this month, as part of the overall upgrade of the New Haven-Hartford-Springfield rail line – now branded as the CTrail Hartford Line, with expanded service scheduled to being in 2018, according to transportation officials.  Last month, construction in Meriden and Windsor included track construction upgrades.

New England’s Knowledge Corridor is an interstate partnership of regional economic development, planning, business, tourism and educational institutions that work together to advance the region’s economic progress. The region “transcends political boundaries,” officials point out, and it comprises the Hartford, Springfield and New Haven metro areas and is centered on seven counties in the two states, underscoring the area’s “rich tradition of inventions, research and higher education.”

The New Haven-Hartford-Springfield (NHHS) Rail Program is a partnership between the State of Connecticut, Amtrak and the Federal Railroad Administration.  The goal is to provide those living, working or traveling between New Haven, Hartford and Springfield with high speed rail service equal to the nation’s best rail passenger service, officials emphasize.

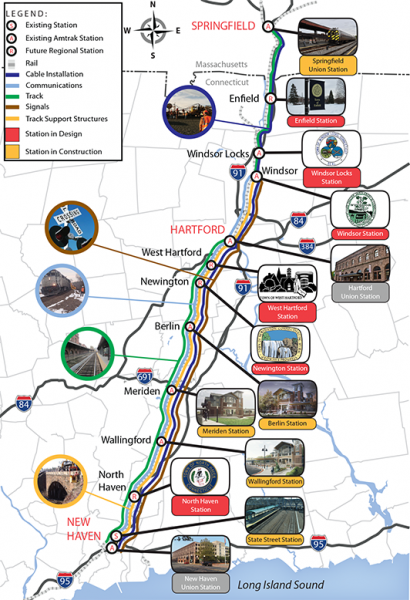
The Hartford Line will act as a regional link with connections to existing rail services, including Metro-North, Shoreline East, and Amtrak Acela high-speed rail services on both the New Haven Line to New York and on the Northeast Corridor to New London and Boston. There will also be direct bus connections to the Bradley Airport Flyer and to CTfastrak.  With a heightened level of direct and connecting service linking the region, the hope is that towns along the future Hartford Line will become magnets for growth – ideal places to live and to relocate businesses that depend on regional markets and travel.

All of which dovetails perfectly with the “selling points” routinely used to promote the Corridor:

  • Academic Powerhouse – One of the country’s highest academic concentrations and largest capacities for research, with 41 colleges and universities and 215,000 students
  • Exceptional Achievement – Consistently among the nation’s top 10 in percentage of the population with advanced degrees, science-engineering doctorates and new patents registered
  • Big, Concentrated Market – The nation’s 20th largest metro region, with over 2.77 million people, is comparable to Denver and St. Louis, but with twice their population density, which means ready access to labor and consumers
  • Large Workforce – A labor force of 1.34 million, 50% larger than the Charlotte metro area
  • Business Hub – 64,000 businesses – 60 percent more than the Austin metro

"Providing frequent, reliable, commuter rail service connecting New Haven-Hartford-Springfield, the three major cities that anchor the Knowledge Corridor and its over 2.7 million people, will be nothing short of a game changer enabling the cross border region’s to reach its potential as an economic powerhouse within New England while simultaneously linking it to the white hot economies found in the Boston and New York City mega regions," Brennan added.

The CTrail Hartford Line rail service will operate at speeds up to 110 mph, cutting travel time between Springfield and New Haven to as little as 81 minutes. Travelers at New Haven, Wallingford, Meriden, Berlin, Hartford, Windsor, Windsor Locks and Springfield will be able to board trains approximately every 30 minutes during the peak morning and evening rush hour and hourly during the rest of day, with direct or connecting service to New York City and multiple frequencies to Boston or Vermont (via Springfield).  New train stations also are in various stages of development in North Haven, Newington, West Hartford and Enfield.

Also, very much a part of the strengthening transportation options with the potential to spur economic development is Bradley International Airport, which recently has added international flights on Aer Lingus (last year) and Norwegian Air (last month) and a direct-to-San Francisco route via United Airlines.

Connecticut Airport Authority Executive Director Kevin A. Dillon said the aim is to “build on Bradley’s strengths and continue our focus to deliver more convenience and connectivity for our region.  Flying to Europe from Bradley has never been easier and more affordable.”

The Connecticut Department of Transportation (CTDOT) conducted a bidding process and cost-benefit analysis for the Hartford Line program and selected TransitAmerica Services and Alternate Concepts, which are forming a joint venture solely for the purpose of serving the Hartford Line. This marks the first time that CTDOT has been able to select and contract with an experienced service provider for a major transportation program, a more cost-efficient alternative to the agency creating a separate internal unit and hiring employees to manage the Hartford Line, according to state officials.

Connecticut Ranked #2 Among States for Fitness Centers/Gyms

The United States has more fitness centers than any other country in the world, and Connecticut is one of the reasons why.  The state is ranked #2 in the nation, just behind Minnesota, among states with the most gyms/fitness centers, according to data compiled by the website exercise.com.  Rounding out the top 10 are Wisconsin, Iowa, New Hampshire, Louisiana, Rhode Island, Colorado, Nebraska and South Dakota. The states were ranked based on the most gyms using these four categories: total number of gyms, state population in 2016, people per gym, and gyms per capita (100,000 people).  Totals were based on the 14 largest gym chains in America. There were more than 36,000 health clubs in the U.S. last year, up from 29,000 a decade ago.

As of 2017, the average yearly number of U.S. gym members is around 58 million, the website points out, with an average gym membership fee of $58 a month. Interestingly, two-thirds of gym members say they don’t actually go to their gym.

According to a Gallup survey of 335,050 adults, only 51.6 percent of Americans report exercising three or more days a week for at least 30 minutes.  Connecticut has nearly 300 gyms/fitness centers.

According to the International Health, Racquet and Sportsclub Association (IHRSA), total health club/gym/studio visits surpassed 5 billion a year ago.

UConn Study: When State Pays for ACT Exam, More Poor Youth Reach College

New research finds a simple strategy can modestly boost the share of students with limited financial resources who go on to college: requiring, and paying for, all students to take the ACT or SAT.  A University of Connecticut researcher examined the effects of requiring and paying for all public high school students to take a college entrance exam – which 11 states have done since 2001- and found that while the impact isn’t enormous, the policy is relatively inexpensive, and does move the needle on college enrollment. At just $34 per student, increases in four-year college attendance reach about 1 percentage point for low-income students, the higher education website Chalkbeat reports.  Ohio was the latest state to require all members of the junior class to take the exam, as of this past spring.

“Although these increases in the four-year college enrollment rate might not appear to be dramatically large, relative to other educational interventions this policy is inexpensive and currently being implemented on a large scale,” writes Joshua Hyman, an assistant professor at the University of Connecticut.

Hyman cautions, however, that paying for every student, regardless of income, to take the exam only goes so far.

“The results suggest that requiring all students to take a college entrance exam increases the supply of poor students scoring at a college-ready level by nearly 50 percent. Yet the policy increases the number of poor students enrolling at a four-year institution by only 6 percent. In spite of the policy, there remains a large supply of disadvantaged students who are high achieving and not on the path to enrolling at a four-year college.”

The research and 30-page journal entry “validates recent efforts … to expand access to these tests,” Chalkbeat points out, “which are required to enroll at most colleges and universities.”   In order of adoption, according to the paper, the states are Colorado, Illinois, Maine, Michigan, Kentucky, Tennessee, Delaware, North Carolina, Louisiana, Wyoming, and Alabama.

In Connecticut, April 5, 2017, was the Connecticut SAT School Day administration.  SAT scores are used by the Connecticut State Department of Education (CSDE) for school and district accountability purposes, state Education Commissioner Diana Wentzell explained in a letter to parents earlier this year.

The research, published this summer in the peer-reviewed journal Education Finance and Policy, examined Michigan’s policy to require — and, importantly, pay for — high school juniors to take the ACT. Unsurprisingly, the number of students taking the exam jumped from 56 percent statewide to 91 percent after the policy was implemented in 2007. College attendance in the state then increased by nearly 2 percentage points (though the study can’t show how much of the increase was because of the mandatory ACT).

“The mandatory college entrance exam policy is more cost-effective than traditional [college financial] aid at boosting postsecondary attainment,” the study states.

Hyman found that, prior to the policy, a substantial number of Michigan’s low-income students didn’t take the ACT even though they would have scored at or above the standard for college readiness. That might been due to financial or logistical barriers, like the cost of the test (between $30 and $50) or difficulties traveling to an exam center on a Saturday. (Both the SAT and ACT offer fee waivers to low-income students, but the study notes that the waivers are underused.)

“I show that for every ten poor students taking a college entrance exam and scoring college-ready, there are an additional five poor students who do not take the test but who would score college-ready if they did,” Hyman explains.  “In spite of the policy, there remains a large supply of disadvantaged students who are high-achieving and not on the path to enrolling at a four-year college.”

Hyman, an Assistant Professor in the Department of Public Policy at the University of Connecticut, has a joint appointment in the Department of Economics and Neag School of Education. His research focuses broadly on labor economics, public finance, and the economics of education. As for the interest in Michigan, Hyman earned a Ph.D. in Economics and Public Policy from the University of Michigan in 2013.

7,000 Refugees Settle in CT Since 2001; Burma, Congo, Iran, Somalia Most Frequent Origin

The United States has long been the global leader in resettling refugees, defined as people forced to flee their home country to escape war, persecution or violence, explains Smithsonian magazine in a state-by-state comparison. Since 2001, the magazine reports, more than 895,000 refugees have settled in the U.S., typically after being referred by the United Nations and vetted by the State Department in a process that takes at least 18 months. By comparison, a million or so legal immigrants arrive annually. From October 2001 through 2016, Burma, Iraq, Somalia, Bhutan, and Iran are the top five nations that send refugees to the U.S.

Refugees to the United States have come mostly from the Middle East, Asia and Africa. While many immigrants, legal and undocumented, come from Latin America, U.S. regulations make it difficult for Central and South Americans to qualify as refugees, according to Smithsonian.

The magazine developed a series of charts that compare refugee populations resettled in 41 states since October 2001. In depicting the refugees’ nation or origin, the breakdown in each state is limited to nationalities with at least 500 people, and no more than the top 5 nationalities are shown.

The number of refugees from those five nations, as well the total number of refugees is indicated.

For Connecticut, the total number of refugees is 7,144. The largest percentage of refugees come from Burma, Democratic Republic of the Congo, Iran and Somalia.  Those four nations were the home country for 3,824 of the refugees who settled in Connecticut since 2001.

Massachusetts' total is three times Connecticut - 21,441 refugees moving to the Bay State since 2001.

States with the largest number of refugees include California (102,614), Texas (81,765), New York (53,790), Florida (46,553), Minnesota (40,762), Washington (40,111), Arizona (39,031), Michigan (38,175), and Georgia (35,328).

There were nine states that had less than 500 refugees from a single country since October 2001:  Alabama, Alaska, Arkansas, Delaware, Hawaii, Mississippi, Montana West Virginia and Wyoming.


Migration Patterns Show Some Pluses as Population Numbers Decline

Connecticut's total population has declined over the past 3 years.  In fact, in 2016 Connecticut's total population fell below 2010 levels. New England and our neighboring states have also experienced an increase in people leaving. However, Connecticut has fallen the most post-recession, according to an analysis by the Connecticut Data Collaborative. International migration has helped, the data shows, but not enough to offset domestic out-migration.  Average international in-migration has grown 29% post-recession compared to pre-recession, but in terms of overall net migration, the state has seen an increased loss starting from 2012.

The state gains prime working age adults and children and also attracts well-educated international migrants, according to the analysis, and Connecticut loses the smallest percent of graduate degree holders. By income, the largest flows are at the lowest income levels (though largely due to age of earners), though the state is experiencing a slight loss of its highest income earners (incomes of $5 million or more).

Among the factors contribution to the population decline:

  • Post-recession, Connecticut has about 14% fewer births each year compared to pre-recession averages. Increased deaths are also slightly contributing to Connecticut's overall population decline.
  • Average domestic out-migration has increased by 55% post-recession compared to pre-recession, a difference of about 9,200 people.

Young adults move at a higher rate than the rest of the population (larger flows both in and out of Connecticut), and the state is losing young adults on net (18-29 year olds), but gaining working age adults (30-49 year olds), the Data Collaborative analysis shows.

Historically, Connecticut experienced population losses to other regions of the U.S. This is also true of New England in general. However, the recent declines in Connecticut's total population are primarily driven by increasing rates of net domestic out-migration and to a smaller degree a declining birth rate. But there are positive trends.

The state gains prime working age adults and children. Connecticut also attracts well-educated international migrants, and loses the smallest percent of graduate degree holders.  By income, the largest flows are at the lowest income levels (though largely due to age of earners), though the state is experiencing a slight loss of its highest income earners (incomes of $5 million or more).

Connecticut's domestic migration trends are now more like New York and New Jersey.  However domestic out-migration has more than doubled in Connecticut while New York and New Jersey are better than pre-recession, the researchers found.

Good News, Bad News in State Health-Related Data, Analysis Finds

Connecticut is 11th best among states in the number of people who had no trouble finding a doctor in 2015, according to State Health Compare. The top 10 states were Minnesota, Kansas, Vermont, Utah, North Dakota, Montana, Maine, Nebraska, Hawaii and Tennessee.  That's the good news. But Connecticut is also 17th worst among states in the percent of residents with high medical cost burdens, at 23.1 percent. Utah has the highest percentage at 27.5 percent; Maryland the lowest at 15.3 percent, among the 50 states.

According to the data, 70.7 percent of state residents had a general doctor or provider visit during the year, a lower percentage than the national average of 73 percent, and ranking the state 38th in the nation.  The data also reveal that Connecticut is 19th lowest among states in the percent of state budget devoted to Medicaid, and 28th lowest in state public health spending per person.

Nearly one in ten Connecticut residents (9.1 percent) spent the night in a hospital during the year, 15th highest in the nation.

Created by SHADAC, State Health Compare is a new online comparison tool with state-level estimates across 46 measures of health and health care from six federal agency sources. SHADAC is a multidisciplinary health policy research center with a focus on state health policy, supported by the Robert Wood Johnson Foundation and affiliated with the Health Policy and Management Division of the School of Public Health at the University of Minnesota.

Categories in the database include health insurance coverage, cost of care, health behaviors, outcomes, access, utilization, quality of care, public health, and social and economic factors. Metrics include costs of potentially preventable hospitalizations, percent of residents who needed but did not get care due to cost, chronic disease prevalence, weight assessment in schools, and adult cancer screening rates.

Data for most measures is available for multiple years, allowing trend analysis. Within most of the 46 measures, the tool allows visitors to dive deeper into the data by subpopulations such as by age, race/ethnicity, and education level. The tool provides a map, state rank and trend display for each metric. The data can be downloaded and exported.

The data was recently featured in CT Health Notes, a biweekly informational newsletter of the Connecticut Health Policy Project. It includes research summaries, news, event notices, policy proposals and other issues important to Connecticut’s health policy.

Start-up Entrepreneurial Activity Boosts CT's Ranking from 22 to 18 Among Nation's 25 Smaller States

In a state-by-state analysis of start-up business activities, Connecticut moved from ranking 22nd among the smallest 25 states a year ago to 18th this year – the largest forward progress of any of the nation’s 25 smallest states.  Vermont also moved up four positions, from 13th to 9th.  And Kansas advanced three positions, from 18th to 15th. This year among the 25 smaller states, Nevada was top in startup activity, followed by Oklahoma, Wyoming, Montana, and Idaho. Among smaller states, eleven ranked higher than they did last year, five experienced no changes in rankings, and another nine ranked lower.

The analysis was included in the 2017 Kauffman Index Startup Activity State Report, issued this month by the Ewing Marion Kauffman Foundation, based in Kansas City.

Among the twenty-five largest states, the five states with the highest startup activity in the 2017 Index were California, Texas, Florida, Arizona, and Colorado. Seventeen out of the twenty-five largest states had higher levels of startup activity in 2017 compared to last year.  Among the twenty-five largest states, the four that experienced the biggest increase in ranks in 2017 were Massachusetts, Tennessee, Washington, and Minnesota. The three that experienced the biggest negative shifts in rank in 2017 compared to 2016 were Louisiana, Maryland, and Virginia.

After two years of large increases, startup activity rose slightly in 2016, continuing an upward trend started in 2014, the report indicated. Only three years ago, the Startup Activity Index was at its lowest point in the last twenty years. Today it has gone up three years in a row, reaching close to the peak before the Great Recession drop, the report pointed out.

Among the twenty-five smallest states, the three that experienced the biggest increase in ranks in 2017 were Connecticut, Vermont, and Kansas. The three that experienced the biggest negative shifts in rank in 2017 compared to 2016 were Hawaii, Rhode Island, and Delaware.  In the twenty-five smallest states, the five states with the highest startup activity in the 2017 Index were Nevada, Oklahoma, Wyoming, Montana, and Idaho. Eleven smaller states had higher Startup Activity Index measures this year.

The Startup Activity Index is an index measure of a broad range of startup activity in the United States across national, state, and metropolitan-area levels. The Startup Activity Index captures startup activity along three dimensions:

  • The Rate of New Entrepreneurs in the economy— the percentage of adults becoming entrepreneurs in a given month.
  • The Opportunity Share of New Entrepreneurs—the percentage of new entrepreneurs driven primarily by “opportunity” as opposed to “necessity.”
  • Startup Density—the rate at which businesses with employees are created in the economy.